Abstract
Both estrogen receptor (ER) and peroxisome proliferator-activated receptor γ (PPARγ) regulate bone metabolism, and because steroid receptor coactivator (SRC)-2 (TIF-2) enhances ER and PPARγ activity, we examined the consequences of deletion of SRC-2 on bone using SRC-2 knock out (KO) mice. Loss of SRC-2 resulted in increased bone mass, with SRC-2 KO mice having 80% higher trabecular bone volume as compared with wild type mice. SRC-2 KO mice also had a marked decrease (by 50%) in bone marrow adipocytes. These data suggested that marrow precursor cells in the SRC-2 KO mice may be resistant to the inhibitory effects of endogenous PPARγ ligands on bone formation. Consistent with this, compared with cultures from wild type mice, marrow stromal cultures from SRC-2 KO mice formed significantly more mineralized nodules (by 3-fold) in the presence of the PPARγ agonist, rosiglitazone. Using chromatin immunoprecipitation analysis, we demonstrated that in bone marrow stromal cells, loss of SRC-2 leads to destabilization of the transcription complex at the peroxisome proliferator response elements of a number of PPARγ target genes, resulting in an overall decrease in the expression of adipocyte-related genes and a marked decrease in adipocyte development. Using ovariectomy with or without estrogen replacement, we also demonstrated that SRC-2 KO mice were partially resistant to the skeletal actions of estrogen. Collectively, these findings indicate that loss of SRC-2 leads to partial skeletal resistance to the ER and PPARγ, but resistance to PPARγ is dominant, leading to increased bone mass. Modulating SRC-2 action may, thus, represent a novel therapeutic target for osteoporosis.
Multipotent mesenchymal stem cells in bone marrow are known to give rise to both osteoblasts and adipocytes (1–3), and there is accumulating evidence that there may be a differentiation switch between these cell lineages, resulting in a possible reciprocal relationship between bone marrow osteoblasts and adipocytes (4–6). Clinical studies show that the decrease in bone volume associated with osteoporosis or aging is accompanied by an increase in marrow adipose tissue (7, 8). Although the molecular mechanisms underlying this reciprocal relationship are not well understood, considerable work has established that activation of peroxisome proliferator-activated receptor γ (PPARγ)2 induces adipocyte differentiation (9) and inhibits osteoblastic differentiation of mesenchymal stem cells (10).
PPARγ is a ligand-activated transcription factor that belongs to the nuclear hormone receptor superfamily (11, 12). The ligand binding domain of PPARγ interacts with a wide variety of molecules, including polyunsaturated fatty acids and their oxidation products, modified tyrosine and leucine derivatives, PGJ2 metabolites, and thiazolidinediones (TZDs) (13–16). The production of fatty acid oxidation products increases with age and dietary fat intake, and aging is associated with an increase in fat accumulation in bone marrow and a decrease in bone mass (17, 18). Furthermore, TZDs are an effective and frequently prescribed treatment for patients with type II diabetes, although the precise mechanism(s) by which these agents enhance insulin sensitivity remains unclear at this point (19). The different ligands bind to and activate PPARγ, and together with transcriptional coregulators, they form a transcription complex that binds to response elements in the promoter regions of target genes (20, 21).
Steroid receptor coactivators (SRCs) are widely expressed in most tissues; however, their abundance is limited, and their function is cell-type specific (22–25). Recent work has shown that both SRC-1 and the closely related coactivator, SRC-2 (TIF-2), interact with and activate PPARγ and ERα, although SRC-2 appears to be the preferred coactivator for both PPARγ (20) and, at least in osteoblastic cells, for ERα (26). Previous studies by us (27, 28) and others (29) have demonstrated that deletion of SRC-1 in mice is associated with impaired estrogen action in bone and trabecular osteopenia. Because loss of SRC-2 would be predicted to lead to at least partial resistance to both PPARγ and ERα, we examined the skeletal phenotype of SRC-2 KO mice both under basal conditions and after ovariectomy (ovx) and replacement with a physiological dose of estradiol (E2). Given the role of SRC-2 in regulating sensitivity to two major signaling pathways governing bone mass, SRC-2 KO mice, thus, presented a unique opportunity to dissect the relative importance of these pathways for skeletal metabolism.
EXPERIMENTAL PROCEDURES
Generation and Care of Mice
The generation of the SRC-2 KO mice has previously been described (30), and the mice used in this study had been extensively back-crossed (for seven or more generations) into the mouse background strain 129. The animals were housed in a temperature-controlled room (22 ± 2 °C) with a daily light/dark schedule of 12 h. During the experiments the animals had free access to water and were fed a standard laboratory chow (Laboratory Rodent Diet 5001, PMI Feeds, Richmond, VA) containing 0.95% calcium. Pups were genotyped at 4 weeks of age by PCR as described previously (30). For all the experiments (in vivo and in vitro) only female mice were used. The Institutional Animal Care and Use Committee approved all animal procedures.
Bone Densitometry
For both the DXA and pQCT measurements, the mice were anesthetized with Avertin (2,2,2-tribromoethanol, 720 mg/kg, intraperitoneally). For the DXA measurements they were placed on the animal tray in a prone position on the Lunar PIXImus densitometer (software Version 1.44.005, Lunar Corp., Madison, WI). In this position, the head is partially outside the area scanned by the machine. However, in all analyses, the bones of the skull were excluded. Calibration of the machine was performed daily using the hydroxyl apatite phantom provided by the manufacturer. After scanning, total body bone mineral density (BMD) and percent total body fat was determined, and additional regions of interest were identified for more specific analyses. Bone density of the lumbar vertebrae was measured in L1–L3; for the femoral bone density, the femur was analyzed in its full-length. In repeatedly scanned mice (with repositioning between scans), the coefficients of variation for total body, lumbar, and femoral BMD were 4.9, 2.7, and 4.3%, respectively.
For the pQCT measurements the mice were placed in a supine position on the gantry of the Stratec XCT Research SA Plus using software Version 5.40 (Nordland Medical Systems, Inc., Fort Atkinson, WI). As for the PIXImus densitometer, calibration of the machine was performed daily with the hydroxylapatite phantom provided by the manufacturer. The mice were positioned so that the total length of the tibia was visible on the scout view. The scout view speed was set at 15.0 mm/s with a slide distance of 0.5 mm. Once the scout view was completed, the reference line for the CT scans was set at the most proximal point of the tibia. Slice images were set at 1.9 mm (proximal metaphysis of the tibia). The CT speed was set at 3 mm/s, pixel size was 70 μm × 70 μm, and slice thickness was 0.5 mm. After scanning, the CT slices were analyzed using peelmode 2, cortmode 1, and contour mode 1 to evaluate trabecular and cortical parameters. To determine the trabecular bone, the threshold was set at 214 mg/cm3 and, for cortical bone, at 710 mg/cm3. The coefficient of variation was 4.4% for the total tibial volumetric BMD.
Bone Histomorphometry
The femur metaphyses were fixed and embedded without demineralization in a mixture of methylmethacrylate-2-hydroxyethyl and methylacrylate 12.5:1 and subsequently sectioned at a thickness of 5 μm on a Reichert-Jung Supercut 2050 microtome using tungsten-carbide-tipped steel knives. Analysis of bone volume per tissue volume (BV/TV, %), trabecular number (mm−1), trabecular thickness (μm), trabecular separation (μm), osteoblast surface per bone surface (OBs/BS, %), and number of osteoblasts per bone perimeter (mm) as well as adipocyte parameters such as adipocyte volume per tissue volume (%), adipocyte number (#/mm2), and adipocyte circumference (μm), was carried out on Goldner Masson Trichrome-stained sections of the femoral metaphysis, 350 μm below the cranial growth plate covering an area of 2.2 mm2 using a light/epifluorescence microscope connected to a digitizing table and the OsteoMeasure histomorphometry system (OsteoMetrics, Inc., Atlanta, GA). To determine osteoclast numbers per bone perimeter (mm) and osteoclast surface per bone surface (%), osteoclasts were identified by morphology (large multinucleated cells with cytoplasmic vesicles and intimate contact to bone) in the same Goldner Masson Trichrome-stained sections. To assess dynamic histomorphometric indices, mice were given one injection of xylenol orange and one injection of calcein green 8 days apart and killed 2 days later according to a standard double-labeling protocol. Fluorochrome measurements to determine mineralized surface per bone surface (%), mineral apposition rate (μm/day), and bone formation rate (μm3/μm2/d) were made in two nonconsecutive, unstained sections per animal.
Micro-CT Analysis
The quantitative analysis of the metaphyseal cancellous bone of the proximal tibia was done by μCT (μCT20, Scanco Medical AG, Basserdorf, Switzerland). Using two-dimensional data from scanned slices, three-dimensional analysis was conducted to calculate morphometric parameters defining trabecular bone mass and micro-architecture, including BV/TV, trabecular number, trabecular thickness, connectivity-density (1/mm3), and the structure model index (SMI), an indicator of plate-like versus rod-like trabecular architecture.
Ovariectomy and E2 Replacement
For the analysis of the skeletal phenotype of female SRC-2 KO mice compared with WT littermates in response to ovx with and without E2 treatment, we used an E2 dose (2.5 μg/kg/day, based on an average body weight of 25 g) that was able to restore BMD in female WT mice after ovx at different skeletal sites.
3-Month-old female SRC-2 KO and WT littermates had base-line bone mineral density scans by DXA and pQCT and were then divided into three groups (n = 8–12 mice/group). Subsequently, the mice were sham-operated, ovx was performed, and the mice were implanted with either a vehicle pellet or a 2.5-μg/kg/d E2 pellet (Innovative Research of America). After 56 days the mice were scanned again and sacrificed.
In Vitro Culture Experiments
Bone marrow cells from the 4 long bones from female mice were cultured in αMEM with 15% heat-inactivated FBS (Invitrogen) and 1% antibiotic and antimycotic (Invitrogen). Half of the medium was exchanged at day 4, and by day 7 a complete medium change was done to also discard the nonadherent cells. Cells were subcultured in αMEM with 10% heat-inactivated FBS (Invitrogen) and treated with 50 μg of ascorbic acid, 10 nm β-glycerol phosphate, 10−8 m dexamethasone with or without 1 mm rosiglitazone (Cayman Chemical). For the gene expression analysis, cells were treated for 6 days; for the CFU-OB assay, cells were maintained under these culture conditions for 21 days and then stained with the Von Kossa stain. For the Oil Red O stain, the cells were fixed in 5% formaldehyde and stained with a 2:3 dilution of a 0.3% Oil Red O solution in water for 5 min.
Chromatin Immunoprecipitation
Chromatin immunoprecipitation (ChIP) was performed as described by Nelson et al. (31) with the following modification. Magnetic Protein G Dynabeads (Invitrogen) were used instead of the protein A-agarose beads for the isolation of the antibodies and the washing steps. The magnetic separation technology reduces the overall time of the procedure and leads to a reduction in background caused by nonspecific binding. The following antibodies were used in the ChIP assays: PPARγ (H-100), SRC-2 (R91), SRC-1 (M-20), RNA polymerase 11 (N-20, all the above antibodies are from Santa Cruz Biotechnology, Inc.), IgG1 Isotype control (B6901, Sigma-Aldrich). The relative proportions of the coimmunoprecipitated promoter fragments were determined based on the threshold cycle (CT) values by real-time PCR. The samples were run in triplicate, and the median was used for further calculations. Normalization was with each of the corresponding input controls (ΔCT). Those values were raised to the power of 2 to calculate the ΔΔCT. The -fold enrichment was determined by dividing the individual values by the average of the nonspecific IgG ChIP samples. The ChIP data are presented as -fold enrichment between the vehicle and rosiglitazone treatment. The primers that were used for the amplification are listed in Table 1.
TABLE 1.
Gene identification and primer sequences for gene expression and ChIP analysis
PEPCK, phosphoenolpyruvate carboxykinase; CAP, Cbl-associated protein.
| Gene | Accession no. | Forward primer | Reverse primer |
|---|---|---|---|
| Adiponectin | NM_009605 | AAAGGAGAGCCTGGAGAAGC | CGAATGGGTACATTGGGAAC |
| Adipsin | NM_013459 | TGTCAATCATGAACCGGACAA | GGTGACTACCCCGTCATGGT |
| Alkaline phosphatase | NM_007431 | CACAGATTCCCAAAGCACCT | GGGATGGAGGAGAGAAGGTC |
| aP2 | NM_024406 | GAATGTGTTATGAAAGGCGTGAC | AAATTTCCATCCAGGCCTCT |
| BMP-2 | NM_007553 | TGTCCCCAGTGACGAGTTTCT | CCTGTATCTGTTCCCGGAAGAT |
| BMP-4 | NM_007554 | AACATCCCAGGGACCAGTGA | GGATGCTGCTGAGGTTGAAGA |
| BMP-6 | NM_007556 | GGGCTCCGGTTCTTCAGACTA | CTCATGCTTCTTGCAAGCTGTT |
| BSP | NM_008318 | CCAAGAAGGCTGGAGATGCA | TTCCTCGTCGCTTTCCTTCA |
| Col1α1 | NM_007742 | GCTTCACCTACAGCACCCTTGT | TGACTGTCTTGCCCCAAGTTC |
| Osteocalcin | NM_007541 | CCTGAGTCTGACAAAGCCTTCA | GCCGGAGTCTGTTCACTACCTT |
| Osterix | NM_130458 | GGAGGTTTCACTCCATTCCA | TAGAAGGAGCAGGGGACAGA |
| Perilipin | NM_175640 | TGGACCACCTGGAGGAAAAG | TTCGAAGGCGGGTAGAGATG |
| PPARγ | NM_011146 | CCCACCAACTTCGGAATCAG | AATGCGAGTGGTCTTCCATCA |
| Runx2 | NM_009820 | GGCACAGACAGAAGCTTGATGA | GAATGCGCCCTAAATCACTGA |
| TATA-binding protein | NM_013684 | GCCTTACGGCACAGGACTTACT | GCTGTCTTTGTTGCTCTTCCAA |
| ChIP-adiponectin | NM_009605 | TGTTGTTGACTCTCCAGGAC | TAGAGCTTCTGTCAAGCCAT |
| ChIP-aP2 | NM_024406 | CAAGCCATGCGACAAAGGCA | TAGAAGTCGCTCAGGCCACA |
| ChIP-CAP | NM_006434 | GTCAACTTGACACAGGCTAA | TTAGACTTCCACAACGCTGCT |
| ChIP-PEPCK | NM_002591 | GAACTCCGACAAGCAAGCTCTCAGC | CCCAAGTGTCTGGAGAAAGGACG |
Serum Measurements of E2
Serum E2 were measured by radioimmunoassay (Diagnostic Systems Laboratories, Inc.). The interassay variability was less than 5%.
RNA Isolation and Gene Expression Analysis
Total RNA was isolated using Trizol reagent (Invitrogen) in combination with ethanol precipitation. An additional clean up of the RNA and DNase digestion was performed using spin columns (Mini columns, Qiagen), as described by the manufacturer. The RNA quantity and purity was measured with a Nanodrop spectrophotometer, and RNA integrity was determined using the Agilent 2100 Bioanalyzer. Primer pairs for a number of osteoblast and adipocyte related genes were used along with the housekeeping gene, TBP (Table 1). One μg of total RNA was reverse-transcribed (iScript Kit, Bio-Rad). 50 ng cDNA was amplified using the iCyclerQ System with SYBR Green (Bio-Rad). The expression of each gene was normalized to expression of TBP using the difference in cycle thresholds (2−ΔCT).
Statistical Analyses
All data are presented as the mean ± S.E. The in vivo and in vitro comparisons between the WT and SRC-1 KO mice were performed using the Student's t test. For the estrogen study, the primary, prespecified comparison in all cases was between the WT, ovx plus E2 versus the SRC-1 KO, ovx plus E2 mice, as the key question was the skeletal response to E2 in the two groups of mice. Thus, this was analyzed using a t test. For the remainder of the analyses, which did not test our primary hypothesis, we used an analysis of variance followed by the post-hoc Fisher's protected least significant difference test. A p value of <0.05 was considered significant.
RESULTS
Body Composition Parameters and Serum E2 Levels in SRC-2 KO Mice
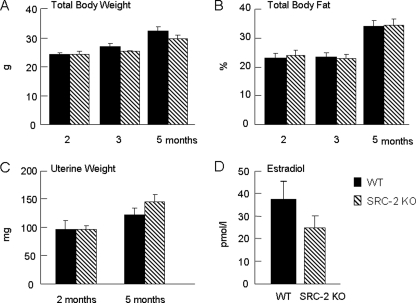
To determine the general effect of SRC-2 deficiency on body composition, we measured body weight and total body fat by DXA at the age of 2, 3, and 5 months in WT and SRC-2 KO mice (Fig. 1, A and B); as is evident, these were very similar between the two groups. Uterine wet weights at 2 and 5 months were also not significantly different between the groups (Fig. 1C). In addition, we measured serum E2 levels and did not detect a compensatory increase in E2 levels in the SRC-2 KO mice, as has previously been shown to occur in SRC-1 KO mice (27) (Fig. 1D).
FIGURE 1.
Total body weight (A) and body fat (B) in WT and SRC-2 KO mice at 2, 3, and 5 months of age; uterine weights (C) in these mice at 2 and 5 months of age; and serum E2 levels at 5 months of age (D). Data are from n = 9–10 mice per group.
SRC-2 KO Mice Have a Marked Increase in Bone Mass
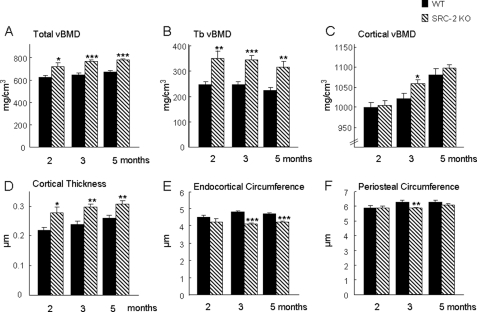
To examine the potential role of SRC-2 in bone, we first performed a longitudinal study over 5 months in WT and SRC-2 KO mice using pQCT scans of the proximal tibial metaphysis. In marked contrast to previous findings with SRC-1 KO mice who had trabecular osteopenia (28), total and trabecular vBMD were significantly greater in SRC-2 KO mice at 2, 3, and 5 months as compared with the WT mice (Fig. 2, A and B). Although cortical vBMD showed a similar trend, this was significantly different between the WT and SRC-2 KO mice only at 3 months (Fig. 2C). However, cortical thickness was significantly greater in SRC-2 KO as compared with WT mice at all three ages (Fig. 2D). This was because of a decrease in endocortical circumference in the SRC-2 KO mice, which was significantly lower in these mice as compared with WT mice at 3 and 5 months (Fig. 2E). As shown in Fig. 2F, the periosteal circumference, which reflects the overall size of the bones, tended to be lower in the SRC-2 KO as compared with WT mice, although this was statistically significant only at the 3-month time point. Areal BMD (aBMD) by DXA was also determined in these mice, and this showed similar trends for greater aBMD in the SRC-2 KO as compared with WT mice at the total body and femur, with differences between the two groups significant at the lumbar spine (Table 2).
FIGURE 2.
Radiological analysis by pQCT of WT and SRC-2 KO mice at the proximal tibial metaphysis at the ages of 2, 3, and 5 months. Total, trabecular, and cortical vBMD (A–C) and cortical thickness (D) were increased in SRC-2 KO mice at all ages as compared with the WT mice. Endocortical and peristeal circumference (E and F) were decreased in SRC-2 KO mice compared with WT mice at the time points noted. The data are from n = 9–10 mice per group. Significant differences from WT: *, p < 0.05; **, p < 0.01; ***, p < 0.001.
TABLE 2.
Areal BMD by DXA in the WT and SRC-2 KO mice
| WT |
SRC-2 KO |
|||||
|---|---|---|---|---|---|---|
| 2 Month | 3 Month | 5 Month | 2 Month | 3 Month | 5 Month | |
| Total body BMD | 51.7 ± 1.6 | 56.0 ± 1.7 | 59.0 ± 1.9 | 53.7 ± 1.4 | 57.0 ± 1.5 | 62.2 ± 1.4 |
| Lumbar spine BMD | 65.6 ± 3.7 | 70.6 ± 3.1 | 69.9 ± 1.9 | 67 ± 2.5 | 72.1 ± 1.5a | 76.9 ± 2.8a |
| Femur BMD | 69.2 ± 2.4 | 76.5 ± 2.7 | 80.4 ± 2.5 | 73.0 ± 2.9 | 78.1 ± 1.7 | 83.4 ± 2.3 |
a p < 0.05 vs. the corresponding time point in the WT mice.
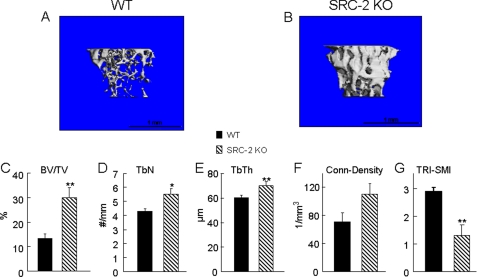
To further define the skeletal phenotype in the SRC-2 KO mice, we also performed μCT analysis at the tibial metaphysis of 5-month-old mice, confirming that SRC-2 KO mice had greater trabecular bone volume than their WT littermates (Fig. 3, A–C). SRC-2 KO mice also had significant increases in trabecular number and thickness as compared with WT mice (Fig. 3, D and E). The connectivity-density (Fig. 3F), which is a measure for the number of trabeculae per unit volume (32), was not significantly different between SRC-2 KO and WT mice, whereas SRC-2 KO mice clearly had more plate-like than rod-like trabeculae in the tibial metaphysis as compared with the WT littermates, as determined by the structure model Index (TRI-SMI, Fig. 3G).
FIGURE 3.
A and B, three-dimensional trabecular bone architecture of the proximal tibial metaphysis at the age of 5 months in WT (A) and SRC-2 KO (B) mice. Data generated from the μCT scans show a significant increase of trabecular bone volume (C, BV/TV), trabecular numbers (D, TbN), and trabecular thickness (E, TbTh) in SRC-2 KO (hatched bars) mice compared with the WT (solid bars) littermates. The connectivity-density (F), which is a measure of the number of trabeculae per unit volume, was similar between SRC-2 KO and WT mice. SRC-2 KO mice had clearly more plate-like than rod-like trabeculae, as determined by the TRI-SMI measure on a scale from 0 to 3, ranging from plate-like to rod-like trabeculae (G). The data are from n = 9–10 mice per group. Significant differences from WT: *, p < 0.05, and **, p < 0.01.
Increase in Osteoblasts and in Bone Formation Rate Leads to Overall Greater Bone Mass in SRC-2 KO Mice
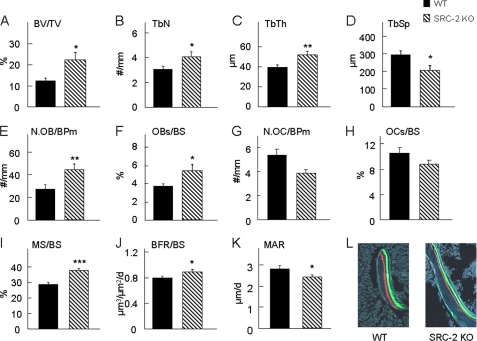
To elucidate the mechanism for the increase in bone mass in SRC-2 KO mice at the cellular level, the femoral metaphyses from 2-month-old mice were used for bone histomorphometric analyses. Bone volume per tissue volume (BV/TV, Fig. 4A), trabecular number (TbN, Fig. 4B), and trabecular thickness (TbTh, Fig. 4C) were all significantly greater in the SRC-2 KO as compared with the WT mice, whereas trabecular separation (TbSp, Fig. 4D) was significantly decreased in SRC-2 KO as compared with WT mice. The observed increase in trabecular BV/TV was associated with a significant increase in osteoblast number per bone perimeter (N.OB/BPm, Fig. 4E) and osteoblast surface per bone surface (OBs/BS, Fig. 4F) in SRC-2 KO as compared with WT mice. There was a non-significant trend for osteoclast number (N.OC/BPm, Fig. 4G) and osteoclast surface per bone surface (OCs/BS, Fig. 4H) to be lower in the SRC-2 KO as compared with the WT mice. In addition, the SRC-2 KO mice had a highly significant increase in the percent mineralizing surface (MS/BS, Fig. 4I) as determined by the length of fluorescent labels on the bone surface. The bone formation rate per bone surface (BFR/BS, Fig. 4J) was also significantly greater in the SRC-2 KO as compared with the WT mice. By contrast, the mineral apposition rate (MAR, Fig. 4K), which reflects the activity of a given team of osteoblasts in the basic multicellular unit, was significantly lower in the SRC-2 KO mice compared with the WT mice. Importantly, because SRC-2 may also mediate effects of 1,25-dihydroxyvitamin D on various tissues (33), as shown in Fig. 4L, there was no evidence for a mineralization defect in the SRC-2 KO mice, with clear, crisp incorporation of the xylenol orange and calcein labels, similar to that seen in the WT mice. Collectively, these histological observations indicate that the increase in bone mass in the SRC-2 KO mice results principally from increased bone formation because of an increase in osteoblast numbers despite somewhat reduced osteoblast activity.
FIGURE 4.
Bone histomorphometric analysis of the distal femoral metaphysis of WT and SRC-2 KO littermates at 2 months of age. There was a significant increase in bone volume (BV/TV; A) and trabecular bone parameters (B–D) in SRC-2 KO mice as compared with WT mice. Osteoblast numbers (N.OB/BPm; E) and surface (OBs/BS; F) were also increased in SRC-2 KO mice, with no significant difference in osteoclast parameters (G and H). N.OC/BPm, osteoclast number; OCs/BS, osteoclast surface/bone surface. Bone formation was significantly increased in SRC-2 KO as compared with WT mice, as reflected in greater mineralizing surface (MS/BS; I) and bone formation rate (BFR/BS; J). However, osteoblast activity, as determined by the mineral apposition rate (MAR), was significantly decreased in SRC-2 KO compared with WT mice (K), but there was clear, crisp incorporation of xylenol orange (red) and calcein (green) labels, demonstrating the absence of a mineralization defect in the SRC-2 KO mice (L). The data are from n = 9–10 mice per group. Significant differences from WT: *, p < 0.05; **, p < 0.01; ***, p < 0.001. TbN, trabecular number; TbTh, trabecular thickness; TbSp, trabecular separation.
Loss of SRC-2 Leads to Reduced Bone Marrow Adipocyte Parameters in Vivo
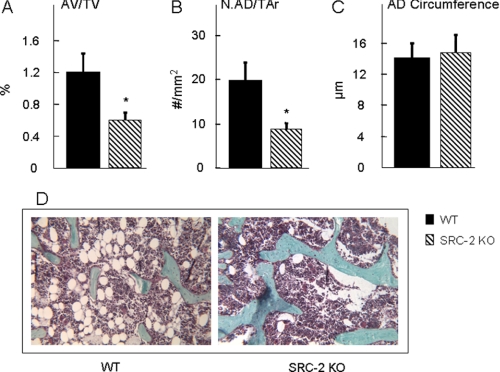
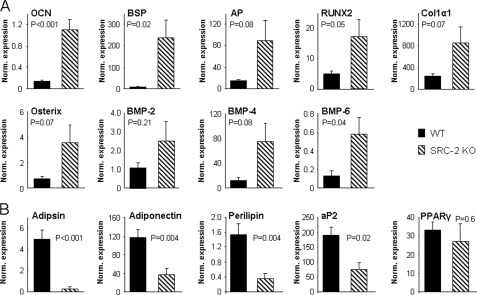
Because of the evidence that bone marrow stromal cells can differentiate into osteoblasts as well as adipocytes (1–3), we also determined adipocyte parameters in the bone marrow cavity of the femurs in the two groups of mice. Adipocyte volume (AV/TV, Fig. 5A) and adipocyte number (Fig. 5B) were significantly decreased in the SRC-2 KO as compared with the WT mice. However, there was no difference in the circumference of individual adipocytes between the SRC-2 KO and WT mice (Fig. 5C). Fig. 5D shows photomicrographs from bones of the WT and SRC-2 KO mice, demonstrating the increase in bone and decrease in adipocytes in the marrow cavities of the SRC-2 KO mice. Consistent with these in vivo findings, gene expression analysis by real-time quantitative PCR of RNA extracted from bone marrow stromal cells cultured for 6 days in osteoblast differentiation medium showed that the expression of osteocalcin and bone sialoprotein was markedly increased along with the expression of other bone-related genes (AP, Runx2, Col1α1, osterix, BMP-2, BMP-4, and BMP-6) in the stromal cells from SRC-2 KO as compared with the WT mice (Fig. 6A). By contrast, expression levels of mRNAs for adipogenic genes (adipsin, adiponectin, perilipin, and aP2) were significantly decreased in the cells from the SRC-2 as compared with the WT mice, with no significant difference in the expression of PPARγ (Fig. 6B).
FIGURE 5.
Bone marrow adipocyte parameters were determined at the distal femoral metaphysis of WT and SRC-2 KO littermates at 2 months of age. Adipocyte volume (AV/TV; A) and adipocyte numbers (N.AD/TAr; B) were significantly decreased in SRC-2 KO as compared with WT mice, whereas the circumference of individual adipocytes (AD, C) was not different between the two groups of mice. Goldner's staining of femoral metaphyses from WT and SRC-2 KO (D) mice shows a dramatic difference in adipocytes in the bone marrow cavity. The data are from n = 9–10 mice per group. Significant differences from WT: *, p < 0.05.
FIGURE 6.
Gene expression data of osteoblast (A) and adipocyte (B) genes from bone marrow stromal cells cultured in αMEM, 10% FBS with ascorbic acid, β-glycerol phosphate, and dexamethasone for 6 days. The data are normalized to the housekeeping gene, TBP (see “Experimental Procedures”), and the normalized expression level for each gene is shown. Bone marrow cells from n = 6 mice per group were used, with p values as indicated. OCN, osteocalcin.
Loss of SRC-2 Leads to Enhanced Osteoblastogenesis and Decreased Adipogenesis in Vitro
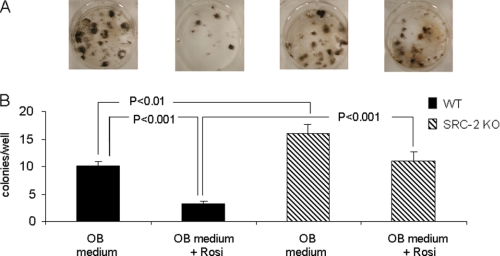
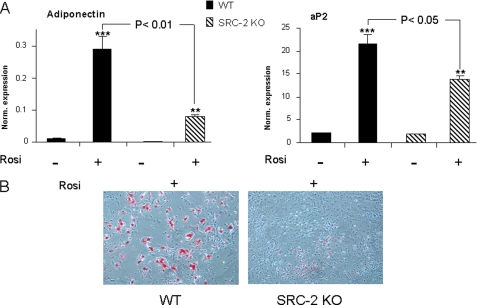
Collectively, these in vivo and in vitro findings demonstrated that unlike SRC-1 KO mice, which have osteopenia (28, 29), mice with deletion of the closely related coactivator, SRC-2, have a high bone mass phenotype with increased bone formation accompanied by reduced adipogenesis. Given the evidence that SRC-2, in addition to being an important coactivator for the ER (26), is also perhaps the preferred coactivator for PPARγ (20), all of the above findings on bone and on marrow adipocytes would be consistent with a phenotype of partial PPARγ resistance. To directly demonstrate this for effects on osteoblastogenesis, we cultured bone marrow stromal cells from WT and SRC-2 KO mice under osteoblastic conditions without or with the PPARγ ligand, rosiglitazone. The capacity of bone marrow stromal cells from WT or SRC-2 KO mice to form osteoblastic colonies in vitro was determined using colony-forming unit assays (CFU-OB, defined as von Kossa positive colonies). As shown in Fig. 7, in the presence of the osteoblastic differentiation medium, there was a significant increase in the formation of CFU-OBs by bone marrow stromal cells obtained from SRC-2 KO as compared with WT mice. Moreover, in the presence of rosiglitazone there was a significant decrease in the formation of CFU-OBs by bone marrow stromal cells from WT mice, and this effect of rosiglitazone was markedly attenuated in bone marrow stromal cells from SRC-2 KO mice; in fact, cells from SRC-2 KO mice formed more than three times as many CFU-OBs as compared with WT mice in the presence of rosiglitazone (Fig. 7B). In further studies, we also placed bone marrow stromal cells from the WT and SRC-2 KO mice under purely adipogenic conditions (αMEM/10% FBS with rosiglitazone) for 48 h and assessed the gene expression levels of adiponectin and aP2 (fatty acid-binding protein 4) as adipocyte marker genes by these cells. As shown in Fig. 8A, expression levels of these genes were significantly increased in bone marrow stromal cells from both WT and SRC-2 KO mice after treatment with rosiglitazone. However, after treatment with rosiglitazone, expression levels of these genes in cells from WT mice were significantly greater as compared with cells from SRC-2 KO mice. In addition, we also assessed adipogenesis in these cells by Oil Red O staining after 6 days of culture in the presence of rosiglitazone. As shown in Fig. 8B, as compared with bone marrow stromal cells from WT mice, cells from SRC-2 KO mice had a markedly reduced capacity to form adipocytes in vitro. These findings, thus, establish that loss of SRC-2 leads to partial PPARγ resistance in bone marrow stromal cells for effects on osteoblastogenesis and adipogenesis.
FIGURE 7.
Osteogenesis of bone marrow stromal cells from WT and SRC-2 KO mice under osteogenic conditions (αMEM, 10% FBS with ascorbic acid, β-glycerol phosphate, and dexamethasone (OB medium)) without or with the addition of the PPARγ agonist, rosiglitazone (Rosi), for 21 days. Osteogenesis was determined by Von Kossa staining (A). Panel B shows the quantitation of the number of CFU-OBs/well. The experiment was performed three times with the bone marrow cells from n = 3 individual mice, with p values as indicated.
FIGURE 8.
Gene expression of adiponectin and aP2 was determined in bone marrow stromal cells from WT and SRC-2 cells in the presence or absence of rosiglitazone (Rosi) for 48 h (A). Cells were isolated from n = 6 mice per group. Adipogenesis in cultures of bone marrow stromal cells from WT and SRC-2 KO littermates were determined by Oil Red O staining (B). Cells were cultured in αMEM, 10% FBS with rosiglitazone for 6 days. Significant differences from WT are as indicated. p < 0.01 (**) and p < 0.001 (***) for significant differences from cells in the absence of rosiglitazone.
SRC-2 Is Important for the Transcriptional Activation of PPARγ Target Genes
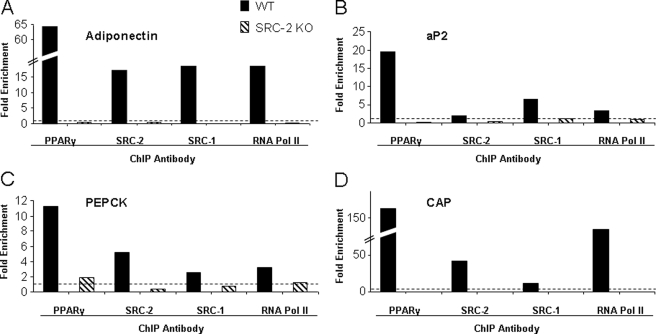
ChIP analysis of 4 PPARγ target genes (adiponectin, aP2, phosphoenolpyruvate carboxykinase, and Cbl-associated protein) was used to establish that SRC-2 is important to form a transcriptional complex at the peroxisome proliferator response element (PPRE) binding sites. Bone marrow stromal cells from WT and SRC-2 KO mice were cultured for 4 days in osteoblastic differentiation media and then treated for 24 h with rosiglitazone. Preliminary data had demonstrated that a short term culture in differentiation media increases the levels of PPARγ in bone marrow stromal cells (data not shown). As shown in Fig. 9A, ChIP assays using an antibody directed against PPARγ resulted in a 64-fold increase in PPARγ recruitment to the adiponectin PPRE in WT mice after treatment with rosiglitazone. In contrast, no recruitment of PPARγ was detected in the bone marrow stromal cells from SRC-2 KO mice. Similarly, ChIP assays specific for SRC-2 and SRC-1 showed a marked increase of the presence of these proteins (17- and 18-fold, respectively) after treatment with rosiglitazone at the adiponectin PPRE in WT but not SRC-2 KO bone marrow stromal cells. To demonstrate that adiponectin is transcriptionally active under these culture conditions, ChIP assays were used to demonstrate an 18-fold enrichment of RNA polymerase II at the adiponectin PPRE from WT but not SRC-2 KO bone marrow stromal cells. Similar patterns of recruitment of PPARγ, SRC1, SRC2, and RNA polymerase II were observed from three other known PPARγ target genes: aP2, phosphoenolpyruvate carboxykinase (PEPCK), and Cbl-associated protein (CAP) (Fig. 9, B–D). Thus, the loss of SRC-2 leads to a destabilization of the transcription complex at the PPREs of a number of PPARγ target genes, resulting in an overall decrease in the expression of adipocyte-related genes and a marked decrease, but not a complete inhibition, in adipocyte development.
FIGURE 9.
ChIP assay analysis of PPARγ target genes. The analysis was done using antibodies directed against PPARγ, SRC-2, SRC-1, and RNA polymerase II. The data are normalized to the inputs and presented as the -fold enrichment between the vehicle and rosiglitazone treatment for 24 h. Nonspecific IgG was used to distinguish between specific and background binding (dotted line). The experiment was performed twice, and a representative experiment is shown. Shown are the ChIP assays using PPREs for adiponectin (A), aP2 (B), phosphoenolpyruvate carboxykinase (PEPCK, C), and Cbl-associated protein (CAP, D).
SRC-2 KO Mice Are Not Protected against Ovx-induced Bone Loss and Have Partial Skeletal Estrogen Resistance
To establish whether, similar to SRC-1 KO mice (28), SRC-2 KO mice had skeletal estrogen resistance, 3-month-old WT and SRC-2 KO female mice were either sham-operated, an ovx was performed and mice were treated with vehicle, or an ovx was performed and mice were treated with slow release E2 pellets for 56 days. However, although we have previously demonstrated that an E2 dose of 10 μg/kg/day represents a physiological E2 dose for bone in C57BL/6 mice, whether this was also the case for the 129 SvJ background was first assessed in a dose-response study in this strain. For this, 3-month-old 129 SvJ mice were either sham-operated, an ovx was performed and mice were treated with vehicle, or an ovx was performed and mice were treated with different doses of E2 (20 and 10 μg/kg/day). These E2 concentrations were chosen from an earlier estrogen replacement study in SRC-1 KO mice on a C57BL/6 background (34). However, in pilot studies these concentrations of E2 resulted in excessive bone formation in WT 129 SvJ mice, with partial filling of the bone marrow cavity with trabecular bone (data not shown). We, thus, repeated the study using lower doses of E2 (2.5 or 5 μg/kg/day). As shown in supplemental Fig. S1, the E2 concentration of 2.5 μg/kg/day resulted in maintenance of BMD at levels similar to the sham-operated mice. It appears, therefore, that the response of bone to E2 is mouse strain-dependent.
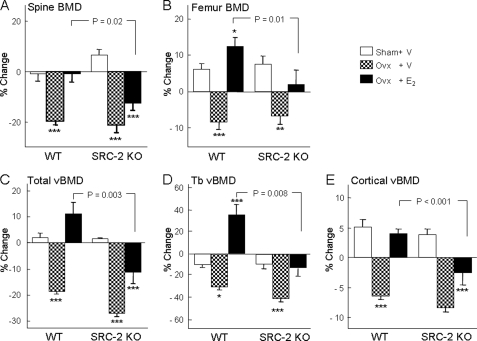
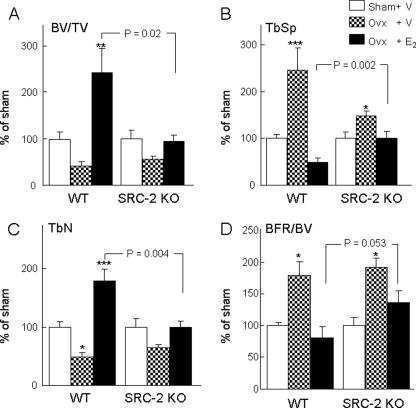
As shown in Fig. 10, WT and SRC-2 KO mice lost a similar percentage of bone after ovx, as assessed by DXA, at both the lumbar spine (Fig. 10A) and femur (Fig. 10B). This was also the case for changes after ovx in vBMD at the proximal tibial metaphysis for total (Fig. 10C), trabecular (Fig. 10D), and cortical (Fig. 10E) vBMD. However, at all sites the identical dose of E2 was significantly less effective at preserving BMD after ovx in the SRC-2 KO as compared with the WT mice (Figs. 10, A–E). These BMD data were confirmed by bone histomorphometry, and as shown in Fig. 11, relative to the respective sham-operated mice, changes in BV/TV (A), trabecular separation (B), and trabecular number (C) in ovx-performed mice treated with E2 were significantly different between WT and SRC-2 KO mice, with a similar pattern observed for bone formation rate/BV (BFR/BV; Fig. 11D). These attenuated (but not absent) responses to E2 in SRC-2 as compared with WT mice, thus, demonstrate that loss of SRC-2 leads to partial skeletal estrogen resistance.
FIGURE 10.
Effects of ovx and E2 replacement on areal BMD by DXA at the lumbar spine (A) and femur (B). Panels C–E show the corresponding changes in total, trabecular (Tb), and cortical vBMD at the proximal tibial metaphysis by pQCT. BMD was measured at the age of 3 months (base line) followed by sham surgery, ovx with vehicle treatment, or ovx with E2 replacement (2.5 μg/kg/day). BMD was measured again 56 days after these interventions, and the percent change from base line for each group is shown. n = 8–12 mice per group. The p values for the main comparison (SRC-2 KO, ovx + E2, versus WT, ovx + E2) are as indicated. p < 0.05 (*), p < 0.01 (**), and p < 0.001 (***) for direct comparison with the respective sham groups.
FIGURE 11.
Bone histomorphometric analysis of bone volume (BV/TV; A), trabecular separation (TbSp; B), trabecular numbers (TbN; C), and the bone formation rate (BFR/BV; D) as determined at the distal femoral metaphysis of WT and SRC-2 KO littermates after sham surgery, ovx with vehicle treatment, or ovx with E2 replacement (2. 5 μg/kg/day). The data in the ovx + vehicle and ovx + E2 groups are expressed normalized to the respective sham groups in order to compare relative changes in these parameters between the WT and SRC-2 KO mice. n = 8–12 mice per group. The p values for the main comparison (SRC-2 KO, ovx + E2, versus WT, ovx + E2) are as indicated. p < 0.05 (*), p < 0.01 (**), and p < 0.001 (***) for direct comparison with the respective sham groups.
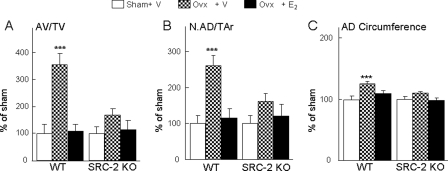
We also determined changes in adipocyte parameters in the mice after ovx and estrogen replacement, and as shown in Fig. 12, relative to the sham animals, there were marked increases in adipocyte volume per tissue volume (AV/TV; Fig. 12A), adipocyte number (AD#) (Fig. 12B), and AD circumference (Fig. 12C) after ovx in the WT mice, which were prevented by estrogen treatment. Interestingly, changes in all three adipocyte parameters after ovx were markedly attenuated in the SRC-2 KO mice. Thus, although SRC-2 KO mice were not protected against bone loss after ovx, changes in bone marrow adipocyte parameters after ovx were markedly reduced in these mice.
FIGURE 12.
Adipocyte volume (AV/TV; A), adipocyte numbers (N.AD/TAr; B) and circumference (AD- circumference; C) were determined at the distal femoral metaphysis of WT and SRC-2 KO littermates following sham surgery, ovx with vehicle treatment, or ovx with E2 replacement (2. 5 μg/kg/day). The data in the ovx + vehicle and ovx + E2 groups are expressed normalized to the respective sham groups to compare relative changes in these parameters between the WT and SRC-2 KO mice. n = 8–12 mice per group. ***, p < 0.001 for direct comparison with the respective sham group.
DISCUSSION
Given the close structural and functional homology between the nuclear receptor coactivators SRC-1 and -2 (35), we anticipated that similar to findings with the SRC-1 KO mice (27–29), SRC-2 KO mice would have skeletal resistance to estrogen action and osteopenia. Using a model of ovariectomy with physiological estrogen replacement, we did demonstrate partial skeletal resistance to estrogen action in the SRC-2 KO mice. However, despite this resistance to estrogen action, female SRC-2 KO mice had a high bone mass phenotype associated with increased indices of bone formation and a marked reduction in bone marrow adipocytes. The skeletal phenotype of SRC-2 KO mice was strikingly similar to that described by Akune et al. (10) for mice with PPARγ haplo-insufficiency. This led us to further establish resistance to PPARγ action in bone marrow stromal cells from SRC-2 KO mice based on the following criteria; 1) as noted above, compared with WT mice, the SRC-2 KO mice had a marked decrease in bone marrow adipocytes; 2) consistent with this, cultured bone marrow stromal cells from SRC-2 KO mice expressed significantly higher levels of osteogenic and lower levels of adipogenic genes as compared with cells from WT mice; 3) cultures of stromal cells from SRC-2 KO mice formed more mineralized nodules in the presence of the PPARγ ligand, rosiglitazone, as compared with cultures from WT mice; 4) using ChIP analysis, we demonstrated that in bone marrow stromal cells, loss of SRC-2 leads to destabilization of the transcription complex at the PPREs of a number of PPARγ target genes. Collectively, our studies, thus, establish that mice with deletion of SRC-2 have partial skeletal resistance to both estrogen and PPARγ but that the consequences of resistance to PPARγ are dominant over estrogen resistance, highlighting the key role played by PPARγ in skeletal metabolism.
Interestingly, compared with WT mice, SRC-2 KO mice had an increase in bone formation rates at the tissue level, driven principally by an increase in osteoblast numbers. However, the mineral apposition rate, which reflects the amount of work done by a team of osteoblasts in each basic multicellular unit, was reduced in the SRC-2 KO as compared with WT mice. These findings may reflect the combined effects of PPARγ and estrogen resistance in the SRC-2 KO mice; resistance to PPARγ action would lead to a suppression of adipogenesis and increase in osteoblastogenesis due perhaps to “switching” of precursor cells to the osteoblast versus the adipocyte lineage, whereas estrogen resistance may result in a decrease in activity of osteoblasts on the bone surface, consistent with the increasing evidence for a role for estrogen in maintaining bone formation at the cellular level (36, 37).
The precise mechanism(s) by which impairments in PPARγ action, as in the PPARγ haplo-insufficient or in the SRC-2 KO mice, lead to increased bone formation are unclear. Because both osteoblasts and adipocytes originate from a common mesenchymal precursor (1–3), impaired PPARγ action could lead to increased flux of these precursors toward the osteoblast lineage. The data in this study support this notion, as loss of SRC-2, the preferred PPARγ coactivator (20), results in increased osteogenesis at the expense of adipogenesis. Our quantitative PCR and ChIP analysis demonstrates that the absence of SRC-2 causes a decrease in adipogenic gene expression and that PPARγ recruitment is eliminated at the known PPRE of these genes. However, because SRC-2 KO cell cultures do not exhibit complete elimination of rosiglitazone-dependent increases in expression of these adipogenic genes, the possibility of other distal PPRE-like elements or PPARγ-independent pathways in regulating adipogenic gene expression and adipogenesis warrants further study.
There is considerable evidence demonstrating a reciprocal relationship between bone volume and adipose volume in the marrow (7, 8). One likely model is that PPARγ activation directly suppresses osteogenesis, because stable transfection of PPARγ and its activation with a TZD suppressed expression of runx2, type I collagen, and osteocalcin in stromal cells (9). Whether PPARγ regulation of osteogenesis is a direct effect of PPARγ or mediated via PPARγ regulation of other pathways, such as TGF-β/Smad3 signaling (38), requires further study. We also found that although SRC-2 KO mice had a marked decrease in bone marrow adipocytes, total body fat (assessed by DXA) was similar in these mice and WT mice. Thus, although SRC-2 KO mice have previously been shown to be relatively resistant to diet-induced obesity (20), under conditions of a normal fat diet they do not have reductions in total body fat but, based on our findings, do have reduced marrow fat.
Deletion of PPARγ only in hematopoietic cells has been shown to result in an increase in bone mass because of impaired osteoclastogenesis and decreased bone resorption (39). By contrast, PPARγ haplo-insufficient mice did not have changes in osteoclast parameters (10). In our study there was a non-significant trend toward a decrease in osteoclast numbers and surface in SRC-2 KO mice, which may have contributed to the increase in bone mass in these mice. However, similar to the PPARγ haplo-insufficient mice (10), the major mechanism for the increase in bone mass in SRC-2 KO mice appears to be an increase in bone formation.
Our demonstration of partial skeletal resistance to PPARγ in the SRC-KO mice suggests that these mice may be protected from adverse skeletal effects of TZDs, and further in vivo studies examining the skeletal effects of TZDs in SRC-KO versus WT mice are needed to address this possibility. In addition, our findings also suggest a potentially novel approach to treating bone loss associated with aging and various other conditions without potentially adverse effects on reproductive tissues. Specifically, the therapeutic focus to date has been on selective modulation of nuclear receptor activity in a tissue-specific manner, such as the use of selective estrogen receptor modulators to treat osteoporosis without increasing the risk of breast or uterine cancer (40). Because coactivators, such as SRC-2, interact with several nuclear receptors, modulating the activity of coactivators may be an alternate therapeutic approach as opposed to directly modulating nuclear receptor activity. Thus, based on our findings, compounds that impair SRC-2 interactions with PPARγ and ER might be expected to increase bone mass while at the same time impair estrogen action not just in bone, as we demonstrate, but also in reproductive tissues such as the breast. This would have the potential beneficial effect of increasing bone mass while not increasing (or even reducing) the risk of breast cancer. Moreover, because previous studies by Picard et al. (20) have found that SRC-2 KO mice are resistant to diet-induced obesity and have an increase in insulin sensitivity, such compounds may also have a favorable metabolic profile. This issue is of particular importance given the increasing evidence for effects of PPARγ agonists, such as TZDs, on decreasing bone formation and increasing rates of bone loss (41) as well as fracture risk (42). Thus, modulation of coactivator activity, in this case that of SRC-2, offers the possibility of altering several (rather than just one) nuclear receptor pathways, thereby having a beneficial impact on multiple disease processes, and our findings provide a plausible rationale for exploring such approaches.
Supplementary Material
Acknowledgments
We thank James Peterson, Arunik Sanyal, and Kelley Hoey for excellent technical support.
This work was supported, in whole or in part, by National Institutes of Health Grants AG004875 and AG028936 (to S. K.) and HD07857 and DK59820 (to B. W. O.).

The on-line version of this article (available at http://www.jbc.org) contains supplemental Fig. S1.
- PPARγ
- peroxisome proliferator-activated receptor γ
- TZD
- thiazolidinedione
- SRC
- steroid receptor coactivators
- ovx
- ovariectomy
- E2
- estradiol
- DXA
- dual x-ray absorptometry
- CT
- computed tomography
- pQCT
- peripheral quantitative CT
- BMD
- bone mineral density
- vBMD
- volumetric BMD
- BV
- bone volume
- TV
- tissue volume
- OBs
- osteoblast surface
- BS
- bone surface
- WT
- wild type
- αMEM
- α-minimal essential medium
- FBS
- fetal bovine serum
- ChIP
- chromatin immunoprecipitation
- KO
- knock out
- PPRE
- peroxisome proliferator response element
- CFU-OB
- colony-forming unit-osteoblast.
REFERENCES
- 1.Bianco P., Riminucci M., Gronthos S., Robey P. G. (2001) Stem Cells 19, 180–192 [DOI] [PubMed] [Google Scholar]
- 2.Pittenger M. F., Mackay A. M., Beck S. C., Jaiswal R. K., Douglas R., Mosca J. D., Moorman M. A., Simonetti D. W., Craig S., Marshak D. R. (1999) Science 284, 143–147 [DOI] [PubMed] [Google Scholar]
- 3.Aubin J. E., Liu F. (1996) in Principles of Bone Biology ( Bilezikian J. P., Raisz L. G., Rodan G. A. eds) pp. 51–67, Academic Press, San Diego, CA [Google Scholar]
- 4.Jilka R. L., Weinstein R. S., Takahashi K., Parfitt A. M., Manolagas S. C. (1996) J. Clin. Invest. 97, 1732–1740 [DOI] [PMC free article] [PubMed] [Google Scholar]
- 5.Bennett J. H., Joyner C. J., Triffitt J. T., Owen M. E. (1991) J. Cell Sci. 99, 131–139 [DOI] [PubMed] [Google Scholar]
- 6.Gori F., Thomas T., Hicok K. C., Spelsberg T. C., Riggs B. L. (1999) J. Bone Miner. Res. 14, 1522–1535 [DOI] [PubMed] [Google Scholar]
- 7.Meunier P., Aaron J., Edouard C., Vignon G. (1971) Clin. Orthop. Relat. Res. 80, 147–154 [DOI] [PubMed] [Google Scholar]
- 8.Dunnill M. S., Anderson J. A., Whitehead R. (1967) J Pathol. Bacteriol. 94, 275–291 [DOI] [PubMed] [Google Scholar]
- 9.Lecka-Czernik B., Gubrij I., Moerman E. J., Kajkenova O., Lipschitz D. A., Manolagas S. C., Jilka R. L. (1999) J. Cell. Biochem. 74, 357–371 [PubMed] [Google Scholar]
- 10.Akune T., Ohba S., Kamekura S., Yamaguchi M., Chung U. I., Kubota N., Terauchi Y., Harada Y., Azuma Y., Nakamura K., Kadowaki T., Kawaguchi H. (2004) J. Clin. Invest. 113, 846–855 [DOI] [PMC free article] [PubMed] [Google Scholar]
- 11.Lehrke M., Lazar M. A. (2005) Cell 123, 993–999 [DOI] [PubMed] [Google Scholar]
- 12.Tontonoz P., Hu E., Spiegelman B. M. (1994) Cell 79, 1147–1156 [DOI] [PubMed] [Google Scholar]
- 13.Forman B. M., Tontonoz P., Chen J., Brun R. P., Spiegelman B. M., Evans R. M. (1995) Cell 83, 803–812 [DOI] [PubMed] [Google Scholar]
- 14.Kliewer S. A., Sundseth S. S., Jones S. A., Brown P. J., Wisely G. B., Koble C. S., Devchand P., Wahli W., Willson T. M., Lenhard J. M., Lehmann J. M. (1997) Proc. Natl. Acad. Sci. U.S.A. 94, 4318–4323 [DOI] [PMC free article] [PubMed] [Google Scholar]
- 15.Nagy L., Tontonoz P., Alvarez J. G., Chen H., Evans R. M. (1998) Cell 93, 229–240 [DOI] [PubMed] [Google Scholar]
- 16.Gimble J. M., Robinson C. E., Wu X., Kelly K. A., Rodriguez B. R., Kliewer S. A., Lehmann J. M., Morris D. C. (1996) Mol. Pharmacol. 50, 1087–1094 [PubMed] [Google Scholar]
- 17.Rosen C. J., Bouxsein M. L. (2006) Nat. Clin. Pract. Rheumatol. 2, 35–43 [DOI] [PubMed] [Google Scholar]
- 18.Syed F. A., Oursler M. J., Hefferanm T. E., Peterson J. M., Riggs B. L., Khosla S. (2008) Osteoporos. Int. 19, 1323–1330 [DOI] [PMC free article] [PubMed] [Google Scholar]
- 19.Yki-Järvinen H. (2004) N. Engl. J. Med. 351, 1106–1118 [DOI] [PubMed] [Google Scholar]
- 20.Picard F., Géhin M., Annicotte J., Rocchi S., Champy M. F., O'Malley B. W., Chambon P., Auwerx J. (2002) Cell 111, 931–941 [DOI] [PubMed] [Google Scholar]
- 21.Feige J. N., Auwerx J. (2007) Trends Cell Biol. 17, 292–301 [DOI] [PubMed] [Google Scholar]
- 22.Smith C. L., O'Malley B. W. (2004) Endocr. Rev. 25, 45–71 [DOI] [PubMed] [Google Scholar]
- 23.Xu J., Qiu Y., DeMayo F. J., Tsai S. Y., Tsai M. J., O'Malley B. W. (1998) Science 279, 1922–1925 [DOI] [PubMed] [Google Scholar]
- 24.Xu J., O'Malley B. W. (2002) Rev. Endocr. Metab. Disord. 3, 185–192 [DOI] [PubMed] [Google Scholar]
- 25.Shang Y., Brown M. (2002) Science 295, 2465–2468 [DOI] [PubMed] [Google Scholar]
- 26.Monroe D. G., Johnsen S. A., Subramaniam M., Getz B. J., Khosla S., Riggs B. L., Spelsberg T. C. (2003) J. Endocrinol. 176, 349–357 [DOI] [PubMed] [Google Scholar]
- 27.Mödder U. I., Sanyal A., Kearns A. E., Sibonga J. D., Nishihara E., Xu J., O'Malley B. W., Ritman E. L., Riggs B. L., Spelsberg T. C., Khosla S. (2004) Endocrinology 145, 913–921 [DOI] [PubMed] [Google Scholar]
- 28.Mödder U. I., Sanyal A., Xu J., O'Malley B. W., Spelsberg T. C., Khosla S. (2008) Bone 42, 414–421 [DOI] [PMC free article] [PubMed] [Google Scholar]
- 29.Yamada T., Kawano H., Sekine K., Matsumoto T., Fukuda T., Azuma Y., Itaka K., Chung U. I., Chambon P., Nakamura K., Kato S., Kawaguchi H. (2004) J. Bone Miner. Res. 19, 1452–1461 [DOI] [PubMed] [Google Scholar]
- 30.Gehin M., Mark M., Dennefeld C., Dierich A., Gronemeyer H., Chambon P. (2002) Mol. Cell. Biol. 22, 5923–5937 [DOI] [PMC free article] [PubMed] [Google Scholar]
- 31.Nelson J. D., Denisenko O., Bomsztyk K. (2006) Nat. Protoc. 1, 179–185 [DOI] [PubMed] [Google Scholar]
- 32.Odgaard A., Gundersen H. J. (1993) Bone 14, 173–182 [DOI] [PubMed] [Google Scholar]
- 33.Oda Y., Sihlbom C., Chalkley R. J., Huang L., Rachez C., Chang C. P., Burlingame A. L., Freedman L. P., Bikle D. D. (2003) Mol. Endocrinol. 17, 2329–2339 [DOI] [PubMed] [Google Scholar]
- 34.Modder U. I., Riggs B. L., Spelsberg T. C., Fraser D. G., Atkinson E. J., Arnold R., Khosla S. (2004) Eur. J. Endocrinol. 151, 503–510 [DOI] [PubMed] [Google Scholar]
- 35.Lonard D. M., Lanz R. B., O'Malley B. W. (2007) Endocr. Rev. 28, 575–587 [DOI] [PubMed] [Google Scholar]
- 36.Riggs B. L., Khosla S., Melton L. J., 3rd (2002) Endocr. Rev. 23, 279–302 [DOI] [PubMed] [Google Scholar]
- 37.Khastgir G., Studd J., Holland N., Alaghband-Zadeh J., Fox S., Chow J. (2001) J. Clin. Endocrinol. Metab. 86, 289–295 [DOI] [PubMed] [Google Scholar]
- 38.Fu M., Zhang J., Zhu X., Myles D. E., Willson T. M., Liu X., Chen Y. E. (2001) J. Biol. Chem. 276, 45888–45894 [DOI] [PubMed] [Google Scholar]
- 39.Wan Y., Chong L. W., Evans R. M. (2007) Nat. Med. 13, 1496–1503 [DOI] [PubMed] [Google Scholar]
- 40.Riggs B. L., Hartmann L. C. (2003) N. Engl. J. Med. 348, 618–629 [DOI] [PubMed] [Google Scholar]
- 41.Grey A., Bolland M., Gamble G., Wattie D., Horne A., Davidson J., Reid I. R. (2007) J. Clin. Endocrinol. Metab. 92, 1305–1310 [DOI] [PubMed] [Google Scholar]
- 42.Meier C., Kraenzlin M. E., Bodmer M., Jick S. S., Jick H., Meier C. R. (2008) Arch. Intern. Med. 168, 820–825 [DOI] [PubMed] [Google Scholar]
Associated Data
This section collects any data citations, data availability statements, or supplementary materials included in this article.


