Abstract
PPARδ (peroxisome proliferator-activated receptor δ) is a regulator of lipid metabolism and has been shown to induce fatty acid oxidation (FAO). PPARδ transgenic and knock-out mice indicate an involvement of PPARδ in regulating mitochondrial biogenesis and oxidative capacity; however, the precise mechanisms by which PPARδ regulates these pathways in skeletal muscle remain unclear. In this study, we determined the effect of selective PPARδ agonism with the synthetic ligand, GW501516, on FAO and mitochondrial gene expression in vitro and in vivo. Our results show that activation of PPARδ by GW501516 led to a robust increase in mRNA levels of key lipid metabolism genes. Mitochondrial gene expression and function were not induced under the same conditions. Additionally, the activation of Pdk4 transcription by PPARδ was coactivated by PGC-1α. PGC-1α, but not PGC-1β, was essential for full activation of Cpt-1b and Pdk4 gene expression via PPARδ agonism. Furthermore, the induction of FAO by PPARδ agonism was completely abolished in the absence of both PGC-1α and PGC-1β. Conversely, PGC-1α-driven FAO was independent of PPARδ. Neither GW501516 treatment nor knockdown of PPARδ affects PGC-1α-induced mitochondrial gene expression in primary myotubes. These results demonstrate that pharmacological activation of PPARδ induces FAO via PGC-1α. However, PPARδ agonism does not induce mitochondrial gene expression and function. PGC-1α-induced FAO and mitochondrial biogenesis appear to be independent of PPARδ.
The peroxisome proliferator-activated receptors (PPARs)2 are ligand-modulated transcription factors that form heterodimers with retinoid X receptors (1). Certain PPARs regulate transcription in response to fatty acids and are potential therapeutic targets for metabolic disorders (1). Three PPAR family members have been identified. PPARα is primarily expressed in the liver but also in heart, kidney, and brown fat, where it regulates fatty acid catabolism. PPARγ is highly expressed in adipose tissue and is a key regulator of adipogenesis and insulin sensitivity. The expression of PPARδ is more ubiquitous, with relatively high levels in metabolically active tissues, such as muscle, liver, and adipose tissue (2). Selective activation of PPARδ by agonists has been shown to improve glucose metabolism and insulin sensitivity in mouse models of obesity and insulin resistance. These effects are mainly attributed to the agonists' capacity to activate fatty acid transport and oxidation (1). In addition, recent reports suggest that activation of PPARδ increases mitochondrial gene expression and function. The strongest evidence stems from the muscle-specific VP16-PPARδ transgenic mice, in which a constitutively active fusion protein is overexpressed specifically in the muscle using the skeletal α-actin promoter (3). These mice exhibit enhanced mitochondrial gene expression in association with a fiber type switch from fast glycolytic type II fibers to slow oxidative type I fibers. Type I fibers utilize fatty acids as their main fuel and are more fatigue resistant. Concordantly, PPARδ transgenic mice display enhanced exercise endurance when compared with the wild-type mice. However, these studies were done with a PPARδ fusion protein, so it is not yet clear to what extent those results represent the physiological function of the native PPARδ protein.
A mouse model overexpressing the native PPARδ in muscle was also reported (4). These mice exhibit a much milder phenotype with respect to mitochondrial oxidative capacity when compared with the VP16-PPARδ mice. Nevertheless, overexpression of the native PPARδ increased the percentage of oxidative fibers that are succinate dehydrogenase-positive in tibialis anterior muscle, correlating with an increase in citrate synthase (CS) and β-hydroxy-CoA dehydrogenase activities.
PGC-1α (PPARγ coactivator-1α) and PGC-1β are important physiological transcriptional regulators of oxidative metabolism and mitochondrial biogenesis. PGC-1α is induced in a tissue-specific manner under conditions such as cold, fasting, and exercise. It promotes mitochondrial biogenesis, oxidative capacity, and FAO by increasing the expression and activation of various transcription factors, including mitochondrial transcription factor A, nuclear respiration factor 1 and 2, PPARs, and ERRα (estrogen-related receptor α) (5, 6). The PGC-1α knock-out (KO) mice display reduced mitochondrial function and oxidative capacity (7), whereas overexpression of PGC-1α increases both (8). Interestingly, PGC-1α expression was not increased in muscle from either the VP16-PPARδ transgenic mice or the native PPARδ transgenic mice, leading to the assumption that PPARδ might act downstream or independent of PGC-1α (3, 4).
Recently, Schuler et al. (9) reported that the muscle-specific PPARδ KO mice have reduced oxidative capacity and mitochondrial gene expression in muscle. In contrast to the findings in the PPARδ transgenic mouse models, the expression levels of PGC-1α and mitochondrial transcription factor A were reduced in the PPARδ KO muscles. Thus, the authors suggested that PPARδ acts upstream of PGC-1α and induces PGC-1α expression in muscle.
Genetic mouse models are very useful but have their limitations with respect to the prediction of pharmacological effects. Although activation of PPARδ by agonists, such as GW501516, has been shown to improve glucose tolerance and insulin resistance, the impact on mitochondrial biogenesis and function is not well characterized (3, 16). In addition, the underlying molecular mechanisms of PPARδ activation on lipid metabolism and mitochondrial oxidative capacity are not fully understood based on the phenotyping results obtained from the PPARδ transgenic and KO mouse models (3, 9). Given the mitochondrial phenotypes of the PPARδ mouse models, it is tempting to speculate that pharmacological activation of PPARδ exerts beneficial effects on obesity and insulin resistance in a way that mimics what is happening during physical exercise. We therefore investigated first whether pharmacological activation of the endogenous PPARδ induces mitochondrial biogenesis and enhances mitochondrial function in muscle. Second, we used genetic tools to investigate the mechanisms of PPARδ in regulating energy metabolism, specifically the interdependence of PPARδ and PGC-1 transcriptional coactivators in the regulation of FAO and mitochondrial gene expression and function.
EXPERIMENTAL PROCEDURES
Primary Mouse Myoblast Isolation and Differentiation
Primary muscle cells were isolated from 2–3-week-old FVB mice and the PGC-1α wild-type and knock-out mice (7), as described (10). Myoblasts were grown and differentiated as described previously (11). Differentiated myotubes were treated with DMSO or 100 nm GW501516 for 24 h prior to being harvested or subjected to any analyses.
For differentiation of C2C12 myoblasts, cells were grown to confluence, at which point the medium was changed to differentiation medium (Dulbecco's modified Eagle's medium, 2% horse serum). Cells were transduced with the indicated adenovirus and harvested at 72 h postinfection. Cells were treated with DMSO or 100 nm GW501516 for the last 24 h.
Adenoviral Transduction
Adenoviruses expressing two mouse PPARδ shRNAs with the sequences, GGAGCATCCTCACCGGCAA and GCAGCTGGTCACTGAGCAT, were generated by Welgen (Worcester, MA). In the PPARδ knockdown experiments, these two viruses were used at a 1:1 ratio. The adenoviruses expressing PGC-1β shRNA, PGC-1α, and GFP were described previously (12, 13). Primary muscle cells were transduced at day 2 or 3 postdifferentiation with various adenoviruses as indicated to either overexpress or knock down the gene(s) of interest. The concentrations of adenoviruses used for a single viral transduction were as follows: PPARδ shRNA, 1 × 10⁹ particles/ml; PGC-1β shRNA, 0.45 × 10⁹ particles/ml. The control adenovirus was used in the same concentration as the virus of interest. For double viral transduction, the concentrations used were as follows: PGC-1α, 0.3 × 10⁹ particles/ml; GFP, 0.3 × 10⁹ particles/ml; PPARδ shRNA, 0.8 × 10⁹ particles/ml; PGC-1β shRNA, 0.225 × 10⁹ particles/ml. For knockdown of PPARδ and overexpression of PGC-1α, the cells were first transduced with PPARδ shRNA adenovirus and subsequently with PGC-1α adenovirus on the following day. The medium was changed daily.
RNA Extraction and Real Time PCR Analysis of Gene Expression
Total RNA was extracted from tissues and cells using TRIzol (Invitrogen) and subjected to TaqMan analysis, as described previously (11). The relative mRNA expression levels were calculated by comparing the target genes with 18 S rRNA and were expressed as means ± S.E. of the -fold change relative to the control, which was set at 1. The TaqMan primer/probe sets for all of the genes examined were obtained from Applied Biosystems (Foster City, CA).
Western Blotting
Fifty micrograms of nuclear extract or whole cell lysate was used for Western blot analysis. Proteins of interest were detected with specific antibodies: anti-cytochrome c clone 7H8.2C12 (Abcam) at 1:200 dilution and anti-UCP3 (Affinity Bioreagent), anti-PDK4 clone RB3041 (Agent), anti-complex IV and I subunits (MitoScience), anti-tubulin (Abcam), and anti-PGC-1α (Chemicon) at 1:1000 dilution. The secondary antibody, horseradish peroxidase-conjugated goat anti-rabbit IgG, was obtained from Pierce and used at 1:10,000 dilution. The immunoblot was developed by using enhanced chemiluminescence with the Super Signal West Dura Chemiluminescence kit from Pierce.
Measurement of Citrate Synthase Activity
CS activity was determined in cell lysates as described previously (14). Each sample was assayed in triplicate. CS activity was normalized for protein concentration and expressed as means ± S.E.
Fatty Acid Oxidation Measurements
The fatty acid oxidation assay was performed as described (15).
Pdk4 Reporter Gene Assay
HeLa cells were cultured in Dulbecco's modified Eagle's medium supplemented with 10% fetal bovine serum in 5% CO2. Cells (7 × 10⁴) were plated in a 96-well plate and transfected the next day with the Pdk4 reporter (24) and the Renilla control plasmid along with various expression vectors, as indicated. One day after transfection, cells were treated with 100 nm GW501516 or DMSO for 24 h. Luciferase activities were measured at 48 h post-transfection, as described previously (11).
Animal Studies
All mice used in this study were purchased from the Jackson Laboratories (Bar Harbor, ME) and group-housed (n = 4/cage) in a temperature- and humidity-controlled facility with a 12-h light/dark cycle and free access to water and regular mouse chow. Obese (ob/ob) 9-week-old male mice were randomly divided into three treatment groups (vehicle control (0.5% carboxymethylcellulose, 2% Tween 80) and GW501516 (3, 10, and 30 mg/kg)) and treated once daily via oral gavage for a total of 3 weeks. After 19 days of treatment and after a 4-h fast, blood samplings (50–100 μl) were obtained via retro-orbital bleed. Plasma concentrations of glucose, triglycerides, and nonesterified free fatty acids were determined using a clinical autoanalyzer (model AU4000; Olympus, Melville, NY). Plasma insulin was determined using a kit from Meso Scale Discovery (Gaithersburg, MD). An oral glucose tolerance test was performed on day 21 after the mice were fasted for 4 h. On day 22 and ∼4 h after receiving the last dose, mice were sacrificed, and muscle tissues were collected and snap-frozen in liquid nitrogen for gene expression analysis.
The lean C57BL/6 male mice were randomly divided into two treatment groups (vehicle control and GW501516 (30 mg/kg)) and treated once daily via oral gavage for a total of 4 weeks. After 4 weeks and approximately 6 h after receiving the last dose, mice were sacrificed, and muscle tissues were collected and snap-frozen in liquid nitrogen for gene expression and protein analysis.
RESULTS
PPARδ Agonism Induces FAO but Not Mitochondrial Gene Expression in Primary Mouse Myotubes
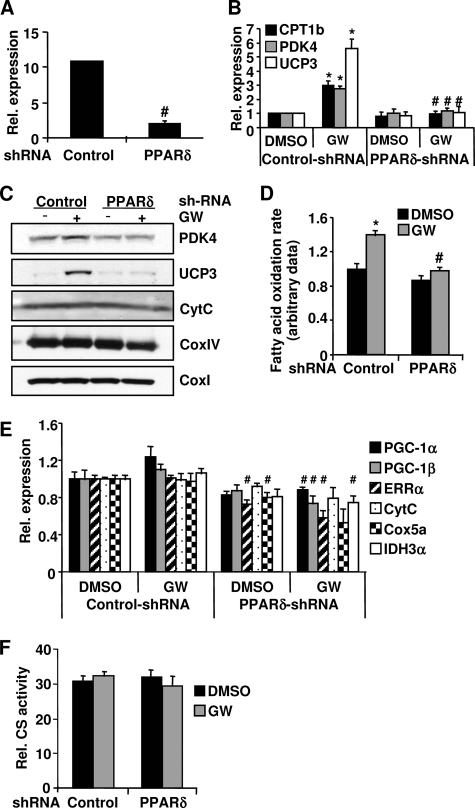
We used the PPARδ agonist GW501516 to activate the endogenous PPARδ protein in primary mouse myotubes. To ensure that effects are PPARδ-dependent, we first established experimental conditions in which GW501516-induced effects could only be observed in the presence of PPARδ in the muscle cells. To accomplish this, adenovirus-mediated knockdown of PPARδ was performed in primary muscle cells using two shRNAs designed specifically against PPARδ. The mRNA level of PPARδ was reduced 80% in the cells transduced with the adenoviral PPARδ shRNAs (Fig. 1A). GW501516 treatment resulted in a robust activation of several PPARδ target genes involved in the FAO pathway and uncoupling, such as CPT1b (carnitine palmitoyltransferase 1b), which catalyzes the esterification of acyl-CoA to form acyl-carnitine, the rate-limiting step of mitochondrial FAO; PDK4 (pyruvate dehydrogenase kinase 4), which plays an important role in switching the fuel source from glucose to fatty acids by inactivating pyruvate dehydrogenase; and UCP3 (uncoupling protein 3), which induces FAO in vivo and in vitro. The induction of the mRNA expression of these genes was completely abolished when PPARδ expression was knocked down (Fig. 1B). Consistent with the mRNA expression, the protein levels of PDK4 and UCP3 were also increased with GW501516 treatment, and this induction was blocked following knockdown of PPARδ (Fig. 1C). Correlating with the induction of gene expression in the FAO pathway, GW501516 treatment increased palmitate oxidation rates, which were completely prevented with the knockdown of PPARδ (Fig. 1D). These results demonstrate that the GW501516-induced effects on gene expression and FAO rate are PPARδ-dependent. Thus, we used these experimental conditions for all of the subsequent experiments described in this study.
FIGURE 1.
GW501516-induced effects on FAO and mitochondrial gene expression in primary myotubes. Primary myotubes were infected with PPARδ shRNAs or a control shRNA adenovirus. At 48 h post-transduction, the cells were treated with 100 nm GW501516 (23) or DMSO for 24 h. Total RNA was extracted from cells, and the mRNA levels of the indicated genes were determined by quantitative PCR (A, B, and E). D, cells were labeled with 14C-palmitate, and FAO rates were determined. The FAO rate in the control cells treated with DMSO was set at 1, and the FAO rates under other conditions were expressed as -fold change relative to that in the control cells treated with DMSO. C, cells were lysed in RIPA buffer, and protein lysate from each sample was used for Western blotting. F, cells were lysed, and CS activities were determined. Data are mean ± S.E. (n = 3). *, p ≤ 0.05 for DMSO versus GW; #, p ≤ 0.05 for control versus PPARδ shRNA. CytC, cytochrome c.
We next examined whether activation of PPARδ could promote mitochondrial gene expression, as it has been reported in the muscle-specific VP16-PPARδ transgenic mice but not in the transgenic mice overexpressing the native PPARδ protein (3). As shown in Fig. 1E, the mRNA levels of the key mitochondrial transcription regulators, PGC-1α, PGC-1β, and ERRα, were not increased by GW501516 treatment. Furthermore, there was no increase observed in the mRNA or protein levels of several mitochondrial proteins, components of the electron transport chain (ETC), and the citric acid cycle (tricarboxylic acid cycle), including cytochrome c, cytochrome c oxidase subunits I, IV, and Va (CoxI, CoxIV, and Cox5a), and isocitrate dehydrogenase 3, α subunit (IDH3α) (Fig. 1, C and E). GW501516 treatment also did not increase CS activity, indicative of mitochondrial function (Fig. 1F). Interestingly, knockdown of PPARδ slightly but significantly reduced the mRNA levels of ERRα and Cox5a (Fig. 1E). However, knockdown of PPARδ did not alter the protein levels of cytochrome c, CoxI, and CoxIV as well as CS activity (Fig. 1, C and F). These results indicate that PPARδ agonism increases the gene expression and rate of FAO; however, it does not increase mitochondrial gene expression and function in primary muscle cells.
GW501516 Treatment Improves Glucose Homeostasis and Induces Lipid Metabolism but Not Mitochondrial Gene Expression in Vivo
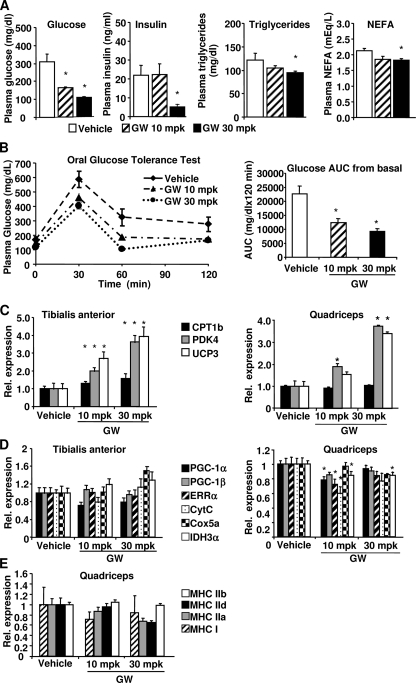
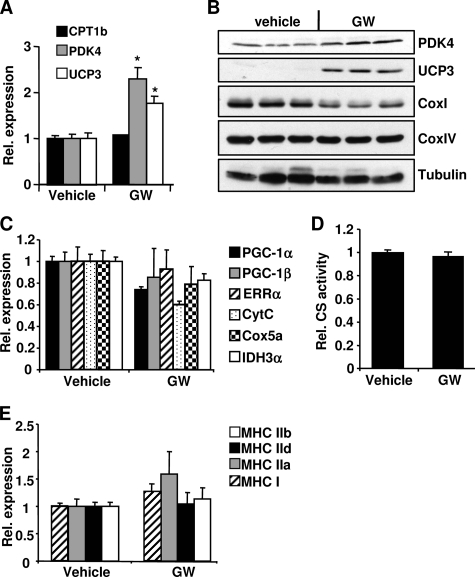
It was previously reported that GW501516 increased mitochondrial number and expression of some mitochondrial genes in vivo (3, 16). However, we did not observe increased mitochondrial gene expression and CS activity in the GW501516-treated muscle cells in vitro (Fig. 1, C, E, and F). It is possible that additional factors required for GW501516 to exert its effect on mitochondrial biogenesis are missing in the in vitro experimental system (i.e. primary muscle cells). To rule out this possibility, we investigated the effect of GW501516 on mitochondrial gene expression in the genetically obese and insulin resistant ob/ob mice. The mice were gavaged daily with 10 or 30 mg/kg GW501516 or vehicle. At day 19, blood samples were taken from the mice after 4 h of fasting. Plasma glucose, insulin, triglycerides, and nonesterified fatty acids were measured and shown in Fig. 2A. GW501516 treatment significantly and dose-dependently reduced fasting plasma glucose in the mice. Insulin, triglycerides, and nonesterified free fatty acids were reduced at 30 mg/kg. To further investigate the effect of GW501516 on glucose homeostasis in these mice, an oral glucose tolerance test was performed at day 21 after 4 h of fasting. Glucose tolerance was significantly improved by GW501516 treatment in a dose-dependent manner with 45 and 59% reduction of glucose area under the curve (AUC) from the basal level at 10 and 30 mg/kg, respectively (Fig. 2B). These results demonstrate that GW501516 at both doses efficaciously improved glucose homeostasis in vivo. To determine whether GW501516 treatment has an effect on muscle PPARδ target genes and mitochondrial gene expression in these mice, the mRNA levels of CPT1b, PDK4, and UCP3 were measured in both tibialis anterior and quadriceps muscles. Consistent with results from the primary mouse myotubes (Fig. 1B), mRNA levels of these genes were significantly increased in both muscles in a dose-dependent manner with the GW501516 treatment (Fig. 2C). In contrast, the mRNA levels of PGC-1α, PGC-1β, cytochrome c, Cox5a, and IDH3α were not increased in either of the muscles (Fig. 2D). VP16-PPARδ mice exhibited a fiber type switch from glycolytic to more oxidative fibers concurrent with the up-regulation of mitochondrial genes. To determine whether there was any fiber type conversion induced by the GW501516 treatment, the mRNA expression levels of several myosin heavy chain (MHC) isoforms (MHCI, -IIa, -IId/x, and -IIb) were measured in the muscles from the mice treated with either vehicle or 10 or 30 mg/kg GW501516 for 3 weeks. MHCI is preferentially expressed in the slow twitch oxidative type I fiber, whereas MHCIIa, -IId/x, and -IIb are preferentially expressed in the fast twitch type II fibers, with the former being more oxidative and latter being more glycolytic. As shown in Fig. 2E, the expression of these MHC isoforms was not altered by the GW501516 treatment at either 10 or 30 mg/kg, indicating that there was no fiber type switch in these mice. Chronic administration of GW501516 at 10 mg/kg was reported to cause hepatomegaly in mice previously (16). In our study, we did not observe hepatomegaly in the ob/ob mice when they were dosed with 10 and 30 mg/kg GW501516 for 3 weeks. Nevertheless, we carried out another study where the ob/ob mice were dosed with 3 mg/kg for 3 weeks. The fasted blood glucose was significantly lower in the GW501516-treated mice compared with the control (supplemental Fig. 1). The expression levels of Pdk4 and Ucp3 in muscle were significantly increased by the treatment, but there was no change in the expression of Pgc-1α, Errα, and the mitochondrial genes, cytochrome c, Idh3a, and Cox5a (supplemental Fig. 1), which is similar to the results in Fig. 2. We also investigated the effect of GW501516 on lipid metabolism and mitochondrial oxidative capacity in the lean mice. Both the mRNA and protein levels of PKD4 and UCP3 were significantly increased by the GW501516 treatment in the gastrocnemius muscle in the lean mice (Fig. 3, A and B). However, the mRNA expression of PGC-1α, PGC-1β, ERRα, cytochrome c, IDH3α, and Cox5a was not increased by the GW501516 treatment (Fig. 3C). The protein levels of CoxI and CoxIV were also not increased by GW501516 (Fig. 3B). CS activity was not altered in gastrocnemius cell lysates from the GW501516-treated mice (Fig. 3D). The mRNA expression of MHCI, -IIa, -IId/x, and -IIb was not altered by the GW501516 treatment, indicating that there was no fiber type conversion (Fig. 3E). These results are similar to the findings in the ob/ob mice (Fig. 2). Taken together, pharmacological activation of PPARδ with GW501516 improved glucose homeostasis and increased the expression of PKD4, CPT-1b, and UCP3. However, it did not promote mitochondrial gene expression in skeletal muscle in vivo.
FIGURE 2.
GW501516-induced effects on glucose homeostasis and muscle mitochondrial gene expression in ob/ob mice. ob/ob mice were treated once daily with 10 or 30 mg/kg (mpk) GW501516 for 3 weeks. A, plasma glucose, insulin, and nonesterified free fatty acids were measured at day 19 post-treatment after 4 h fast (n = 8). B, oral glucose tolerance test and glucose area under the curve (AUC) from basal versus vehicle. n = 8. *, p ≤ 0.05. C–E, tibilias anterior and quadriceps were isolated, RNA was extracted, and quantitative PCR was performed to determine the mRNA levels of the indicated genes. Data are mean ± S.E. (n = 7–8). *, p ≤ 0.05 for vehicle versus GW501516. CytC, cytochrome c.
FIGURE 3.
GW501516-induced effects on muscle mitochondrial gene expression in lean C57BL/6 mice. Mice were gavaged once daily with 30 mg/kg GW501516 for 4 weeks. Gastrocnemius was isolated, RNA was extracted, and Q-PCR was performed to determine the mRNA levels of the indicated genes (A, C, and E). B, protein was extracted from gastrocnemius muscle isolated from mice. Protein lysate from each sample was used for Western blotting. D, citrate synthase activity was determined in the protein lysate from gastrocnemius muscles. Data are mean ± S.E. (n = 7–8). *, p ≤ 0.05 for vehicle versus GW. CytC, cytochrome c.
Loss of PGC-1α Reduces PPARδ-driven FAO
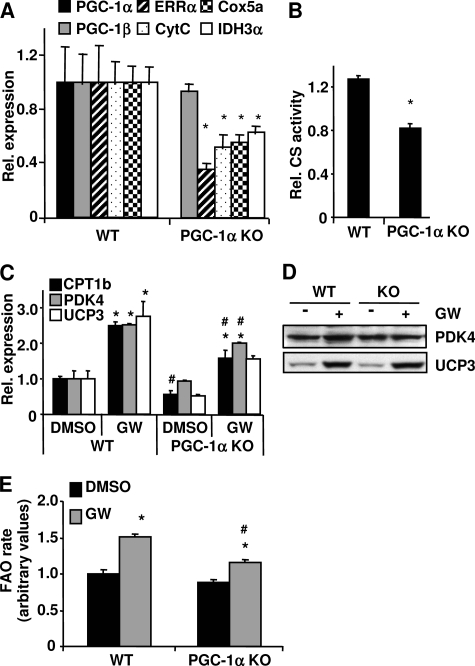
PGC-1α functions as a transcriptional regulator in a number of metabolic pathways by interacting and/or modulating the activity of various transcription factors and nuclear hormone receptors (5). To determine whether PGC-1α plays a role in PPARδ-mediated FAO, primary myoblasts were isolated from PGC-1α wild-type (WT) (17) and knock-out (KO) mice and differentiated into myotubes (7). As expected, in the KO cells, PGC-1α mRNA was not detected, and the expression levels of Errα, cytochrome c, Cox5a, and Idh3α were reduced 30–60% (Fig. 4A) concurrent with a reduction of CS activity (Fig. 4B), indicating an impairment of mitochondrial function in the PGC-1α null cells. To compare the effect of GW501516 on the expression of the PPARδ target genes, both PGC-1α WT and KO cells were treated with either DMSO or GW501516. The mRNA and protein levels of PPARδ target genes as well as FAO rates were determined. PDK4 and UCP3 mRNA levels were comparable in the PGC-1α WT and KO cells, whereas CPT-1b mRNA level was reduced in the KO cells without the GW501516 treatment (Fig. 4C). The mRNA levels of these three genes were induced in both WT and PGC-1α null cells; however, the expression levels of Cpt-1b and Pdk4 were significant lower in the PGC-1α null cells compared with the WT cells upon stimulation with GW501516 (Fig. 4C). The mRNA expression level of UCP3 was comparable with the GW501516 treatment in both WT and KO cells (Fig. 4C), suggesting that the induction of UCP3 by GW501516 was independent of PGC-1α. Consistent with the mRNA expression levels, PDK4 protein was increased by GW501516 treatment in the WT cells; however, this increase was diminished in the PGC-1α null cells (Fig. 4D). UCP3 protein was increased by GW501516 treatment to a similar extent in the WT cells compared with the PGC-1α null cells (Fig. 4D). Palmitate oxidation with the GW501516 treatment was 30% lower in the PGC-1α KO muscle cells compared with the WT controls, indicating that loss of PGC-1α impairs PPARδ-induced FAO (Fig. 4E). Similar results were obtained in the primary mouse myotubes following knockdown of PGC-1α (data not shown). These results indicate that the effects of pharmacological activation of PPARδ on PDK4 and CPT-1b expression as well as fat oxidation depend on PGC-1α.
FIGURE 4.
GW501516-mediated gene expression and FAO in PGC-1α KO myotubes. Primary WT and PGC-1α KO myotubes were treated with 100 nm GW501516 for 24 h. A and C, RNA was extracted, and the mRNA levels for the indicated genes were measured by quantitative PCR. B, cells were lysed, and CS activity was measured. D, cells were lysed in RIPA buffer, and protein lysate was subjected to Western blot analysis. E, cells were labeled with 14C-palmitate, and FAO rates were measured. Data are mean ± S.E. (n = 3). *, p ≤ 0.05 for DMSO versus GW; #, p ≤ 0.05 for WT versus PGC-1α KO. CytC, cytochrome c.
PGC-1a Potentiates PPARδ-induced Cpt-1b and Pdk4 Gene Expression
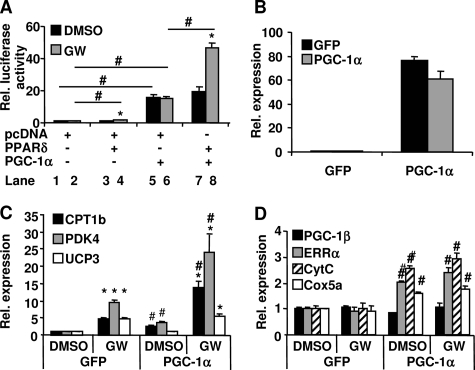
The induction of CPT-1b and PDK4 by PPARδ agonism appears to be dependent on PGC-1α. To determine whether PGC-1α coactivates PPARδ-mediated Pdk4 transcription directly, a Pdk4 promoter-driven luciferase reporter (24) was transfected into HeLa cells along with various expression vectors, as indicated in Fig. 5A. Cells were treated with either vehicle or 100 nm GW501516 for 24 h. PPARδ activated Pdk4 transcription only in the presence of GW501516 treatment, indicating that PPARδ-induced Pdk4 transcription is ligand-dependent (Fig. 5A, lane 4 versus lane 3 and lane 3 versus lane 1). PGC-1α robustly increased Pdk4 transcription regardless of GW501516 treatment (lanes 5 and 6 versus lanes 1 and 2). Interestingly, PPARδ and PGC-1α increased Pdk4 transcription synergistically only with the GW501516 treatment (Fig. 5A, lane 8 versus lane 7 and lane 7 versus lane 5). The results demonstrate that PPARδ-induced Pdk4 transcription is coactivated by PGC-1α in a ligand-dependent manner. To further confirm this ligand-dependent coactivation of the PPARδ target gene transcription by PGC-1α, the endogenous expression levels of Pdk4 and Cpt-1b were measured in C2C12 myotubes transduced with an adenovirus expressing either GFP or PGC-1α. As shown in Fig. 5B, PGC-1α mRNA was markedly elevated in the myotubes transduced with the PGC-1α adenovirus compared with the cells transduced with GFP adenovirus. The mRNA levels of CPT-1b, PDK4, and UCP3 were significantly increased by the GW501516 treatment alone in C2C12 myotubes (Fig. 5C). This finding is consistent with the results obtained in the primary mouse myotubes (Fig. 1B). Overexpression of PGC-1α alone resulted in a significant increase of Cpt-1b and Pdk4 expression, demonstrating that PGC-1α was able to induce Pdk4 and Cpt-1b gene expression independent of PPARδ agonism (Fig. 5, A and C). Overexpression of PGC-1α combined with GW501516 treatment led to a robust synergistic induction of PDK4 and CPT-1b mRNA expression (Fig. 5C), in agreement with the synergistic activation of Pdk4 (Fig. 5A) and Cpt-1b promoters by PPARδ and PGC-1α (18). Ucp3 expression was only induced by the GW501516 treatment and not by PGC-1α overexpression (Fig. 5C). These data, together with the results in Fig. 4, indicate that Ucp3 induction by PPARδ is independent of PGC-1α. PGC-1α overexpression led to a robust induction of Errα, cytochrome c, and Cox5a expression in the cells. This induction was not further enhanced by the treatment with GW501516 (Fig. 5D). The results demonstrate that PGC-1α potentiates PPARδ-induced Pdk4 and Cpt-1b expression in a PPARδ ligand-dependent manner, whereas PGC-1α-induced mitochondrial biogenesis in these cells is independent of PPARδ agonism.
FIGURE 5.
Effect of PGC-1α on GW501516-mediated FAO and mitochondrial gene expression. A, HeLa cells were transfected with PDK4-luciferase reporter and the indicated expression vectors for 24 h followed by a 24-h treatment with either DMSO or GW501516 (100 nm). The luciferase activity, indicative of PDK4 transcription, was measured. Data are mean ± S.E. (n = 8). *, p ≤ 0.05 for DMSO versus GW; #, p ≤ 0.05 for the comparison as indicated. B–D, C2C12 myotubes were transduced with either the PGC-1α or GFP adenovirus for 48 h and then treated with DMSO or 100 nm GW501516 for 24 h. RNA was extracted, and the mRNA levels of the indicated genes were measured by quantitative PCR. Data are mean ± S.E. (n = 3). *, p ≤ 0.05 for DMSO versus GW; #, p ≤ 0.05 for GFP versus PGC-1α. CytC, cytochrome c.
PGC-1β Knockdown Does Not Affect PPARδ-driven FAO
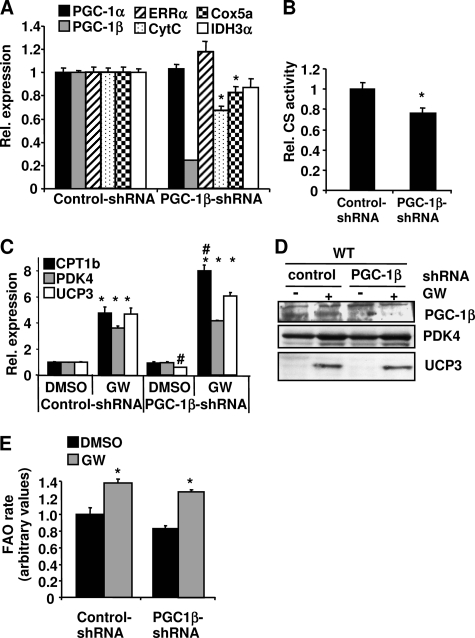
Loss of PGC-1α reduced but did not completely abolish GW501516-induced FAO (Fig. 4E), raising the possibility that other coactivators, such as PGC-1β, might also contribute to PPARδ-mediated FAO. To test this hypothesis, primary muscle cells were transduced with a PGC-1β shRNA or a control adenovirus. PGC-1β mRNA level was reduced 80%, and PGC-1β protein was completely abolished in the PGC-1β shRNA-transduced cells (Fig. 6, A and D). Knockdown of PGC-1β resulted in a significant reduction of cytochrome c and Cox5a mRNA levels (Fig. 6A). CS activity was also decreased, indicating that mitochondrial function was reduced (Fig. 6B) by the loss of PGC-1β in the cells. Unlike PGC-1α, depletion of PGC-1β expression did not impair the induction of CPT-1b, PDK4, and UCP3 mRNA expression by GW501516 treatment (Fig. 6C). PDK4 and UCP3 proteins were also increased by GW501516 treatment to a similar extent in the PGC-1β knockdown cells compared with the control cells (Fig. 6D). The induction of palmitate oxidation rates by GW501516 were also comparable in both PGC-1β knockdown and control cells (Fig. 6E). These results indicate that knockdown of PGC-1β alone does not affect PPARδ-mediated gene expression and FAO rate or that PGC-1α compensates for the loss of PGC-1β.
FIGURE 6.
Effect of PGC-1β knockdown on GW501516-mediated gene expression and FAO. Primary myotubes were infected with the PGC-1β shRNA or a control adenovirus for 72 h and then treated with either 100 nm GW501516 or DMSO for the last 24 h. A and C, RNA was extracted, and the mRNA levels of the indicated genes were measured by quantitative PCR. B, cells were lysed, and CS activities were determined. D, cells were lysed in RIPA buffer. Protein lysate from each sample was subjected to Western blot analysis. E, cells were labeled with 14C-palmitate, and FAO rates were measured. The FAO rate in the control/DMSO was set at 1, and the FAO rates under other conditions were expressed as -fold change relative to the control/DMSO. Data are mean ± S.E. (n = 3). *, p ≤ 0.05 for DMSO versus GW; #, p ≤ 0.05 for control versus PGC-1β shRNA. CytC, cytochrome c.
Reduction of Both PGC-1α and PGC-1β Completely Abolishes PPARδ-mediated FAO in Muscle Cells
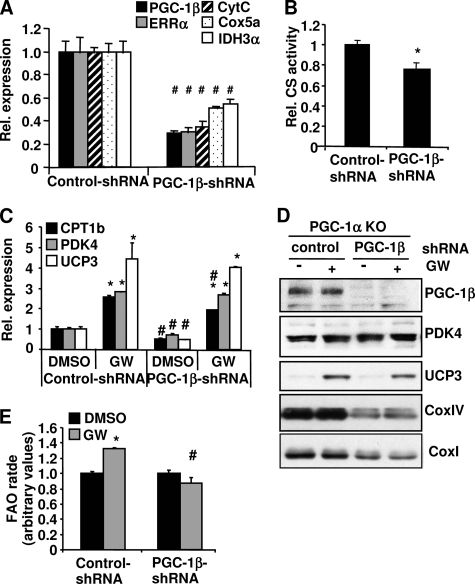
To investigate whether PGC-1α and PGC-1β have overlapping functions in regulating PPARδ-mediated FAO, we knocked down PGC-1β expression in the PGC-1α KO myotubes to generate cells lacking both proteins. PGC-1α KO cells display already a 40–60% reduction of mitochondrial gene expression when compared with the WT cells (Fig. 4A). A reduction of PGC-1β in the PGC-1α KO cells resulted in an additional 50–60% decrease in the mRNA levels of cytochrome c, IDH3α, and Cox5a (Fig. 7A). Protein levels of CoxI and CoxIV were markedly reduced with the loss of PGC-1β in the PGC-1α KO cells (Fig. 7D), indicating that mitochondrial gene expression is strongly dependent on PGC-1β in the absence of PGC-1α. The CS activity was further reduced with the knockdown of PGC-1β (Fig. 7B). Expression levels of Cpt-1b, Pdk4, and Ucp3 were significantly reduced at the basal condition when PGC-1β was knocked down (Fig. 7C), but the protein level of PDK4 was not affected. Loss of PGC-1β in addition to PGC-1α did not further impair the induction of these genes upon PPARδ activation by GW501516 (Fig. 7C). In addition to gene expression, the fatty acid rates were measured in the muscle cells lacking both PGC-1α and -β or only PGC-1α. Surprisingly, GW-induced palmitate oxidation was completely abolished in the cells lacking both PGC-1α and PGC-1β (Fig. 7E) despite a comparable increase in GW501516-induced gene expression (Fig. 7C). Similar results were obtained in primary muscle cells, where both PGC-1α and PGC-1β were knocked down by shRNAs (data not shown). These results indicate that both PGC-1α and PGC-1β are essential for the induction of fat oxidation induced by PPARδ agonism.
FIGURE 7.
The effect of knockdown PGC-1β on GW501516-mediated gene expression and FAO in the PGC-1α KO myotubes. The PGC-1α null myotubes were transduced with PGC-1β shRNA or a control adenovirus for 72 h and then treated with DMSO or 100 nm GW501516 (23) for the last 24 h. A and C, RNA was extracted, and the mRNA levels of the indicated genes were measured by quantitative PCR. B, cells were lysed, and CS activities were determined. D, cells were lysed in RIPA buffer, and 10–40 ng of protein extract was used for Western blotting. E, cells were labeled with 14C-palmitate, and FAO rates were measured. The FAO rate in the control/DMSO was set at 1, and the FAO rates under other conditions were expressed as -fold change relative to the control/DMSO. Data are mean ± S.E. (n = 3). *, p ≤ 0.05 for DMSO versus GW; #, p ≤ 0.05 for control versus PGC-1β shRNA. CytC, cytochrome c.
Knockdown of PPARδ Does Not Affect PGC-1α-mediated FAO and Mitochondrial Gene Expression
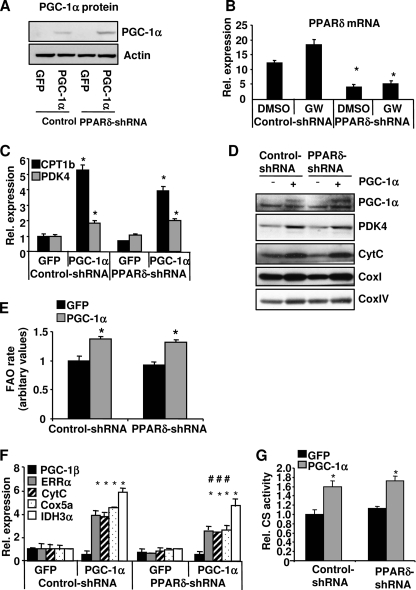
PGC-1α has been shown to drive oxidative metabolism and to induce FAO through coactivation of ERRα and PPARα (19). However, PGC-1α was still able to induce FAO, to a lesser extent, in the cells lacking these two proteins, suggesting that other factor(s) might mediate PGC-1α-induced FAO (19). PPARδ is a conceivable candidate, since it interacts with PGC-1α, and its transcriptional activity is enhanced by PGC-1α (18, 20) (Fig. 5A). To determine whether PPARδ contributes to the regulation of FAO mediated by PGC-1α, primary myotubes were co-transduced with an adenovirus expressing PGC-1α and a PPARδ shRNA to knock down PPARδ expression. PGC-1α protein levels were elevated in the cells transduced with the PGC-1α adenovirus (Fig. 8A), whereas PPARδ mRNA levels were markedly reduced in the cells transduced with the PPARδ shRNA adenovirus (Fig. 8B). Overexpression of PGC-1α increased the mRNA levels of the PPARδ target genes Cpt-1b and Pdk4 to a similar extent at both the mRNA and protein levels in the PPARδ knockdown cells compared with the control cells (Fig. 8, C and D). The FAO rate was increased by PGC-1α overexpression, and this induction was not attenuated when PPARδ was knocked down (Fig. 8E). PGC-1α overexpression led to a robust increase in the expression of Errα, cytochrome c, Cox5a, and Idh3α mRNA, suggesting that there is an increase of mitochondrial biogenesis in the cells (Fig. 8F). This induction was modestly but significantly reduced when PPARδ was knocked down. However, the protein levels of cytochrome c, CoxI, and CoxIV as well as CS activity were not affected by PPARδ knockdown (Fig. 8, D and G). Thus, knockdown of PPARδ did not significantly affect the ability of PGC-1α to increase fat oxidation and mitochondrial biogenesis. The data in Fig. 5D showed that PPARδ agonism did not enhance PGC-1α-induced mitochondrial gene expression. Taken together, these results suggest that PGC-1α-driven mitochondrial biogenesis and FAO are not dependent on PPARδ.
FIGURE 8.
Effect of PPARδ knockdown on PGC-1α-mediated FAO and mitochondrial gene expression. Primary myotubes were transduced with PPARδ shRNA or a control adenovirus. The next day, the cells were transduced with either the PGC-1α or GFP adenovirus for 48 h. A, cells were lysed and subjected to Western blot analysis to measure PGC-1α protein levels. B, C, E, and F, RNA was extracted, and the mRNA levels of the indicated genes were measured by quantitative PCR. D, cells were labeled with 14C-palmitate, and FAO rates were measured. E, cells were lysed in RIPA buffer, and 10–40 ng of protein extract was used for Western blotting. G, cells were lysed, and CS activities were determined. Data are mean ± S.E. (n = 3). *, p ≤ 0.05 for GFP versus PGC-1α; #, p ≤ 0.05 for control versus PPARδ shRNA. CytC, cytochrome c.
DISCUSSION
In this study, the effects of pharmacological activation of PPARδ on lipid metabolism and mitochondrial gene expression were examined in vitro and in vivo. As expected, activation of PPARδ with GW501516 resulted in a robust activation of genes involved in lipid metabolism (CPT-1b, PDK4, and UCP3) in vivo and in vitro as well as increased FAO rate in primary muscle cells. However, PPARδ agonism failed to increase mitochondrial gene expression and function in vitro and in vivo (Figs. 1–3). Therefore, the effects of pharmacological activation of the endogenous PPARδ do not fully recapitulate the effects observed in the VP16-PPARδ transgenic mouse or the muscle-specific PPARδ KO mouse model, in which mitochondrial biogenesis was strongly induced or decreased, respectively (3). In addition, GW501516 treatment did not cause a fiber type switch, as it has been seen in the VP16-PPARδ transgenic and muscle-specific PPARδ mouse model and could be developmentally regulated. Despite the lack of increased mitochondrial function, activation of PPARδ improved glucose homeostasis in the obese and insulin-resistant ob/ob mice (Fig. 2), confirming its potency in ameliorating metabolic disorders (1). These data suggest that the effects of PPARδ activity on glucose homeostasis are most likely mediated by increased lipid oxidation rates or other not yet known PPARδ effects, which are not dependent on an increase in muscle mitochondrial gene expression.
We also investigated the molecular mechanisms by which activation of PPARδ regulates lipid metabolism. PGC-1α has been shown to enhance the transcriptional activity of PPARs in luciferase assays (18, 20). However, it was not known to what extent this coactivation is essential for the action of PPARδ on endogenous target gene expression. Our data revealed that PGC-1α, but not PGC-1β, was required for the full activation of Cpt-1b and Pdk4 by PPARδ (). Since PPARδ mRNA levels were not altered in the PGC-1α KO primary myotubes or in the muscle of either the PGC-1α KO mice or the MCK-PGC-1α transgenic mice,3 it is unlikely that PGC-1α regulates PPARδ expression directly. Thus, the impact of PGC-1α on PPARδ-mediated effects is most likely through coactivation of this receptor. This is supported by the synergistic action of PGC-1α and GW501516 on these genes (Fig. 5C). In addition, our data show that PGC-1α directly coactivates the Pdk4 promoter via PPARδ in a ligand-dependent manner (Fig. 5A). Others had reported a similar effect of PGC-1α on the Cpt-1b promoter (18). Interestingly, UCP3 appears to be a PPARδ-specific target gene whose expression was induced by PPARδ agonism in a PGC-1α-independent manner (Figs. 4 and 5).
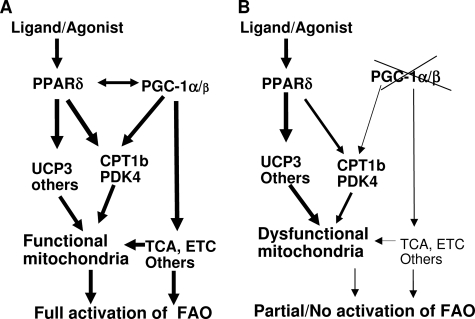
We further investigated the roles of PGC-1 coactivators in mediating FAO induced by GW501516. Deletion of PGC-1α, but not PGC-1β, significantly reduced the induction of FAO rate induced by GW501516 (Figs. 4 and 6). Surprisingly, GW-induced fat oxidation was completed abolished in the absence of both PGC-1α and PGC-1β proteins despite an induction of Cpt-1b, Pdk4, and Ucp3 expression comparable with the PGC-1α KO cells (Fig. 7). We believe that a strong reduction of mitochondrial function in the absence of both PGC-1 coactivators might contribute to this. Under normal conditions where PGC-1 proteins are expressed, activation of PPARδ triggers an increase in fatty acid β-oxidation through up-regulation of the key FAO target genes. PGC-1α enhances the action of PPARδ on Cpt-1b and Pdk4 in a PPARδ ligand-dependent manner. In addition, PGC-1 proteins are essential to maintain mitochondrial gene expression, including genes involved in lipid metabolism, oxidative phosphorylation, and tricarboxylic acid cycle to ensure the proper function of mitochondria. The final product of β-oxidation is metabolized in the tricarboxylic acid cycle, which yields reducing agents that are subsequently oxidized in the ETC to generate ATP in the functional mitochondria (Fig. 9A). In the absence of PGC-1 proteins, PPARδ activation can still increase the expression of its target genes to a certain extent. However, mitochondrial oxidative capacity, such as tricarboxylic acid cycle and ETC activities, is discordantly reduced, which in turn hinders an increase in fatty acid β-oxidation (Fig. 9B). Similarly, Koves et al. (21) suggested that high lipid supply, under conditions of low PGC-1α, could provoke a disconnection between mitochondrial β-oxidation and the tricarboxylic acid cycle, which might contribute to the pathogenesis of insulin resistance. Our data support the hypothesis that PGC-1α furnishes the mitochondria to cope with high lipid load by coordinately regulating fatty acid β-oxidation, tricarboxylic acid cycle, and electron transport chain activity (21, 22).
FIGURE 9.
A proposed model by which PGC-1 coactivators and PPARδ regulate FAO. A, in the presence of PGC-1 coactivators, the mitochondria are furnished with a functional β-oxidation, tricarboxylic acid cycle (TCA), and electron transport chain (ETC). PGC-1α and PPARδ activate Cpt-1b and Pdk4 genes synergistically in a ligand-dependent manner, which results in an increase in fatty acid β-oxidation. The fatty acids are completely oxidized to CO2 to generate ATP in the functional mitochondria. B, in the absence of PGC-1 coactivators, PPARδ-driven Pdk4 and Cpt-1b gene expression is reduced due to a lack of coactivation by PGC-1α. Other genes important for β-oxidation and components of the tricarboxylic acid cycle and ETC are markedly decreased in the absence of PGC-1s, which in turn may hinder fat oxidation mediated by PPARδ agonism.
Although PGC-1α is able to coactivate PPARδ on the Cpt-1b and Pdk4 genes, PPARδ does not seem to be essential for PGC-1α-mediated gene expression, including Cpt-1b, Pdk4, and mitochondrial genes. Knockdown of PPARδ did not affect the transcriptional program induced by PGC-1α; nor did it reduce PGC-1α-mediated mitochondrial function in primary myotubes. Our results indicate that PGC-1α does not require the presence of PPARδ to activate mitochondrial biogenesis, which is most likely mediated through ERRα (19).
In summary, our study shows that activation of the endogenous PPARδ using a synthetic ligand increased lipid oxidation and improved glucose metabolism and insulin sensitivity. However, PPARδ agonism failed to induce mitochondrial gene expression and function in vitro and in vivo, which was confirmed by another study (25) published during the revision of this paper. In addition, PGC-1α coactivates PDK4 transcription via PPARδ in a ligand-dependent manner. PGC-1α is required for full activation of FAO by PPARδ in muscle cells. Furthermore, both PGC-1α and PGC-1β are essential for PPARδ-driven fat oxidation. We hypothesize that PGC-1α and PGC-1β provide a functional mitochondrial environment to allow an increased FAO rate through activation of PPARδ (Fig. 9). Conversely, PGC-1α-mediated mitochondrial biogenesis and fatty oxidation appear to be independent of PPARδ.
Supplementary Material
Acknowledgments
We thank Dr. Patrick Seale (Dana Farber Cancer Institute) for the help with the isolation of PGC-1± KO and WT myoblasts, Cara Ngo and David Huang for conducting the ob/ob study, and Yunyu Zhang for assistance in microarray data analysis. We also thank Drs. Shari Caplan (Novartis), Sue Stevenson (Novartis), and Dr. Jennifer Estall (Dana Farber Cancer Institute) for critical reading of the manuscript and helpful discussions.

The on-line version of this article (available at http://www.jbc.org) contains supplemental Fig. 1.
S. Kleiner, V. Nguyen-Tran, O. Baré, X. Huang, B. Spiegelman, and Z. Wu, unpublished data.
- PPAR
- peroxisome proliferator-activated receptor
- CS
- citrate synthase
- FAO
- fatty acid oxidation
- KO
- knock-out
- shRNA
- short hairpin RNA
- GFP
- green fluorescent protein
- ETC
- electron transport chain
- MHC
- myosin heavy chain
- WT
- wild type
- RIPA
- radioimmune precipitation.
REFERENCES
- 1.Takahashi S., Tanaka T., Sakai J. (2007) Endocr. J. 54, 347–357 [DOI] [PubMed] [Google Scholar]
- 2.Braissant O., Foufelle F., Scotto C., Dauça M., Wahli W. (1996) Endocrinology 137, 354–366 [DOI] [PubMed] [Google Scholar]
- 3.Wang Y. X., Zhang C. L., Yu R. T., Cho H. K., Nelson M. C., Bayuga-Ocampo C. R., Ham J., Kang H., Evans R. M. (2004) PLoS Biol. 2, e294. [DOI] [PMC free article] [PubMed] [Google Scholar]
- 4.Luquet S., Lopez-Soriano J., Holst D., Fredenrich A., Melki J., Rassoulzadegan M., Grimaldi P. A. (2003) FASEB J., 03–0269fje [DOI] [PubMed] [Google Scholar]
- 5.Handschin C., Spiegelman B. M. (2006) Endocr. Rev. 27, 728–735 [DOI] [PubMed] [Google Scholar]
- 6.Wu Z., Puigserver P., Andersson U., Zhang C., Adelmant G., Mootha V., Troy A., Cinti S., Lowell B., Scarpulla R. C., Spiegelman B. M. (1999) Cell 98, 115–124 [DOI] [PubMed] [Google Scholar]
- 7.Lin J., Wu P. H., Tarr P. T., Lindenberg K. S., St-Pierre J., Zhang C. Y., Mootha V. K., Jäger S., Vianna C. R., Reznick R. M., Cui L., Manieri M., Donovan M. X., Wu Z., Cooper M. P., Fan M. C., Rohas L. M., Zavacki A. M., Cinti S., Shulman G. I., Lowell B. B., Krainc D., Spiegelman B. M. (2004) Cell 119, 121–135 [DOI] [PubMed] [Google Scholar]
- 8.Lin J., Wu H., Tarr P. T., Zhang C. Y., Wu Z., Boss O., Michael L. F., Puigserver P., Isotani E., Olson E. N., Lowell B. B., Bassel-Duby R., Spiegelman B. M. (2002) Nature 418, 797–801 [DOI] [PubMed] [Google Scholar]
- 9.Schuler M., Ali F., Chambon C., Duteil D., Bornert J. M., Tardivel A., Desvergne B., Wahli W., Chambon P., Metzger D. (2006) Cell Metab. 4, 407–414 [DOI] [PubMed] [Google Scholar]
- 10.Sabourin L. A., Girgis-Gabardo A., Seale P., Asakura A., Rudnicki M. A. (1999) J. Cell Biol. 144, 631–643 [DOI] [PMC free article] [PubMed] [Google Scholar]
- 11.Wu Z., Huang X., Feng Y., Handschin C., Feng Y., Gullicksen P. S., Bare O., Labow M., Spiegelman B., Stevenson S. C. (2006) Proc. Natl. Acad. Sci. U.S.A. 103, 14379–14384 [DOI] [PMC free article] [PubMed] [Google Scholar]
- 12.Lin J., Yang R., Tarr P. T., Wu P. H., Handschin C., Li S., Yang W., Pei L., Uldry M., Tontonoz P., Newgard C. B., Spiegelman B. M. (2005) Cell 120, 261–273 [DOI] [PubMed] [Google Scholar]
- 13.St-Pierre J., Lin J., Krauss S., Tarr P. T., Yang R., Newgard C. B., Spiegelman B. M. (2003) J. Biol. Chem. 278, 26597–26603 [DOI] [PubMed] [Google Scholar]
- 14.Moyes C. D., Mathieu-Costello O. A., Tsuchiya N., Filburn C., Hansford R. G. (1997) Am. J. Physiol. 272, C1345–C1351 [DOI] [PubMed] [Google Scholar]
- 15.Thupari J. N., Landree L. E., Ronnett G. V., Kuhajda F. P. (2002) Proc. Natl. Acad. Sci. U.S.A. 99, 9498–9502 [DOI] [PMC free article] [PubMed] [Google Scholar]
- 16.Tanaka T., Yamamoto J., Iwasaki S., Asaba H., Hamura H., Ikeda Y., Watanabe M., Magoori K., Ioka R. X., Tachibana K., Watanabe Y., Uchiyama Y., Sumi K., Iguchi H., Ito S., Doi T., Hamakubo T., Naito M., Auwerx J., Yanagisawa M., Kodama T., Sakai J. (2003) Proc. Natl. Acad. Sci. U.S.A. 100, 15924–15929 [DOI] [PMC free article] [PubMed] [Google Scholar]
- 17.Semple R. K., Crowley V. C., Sewter C. P., Laudes M., Christodoulides C., Considine R. V., Vidal-Puig A., O'Rahilly S. (2004) Int. J. Obes. Relat. Metab. Disord. 28, 176–179 [DOI] [PubMed] [Google Scholar]
- 18.Dressel U., Allen T. L., Pippal J. B., Rohde P. R., Lau P., Muscat G. E. O. (2003) Mol. Endocrinol. 17, 2477–2493 [DOI] [PubMed] [Google Scholar]
- 19.Huss J. M., Torra I. P., Staels B., Giguère V., Kelly D. P. (2004) Mol. Cell. Biol. 24, 9079–9091 [DOI] [PMC free article] [PubMed] [Google Scholar]
- 20.Wang Y. X., Lee C. H., Tiep S., Yu R. T., Ham J., Kang H., Evans R. M. (2003) Cell 113, 159–170 [DOI] [PubMed] [Google Scholar]
- 21.Koves T. R., Li P., An J., Akimoto T., Slentz D., Ilkayeva O., Dohm G. L., Yan Z., Newgard C. B., Muoio D. M. (2005) J. Biol. Chem. 280, 33588–33598 [DOI] [PubMed] [Google Scholar]
- 22.Koves T. R., Ussher J. R., Noland R. C., Slentz D., Mosedale M., Ilkayeva O., Bain J., Stevens R., Dyck J. R., Newgard C. B., Lopaschuk G. D., Muoio D. M. (2008) Cell Metab. 7, 45–56 [DOI] [PubMed] [Google Scholar]
- 23.Baur J. A., Pearson K. J., Price N. L., Jamieson H. A., Lerin C., Kalra A., Prabhu V. V., Allard J. S., Lopez-Lluch G., Lewis K., Pistell P. J., Poosala S., Becker K. G., Boss O., Gwinn D., Wang M., Ramaswamy S., Fishbein K. W., Spencer R. G., Lakatta E. G., Le Couteur D., Shaw R. J., Navas P., Puigserver P., Ingram D. K., de Cabo R., Sinclair D. A. (2006) Nature 444, 337–342 [DOI] [PMC free article] [PubMed] [Google Scholar]
- 24.Wende A. R., Huss J. M., Schaeffer P. J., Giguère V., Kelly D. P. (2005) Mol. Cell. Biol. 25, 10684–10694 [DOI] [PMC free article] [PubMed] [Google Scholar]
- 25.Narkar V. A., Downes M., Yu R. T., Embler E., Wang Y. X., Banayo E., Mihaylova M. M., Nelson M. C., Zou Y., Juguilon H., Kang H., Shaw R. J., Evans R. M. (2008) Cell 134, 405–415 [DOI] [PMC free article] [PubMed] [Google Scholar]
Associated Data
This section collects any data citations, data availability statements, or supplementary materials included in this article.


