

Abstract
We used single molecule dynamic force spectroscopy to unfold individual serine/threonine antiporters SteT from Bacillus subtilis. The unfolding force patterns revealed interactions and energy barriers that stabilized structural segments of SteT. Substrate binding did not establish strong localized interactions but appeared to be facilitated by the formation of weak interactions with several structural segments. Upon substrate binding, all energy barriers of the antiporter changed thereby describing the transition from brittle mechanical properties of SteT in the unbound state to structurally flexible conformations in the substrate-bound state. The lifetime of the unbound state was much shorter than that of the substrate-bound state. This leads to the conclusion that the unbound state of SteT shows a reduced conformational flexibility to facilitate specific substrate binding and a reduced kinetic stability to enable rapid switching to the bound state. In contrast, the bound state of SteT showed an increased conformational flexibility and kinetic stability such as required to enable transport of substrate across the cell membrane. This result supports the working model of antiporters in which alternate substrate access from one to the other membrane surface occurs in the substrate-bound state.
The amino acid/polyamine/organocation (APC)2 superfamily comprises about 250 members that occur in all phyla from prokaryotes to higher eukaryotes. These membrane proteins function as solute/cation symporters or solute/solute antiporters (1). One APC subfamily is established by l-amino acid transporters (LATs), which correspond to the light subunits of eukaryotic heteromeric amino acid transporters (2, 3). Heteromeric amino acid transporters are composed of a light subunit that provides transport activity and a disulfide-linked heavy subunit that shows responsibility for plasma membrane targeting. Genetic defects in light and heavy subunits cause a number of inherited human diseases. Mutations in the light as well as the heavy subunit of system b0,+ lead to cystinuria (4, 5), whereas mutations in the light subunit y+LAT1 cause lysinuric protein intolerance (6, 7). Another light subunit, xCT that mediates cysteine uptake and glutamate efflux (8, 9), is involved in vivo in cocaine relapse (10) and maintenance of the plasma redox balance (11). LAT1, the light subunit of system L, is overexpressed in certain primary human tumors. It transports essential neutral amino acids with long, branched, or aromatic side chains required by tumor cells to support their unabated growth (12). Therefore, amino acid transporters like LAT1 are attractive anticancer drug targets.
So far a high resolution structure of a eukaryotic LAT family member is not available. However, studies on xCT revealed a membrane topology of 12 transmembrane helices (TMHs) with cytosolic N and C termini and a re-entrant loop structure between TMHs II and III (13). The identified first prokaryotic member of the LAT family, SteT from Bacillus subtilis, is a serine/threonine antiporter, which shows high sequence identity (∼30%) to the light subunits of eukaryotic heteromeric amino acid transporters. Moreover SteT exhibits a similar putative membrane topology and sequential mode of obligate exchange (14). Thus, SteT is an excellent model for studying the structure-function relationship of LAT family members.
According to current models, transport proteins undergo functionally related conformational changes. Transporters alternate between two conformations to expose their binding sites to the cytoplasmic and extracellular side (15–22). However, prior to conformational changes substrates have to be recognized and bound. If substrates are amino acids, three main features can be used for specific selection and binding: (i) the negatively charged α-carboxyl group, (ii) the positively charged α-amino group, and (iii) the electrostatic, hydrophobic, or spatial properties of the side chain (22–24). α-Carboxyl and α- amino groups of l-amino acids possess similar structural and chemical characteristics (except for proline); however, their side chains differ in shape, size, and electrostatic properties. Combinations of these features are assumed to establish different interactions within the side chain binding pocket, which determines the substrate specificity of the transporter. The two main substrates of SteT, l-serine and l-threonine, differ by only one methylene group in their side chain; thus they have similar properties. Additionally SteT transports aromatic l-amino acids (Trp, Tyr, and Phe) albeit less efficiently (14).
Since its invention, the atomic force microscope (AFM) (25) has evolved from a surface imaging device to a versatile tool for studying interactions of manifold biological systems (26–31). Introduced to characterize interactions between receptor-ligand complexes (32, 33) and complementary DNA strands (34), AFM-based single molecule force spectroscopy (SMFS) has been exploited to explore antibody-antigen recognition (35) and unfolding and refolding of soluble proteins (29, 36) and to probe the adhesion of living cells at molecular resolution (37). Applied to membrane proteins, SMFS uses the AFM stylus to exert a mechanical pulling force to the terminal end of a protein that is embedded and anchored by the lipid membrane (see Fig. 1A) (38). Sufficiently high stretching forces initiate sequential unfolding of the membrane protein with each step indicating the unfolding of a structural segment (39). Recording the applied force over pulling distance results in a force-distance (F-D) curve in which individual force peaks represent the rupture of intra- and intermolecular interactions. The height of a force peak measures the strength of an interaction with piconewton accuracy, and the pulling distance, at which the force peak occurs, allows the interaction within the membrane protein structure to be located (38).
FIGURE 1.

SMFS of SteT. A, pushing the AFM stylus onto the proteoliposomes promotes contacting single transporters to the stylus. This molecular link allows exertion of a mechanical pulling force that initiates stepwise unfolding of SteT. During the experiments, sample and cantilever are immersed in buffer solution. B, F-D curves recorded while unfolding single substrate-free SteT molecules. C, superimpositions of F-D curves recorded while unfolding SteT in buffer lacking any substrate (top) and supplemented with 5 mm l-serine (middle) or 5 mm l-threonine (bottom). Superimpositions are represented as density plots, each calculated from 60 F-D curves. Gray lines represent WLC curves with a persistence length of 0.4 nm and contour length (in amino acids) as indicated by the numbers next to the lines. The contour lengths were obtained from the Gaussian fits shown in D. F-D curves were obtained at room temperature at a pulling velocity of 654 nm/s in buffer solution (150 mm NaCl, 20 mm Tris-HCl, pH 8.0, substrate as indicated). D, frequency of force peaks detected at different positions of the stretched polypeptide. Every force peak detected in individual F-D curves (B) was fitted using the WLC model with the contour length of the stretched polypeptide as the only fitting parameter. The frequency at which the force peaks appeared is plotted in the histogram: substrate-free, n = 132; 5 mm l-serine, n = 128; and 5 mm l-threonine, n = 127. The bin size of the histograms is 3 aa and reflects the accuracy of fitting the WLC model (55) to individual force peaks. Error bars representing the S.E. were calculated using S.E. = (p(1 − p)/n)0.5 where p is the probability and n is the total number of F-D curves. The width of each force peak distribution is given by the experimental noise, conformational variability of the structural segments, and fitting accuracy of the force peaks (53, 99–102). The gray solid curve represents the sum of seven Gaussian fits to the seven main peaks from the histograms and superimpositions (C). Numbers next to peaks denote peak positions (measured in amino acids) obtained from Gaussian fits.
Besides quantification and localization of molecular interactions in membrane proteins, SMFS provides information about their energy landscape. For that purpose, the interactions of membrane proteins are probed over a range of different time scales by dynamic force spectroscopy (DFS). Bell (40) and Evans and co-worker (41, 42) provided the most commonly used theoretical framework to analyze DFS data. Their model describes the deformation of the energy landscape by an externally applied force, F. Such force-induced deformations reduce the energy barriers that separate bound and unbound states (see Fig. 2). Consequently transition rates over such energy barriers are force-dependent. Probing the interactions at different pulling velocities and thus at different force loading rates, rf, leads to a so-called dynamic force spectrum in which the most probable force, F*, of rupture is plotted versus the logarithm of rf. In these dynamic force spectra, each linear regime represents an energy barrier. Energy barriers located closer to the bound state are probed at higher pulling velocities because the energy barriers located further from the bound state are suppressed by increasingly applied forces (see Fig. 2) (41). The slope of each linear regime measures the distance from the ground state to the transition state, whereas extrapolation of a linear regime to zero force provides the rate constant of crossing the corresponding barrier in the absence of any load. These two parameters allow an estimate of the rigidity of the probed structure (43, 44).
FIGURE 2.

Energy landscape tilted by force. Schematic representation of the free energy profile along the reaction coordinate and applied force according to the Bell-Evans theory (40–42). The potential along the reaction coordinate (vector of force) in the absence of force (black curve) exhibits two energy barriers separating the folded from the unfolded state. Application of an external force, F, changes the thermal likelihood of reaching the top of the energy barrier(s). Although for a sharp barrier the position, xu, of the energy barrier relative to the folded state is not changed, the thermally averaged projection of the energy profile along the pulling direction is tilted by the mechanical energy (−F·cos θ)x (long-dashed line). This tilt decreases the energy barriers (short-dashed curve). Consequently the relevant energy barrier that has to be overcome is the outermost barrier. At slow pulling velocities, the thermal contribution is higher, and therefore, the mechanical energy required to overcome the barrier is smaller. With increasing pulling velocities, the barriers are further lowered. At some velocity, the height of the outer barrier will be lower than that of the inner barrier (short-dashed curve), which then becomes the relevant energy barrier to be overcome. Each energy barrier manifests as a linear regime in dynamic force spectra (Fig. 3).
In this study, we applied SMFS to characterize molecular interactions that stabilize SteT in the absence and in the presence of its substrates, l-serine and l-threonine. We used DFS to characterize how substrate binding changes the energy landscape and the mechanical properties of the antiporter. It was observed that the structural regions stabilized within SteT did not depend on substrate binding. However, substrate binding dynamically changed the energy landscape of these structures. In the absence of substrate all structural regions within SteT were stabilized by a narrow inner energy barrier and co-stabilized by a second outer energy barrier. The unique properties of these energy barriers restricted the conformation of SteT thereby trapping the antiporter in a kinetically instable and mechanically rigid conformation. In contrast, substrate binding sets SteT into a different energy minimum that significantly increased the kinetic stability and conformational flexibility of the antiporter.
EXPERIMENTAL PROCEDURES
Cloning, Overexpression, Purification, and Reconstitution into Proteoliposomes of SteT
SteT from B. subtilis was cloned, overexpressed, and purified as described previously (14). Purified SteT solubilized in n-decyl-β-d-maltopyranoside (Anatrace, Maumee, OH) was mixed with dimyristoylphosphatidylcholine (Avanti Polar Lipids, Alabaster, AL) solubilized in the same detergent (stock solution: 5 mg/ml dimyristoylphosphatidylcholine, 1% n-decyl-β-d-maltopyranoside, 150 mm NaCl, 10% glycerol, 0.01% NaN3, 20 mm Tris-HCl, pH 8) to achieve a lipid/protein ratio of 0.25 (w/w). The final SteT protein concentration was adjusted to 1.5 mg/ml. To reconstitute SteT into proteoliposomes the protein/lipid/detergent mixture was dialyzed against detergent-free buffer, i.e. 150 mm NaCl, 10% glycerol, 250 mm betaine, 0.01% NaN3, 20 mm Tris-HCl, pH 8 for about 1 week at room temperature.
SMFS and DFS
SMFS was performed using a Nanoscope IIIa AFM equipped with a PicoForce module and scanner (Veeco Metrology, Santa Barbara, CA). For a pulling velocity of 8720 nm/s, the AFM was extended with 16-bit data acquisition hardware (NI PCI-6221, National Instruments, Munich, Germany) that allowed data sampling frequencies of up to 125 kHz using IgorPro 5 (WaveMetrics, Inc., Lake Oswego, OR). The gold-coated 60-μm-long silicone nitride (Si3N4) cantilevers (BioLever, BL-RC150 VB, Olympus Ltd., Tokyo, Japan) had a nominal spring constant of 30 pN/nm and resonance frequency of ∼8 kHz in water. Spring constants of individual cantilevers were determined in solution using the equipartition theorem (45, 46) prior to experiments. SteT-containing proteoliposomes were adsorbed for 60–90 min at room temperature onto freshly cleaved mica in 150 mm NaCl, 20 mm Tris-HCl, pH 8.0. To characterize substrate binding the same buffer was supplemented with 5 mm l-serine or 5 mm l-threonine. After adsorption, the sample was rinsed several times with adsorption buffer to remove weakly attached membranes. Buffer solutions were prepared using nanopure water (≥18 megaohms cm; PURELAB Ultra, ELGA LabWater) and pro analysis grade chemicals from Sigma or Merck. After buffer exchange, the AFM was thermally equilibrated for at least 30 min under a glass bell. Prior to SMFS, membranes containing densely packed SteT were located by contact mode AFM imaging. If necessary, the AFM stylus was used as a nanoscalpel to remove aggregates or the upper layer of the vesicles (47, 48). An unperturbed area of the membrane patch was selected, and the AFM stylus was pushed onto the membrane at a force of ∼750 pN for 0.5–1.0 s to promote unspecific attachment of the SteT polypeptide to the AFM stylus. Although the nature of this unspecific attachment could never be shown, it is sufficiently strong to apply stretching forces of ∼2 nanonewtons to the attached polypeptide (27, 28, 36, 38, 39, 49–52). In the following step, the cantilever was retracted from the surface at a constant velocity. The polypeptide tethering stylus and membrane was stretched, an increasing mechanical stretching force was applied, and unfolding of SteT was induced. Unfolding of SteT was monitored by simultaneously recording the cantilever deflection and the distance traveled by the piezo. The interaction force at each separation was calculated from the deflection using Hook's law resulting in F-D curves.
DFS experiments were performed at eight pulling velocities (145, 311, 654, 1090, 2180, 2910, 4360, and 8720 nm/s) using substrate-free SteT and SteT in the presence of l-serine or l-threonine. To minimize errors that may occur due to uncertainties in the cantilever spring constant calibration, SteT was unfolded using at least three different cantilevers for each pulling velocity. Table 1 summarizes the number of F-D curves recorded for each condition.
TABLE 1.
Number of SteT F-D curves analyzed for each pulling velocity and substrate condition
| Pulling velocity | Number of analyzed F-D curves |
||
|---|---|---|---|
| Substrate-free | 5 mml-serine | 5 mml-threonine | |
| nm/s | |||
| 145 | 97 | 79 | 49 |
| 311 | 51 | 73 | 65 |
| 654 | 132 | 128 | 127 |
| 1090 | 101 | 86 | 68 |
| 2180 | 116 | 85 | 90 |
| 2910 | 106 | 109 | 86 |
| 4360 | 71 | 90 | 84 |
| 8720 | 71 | 81 | 109 |
Data Selection and Analysis
We have established in the past an approach to select F-D curves that represent complete unfolding of membrane proteins when exerting a mechanical stretching force to their termini (49–51, 53). Mechanically pulling the terminal end of a membrane protein induces the sequential unfolding of its secondary structure elements beginning from the mechanically stressed terminus. Each structure that establishes an unfolding barrier is detected as a force peak in the F-D curve. The last force peak of an F-D curve denotes the length of the unfolded and stretched polypeptide that has been anchored by the last structural segment remaining embedded in the membrane (50, 54). By overcoming the stability of this last structural element, the membrane protein has been completely unfolded, and the entire polypeptide will be extracted from the membrane. In other membrane proteins this last structural segment was established by the last TMH remaining embedded in the membrane. Accordingly we assumed for SteT that this last structural segment was established by the last TMH extracted from the membrane. Based on secondary structure prediction and because of the similar length of the N- and C-terminal peptides, the length of the stretched polypeptide would then correspond to a contour length of 380–440 amino acids (aa). Therefore, we only selected F-D curves showing overall lengths of 110–130 nm. These curves were manually aligned to the three characteristic force peaks observed at contour lengths of 70, 79, and 147 aa. Every peak of each F-D curve was fitted using the WLC model (55) with a persistence length of 0.4 nm and a monomer length per aa of 0.36 nm (36). The WLC fit of each force peak provides the contour length that reflects the amount of amino acids that had been unfolded and stretched. The obtained contour lengths and the corresponding rupture forces were statistically analyzed. Data analysis and calculations were performed using IgorPro 5 using built-in and custom procedures.
Compensation for Hydrodynamic Drag
At high pulling velocities, hydrodynamic friction of the cantilever causes an underestimation of the unfolding force (56). Hence the measured unfolding forces, Fmeasured, were corrected to obtain the real unfolding force, Freal, using Equation 1,
 |
where Ffric is the friction force, kspacer is the spring constant of the stretched polypeptide, and kcantilever is the spring constant of the cantilever (57). Ffric was half the difference between an approach and a retraction F-D curve of a free cantilever (56). The slope before peak rupturing was defined as kspacer and calculated from a WLC curve with the corresponding contour length. This correction for hydrodynamic drag was applied to force spectroscopy data acquired at pulling velocities of 1090, 2180, 2910, 4360, and 8720 nm/s.
Calculation of xu and k0 from DFS Data
According to the Bell-Evans theory (41), the most probable unfolding force F* plotted versus ln(rf*) describes the most prominent unfolding energy barriers that have been crossed along the force-driven reaction coordinate (42). The relation between F* and rf* can be described by Equation 2,
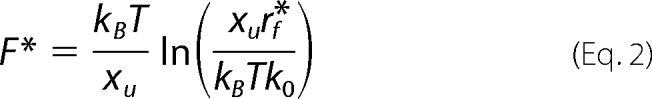 |
where kB is the Boltzmann constant, T is the absolute temperature, rf* is the most probable loading rate, xu is the distance between free energy minimum and transition state barrier, and k0 is the unfolding rate at zero force. The loading rate was calculated using rf = kspacer·v where v is the pulling velocity. Experimental loading rate and force histograms (supplemental Figs. S1–S3) were fitted with Gaussian distributions. The resulting F* was semilogarithmically plotted versus rf*. xu and k0 were obtained by fitting Equation 2 using a non-linear least squares algorithm. For compilation of histograms only forces and loading rates corresponding to the main peaks were considered.
Calculation of Transition Barrier Heights and Rigidity
The height of the free energy barrier, ΔG‡, separating the folded and unfolded state was assessed using an Arrhenius equation,
where τD denotes the diffusive relaxation time (58). Typical values for τD found for proteins are in the order of 10−7–10−9 s (59, 60). Therefore, assuming τD = 10−8 s seems to be reasonable for determining the free energy barrier heights. This value has also been used for molecular dynamics simulations of protein folding (61). We used τD = 10−8 s throughout all our calculations. Varying τD within the above mentioned range changes the free energy of activation by <15%. Moreover even if τD was wrong by orders of magnitude, the influence of the error of τD would be the same for all conditions and values and hence would not affect the qualitative results. Errors in ΔG‡ were estimated by propagation of the errors of k0.
In the absence of any information on the energy potential shape, we assume that a simple parabolic potential and the spring constant κ of the bond can be calculated using ΔG‡ and xu (43, 62).
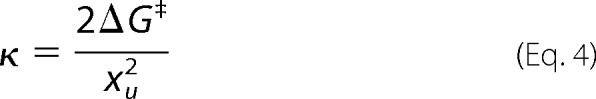 |
Errors in ΔG‡ and xu were propagated for estimation of errors in κ.
RESULTS
Interactions of SteT in the Presence and Absence of Substrates
We applied SMFS to determine the interactions stabilizing the serine/threonine antiporter SteT. Briefly, SteT proteoliposomes were imaged using the AFM in contact mode (data not shown) and selected for SMFS. The AFM stylus was brought into contact with the proteoliposome to facilitate formation of a molecular linkage between individual SteT molecules and the AFM stylus (Fig. 1A) (39). Upon retraction of the stylus, the deflection and separation of the cantilever were recorded simultaneously. Less than 5% of F-D curves exhibited a sawtooth-like pattern. Because of unspecific interactions, the AFM stylus attached at several positions of the SteT polypeptide. Hence the resulting F-D curves varied significantly in length and peak pattern. About 5% of these F-D curves displayed a well defined force peak pattern that extended over a length of 110–130 nm (Fig. 1B). Each of these F-D curves was sufficiently long to be correlated to the mechanical unfolding starting from one terminal end and showed one common pattern of seven major force peaks.
We recorded F-D curves at a pulling velocity of 654 nm/s for substrate-free SteT (n = 132) and SteT in the presence of 5 mm l-serine (n = 128) or 5 mm l-threonine (n = 127; Table 1). At first sight, the recorded F-D curves looked similar (Fig. 1B). However, individual F-D curves differed to some extent from each other. These differences manifested in missing peaks and slightly different peak positions or amplitudes. To visualize common features, F-D curves were superimposed and converted to density plots (Fig. 1C). All three superimpositions showed a common pattern of seven force peaks. A characteristic double peak occurred at the contour lengths of ∼70 and ∼79 aa. This feature was followed by four peaks at contour lengths of ∼147, ∼192, ∼237, and ∼302 aa. The last force peak was detected at ∼422 aa (Table 2). Force peaks at contour lengths 147, 192, 237, and 302 aa showed comparable low forces (Table 2). The peaks at 70 and 422 aa exhibited an intermediate force, whereas the segment located at 79 aa could withstand the highest forces (Table 2). From the superimpositions, we could not reveal substantial differences between the F-D spectra.
TABLE 2.
Contour lengths and rupture forces of interactions stabilizing structural segments of SteT
Contour lengths represent most probable peak positions (measured in amino acids) obtained from Gaussian fits to the contour length distributions (Fig. 1D). Forces represent most probable forces obtained from Gaussian fits to the experimental force distributions (supplemental Figs. S1–S3). Data were recorded at a pulling velocity of 654 nm/s.
| Substrate-free SteT |
l-Serine |
l-Threonine |
|||
|---|---|---|---|---|---|
| Contour length ± S.D. | Most probable force ± S.D. | Contour length ± S.D. | Most probable force ± S.D. | Contour length ± S.D. | Most probable force ± S.D. |
| aa | pN | aa | pN | aa | pN |
| 70.2 ± 7.7 | 80 ± 18 | 69.4 ± 7.4 | 76 ± 18 | 70.2 ± 5.0 | 84 ± 18 |
| 79.2 ± 1.1 | 92 ± 30 | 79.4 ± 1.2 | 107 ± 31 | 79.9 ± 1.1 | 112 ± 24 |
| 146.8 ± 5.0 | 51 ± 15 | 147.3 ± 5.9 | 55 ± 15 | 146.8 ± 6.2 | 63 ± 16 |
| 191.2 ± 3.1 | 50 ± 20 | 192.1 ± 5.4 | 51 ± 21 | 193.1 ± 7.5 | 62 ± 27 |
| 237.0 ± 4.6 | 49 ± 13 | 237.6 ± 6.1 | 58 ± 17 | 235.4 ± 9.4 | 56 ± 24 |
| 303.9 ± 6.0 | 55 ± 16 | 301.8 ± 5.1 | 60 ± 14 | 299.5 ± 7.9 | 66 ± 18 |
| 424.9 ± 9.7 | 70 ± 18 | 422.5 ± 7.6 | 77 ± 12 | 418.7 ± 9.9 | 79 ± 14 |
Direction of Unfolding
Using SMFS, membrane proteins can be mechanically unfolded pulling either the N- or C-terminal end. Depending from which end the unfolding is induced the F-D spectra show different patterns (50, 54, 63). In our measurements, all F-D curves that exhibited lengths between 110 and 130 nm showed one common force peak pattern. This indicated that all antiporters had been exclusively unfolded from one terminal end. According to the secondary structure predicted by the Phobius algorithm (64) the length of the N-terminal end corresponds to 11 aa, whereas that of the C-terminal end corresponds to 20 aa (including spacer and His6 tag). The AFM stylus can pick up the terminal end of a membrane protein at random positions. Accordingly the superimposition of the F-D curves showed starting points that are spread by the length of the terminal end pulled (Fig. 1C). However, other secondary structure prediction algorithms like MEMSAT3 (65) showed different lengths of N- and C-terminal ends. Thus, in the absence of a solid structural model, we could not make a straightforward assignment from which terminal end the mechanical unfolding of the antiporter was induced. However, for the following study it is not important to identify from which terminus SteT was unfolded.
Probability of Interactions
Each peak of an F-D curve reflects interactions established by SteT. To quantify the probability of SteT to establish certain interactions in the absence and presence of substrate, we fitted every force peak of individual F-D curves using the WLC model (55). We converted the position of each force peak into the length of the polypeptide that has been unfolded and stretched above the membrane surface. Then the probability of a force peak to appear was plotted versus the length of the stretched polypeptide (Fig. 1D). All histograms showed eight peaks. The first peak occurring at contour lengths between 0 and 50 aa was detected at close distances between the stylus and membrane surface at which unspecific interactions dominate the F-D spectra (Fig. 1B). Accordingly the superimpositions did not show defined force peaks in the corresponding region (Fig. 1C). In contrast, the other peaks in the histograms correlated nicely to the well defined force peaks in the superimpositions. To determine the most probable location of the force peaks (Table 2) we fitted Gaussian distributions to the major peaks in the histograms (Fig. 1D, gray line; fits for minor peaks are shown in supplemental Fig. S4). Interestingly the position of the force peaks did not change in the presence or absence of substrate. Additionally no significant changes in the force peak pattern could be detected in the presence of either substrate.
Substrate Binding Changes the Dynamic Energy Landscape of SteT
To examine how substrate binding influences the energy landscape of SteT, we unfolded substrate-free SteT and SteT in the presence of 5 mm l-serine or 5 mm l-threonine at pulling velocities ranging from 145 to 8720 nm/s (supplemental Fig. S5). In agreement with theoretical considerations (41, 42) and previous studies on soluble (66, 67) and membrane proteins (68–71), the unfolding forces increased with increased pulling velocities. Plotting the most probable unfolding force, F*, versus the logarithm of the most probable loading rate, rf* (Fig. 3), gained insight into the energy profile underlying individual structural segments of SteT (Fig. 2 and Table 3). The dynamic force spectra of every structural segment of substrate-free SteT showed two linear regimes (Fig. 3, left column). According to the Bell-Evans model (41) the existence of two linear regimes indicates that two barriers separate the folded from the unfolded state. At low loading rates, an outer barrier was probed, whereas at higher loading rates an inner barrier dominated the dynamic force spectrum. All structural segments exhibited inner barriers that showed ground-to-transition state distances, xu, from 0.21 to 0.36 nm and unfolding rates, k0, from 2.2 to 27 s−1. In contrast, their outer barriers showed much larger distances to the transition states ranging from 0.74 to 5 nm and much lower unfolding rates ranging from ∼4·10−42 to 0.1 s−1 (Table 3).
FIGURE 3.

Pulling velocity-dependent response of interactions that stabilize individual segments of SteT. Fitting the rf-dependent F* (lines) using Equation 2 provides the parameters of the energy barrier that stabilizes structural segments within SteT. xu measures the distance from the energy well of the native state to the transition state, and k0 describes the kinetic transition rate at which the structural segment unfolds at zero force. Error bars represent the S.E. of force and loading rate, respectively. Fits were weighted using the S.E. of the most probable force. Experiments were performed in 150 mm NaCl, 20 mm Tris-HCl, pH 8.0 in the absence of substrates (left column) or in the presence of 5 mm l-serine (middle column) or 5 mm l-threonine (right column). Peak positions are in amino acids.
TABLE 3.
Parameters characterizing the energy barriers (xu, k0, and ΔG‡) and spring constants (κ) of stable structural segments of SteT
Parameters are shown for the outer (substrate-freeouter) and inner (substrate-freeinner) barrier of substrate-free SteT and SteT in the presence of 5 mm l-serine or 5 mm l-threonine. Errors represent S.D. Changes in transition state, xu, were considered significant when the values for xu ± 2 S.D. did not overlap. Changes in transition rate, k0, were considered significant when exceeding 2 orders of magnitude. Barrier heights, ΔG‡, and spring constants, κ, were calculated as described under “Experimental Procedures.” pos., position. Values in bold changed by more than 3 orders of magnitude.
| Peak pos. |
xu ± S.D. |
k0 ± S.D. |
||||||
|---|---|---|---|---|---|---|---|---|
| Substrate-freeouter | Substrate-freeinner | l-Serine | l-Threonine | Substrate-freeouter | Substrate-freeinner | l-Serine | l-Threonine | |
| aa | nm | s−1 | ||||||
| 70 | 2.71 ± 2.85 | 0.23 ± 0.03 | 0.57 ± 0.05 | 1.10 ± 0.22 | 1.4 ± 78 × 10−19 | 15.5 ± 9 | 0.031 ± 0.030 | 1.5 ± 6.4 × 10⁻⁶ |
| 79 | 4.65 ± 14.5 | 0.29 ± 0.07 | 0.42 ± 0.04 | 0.57 ± 0.07 | 4.4 ± 1400 × 10−42 | 2.2 ± 3.7 | 0.043 ± 0.040 | 1.6 ± 2.7 × 10⁻³ |
| 147 | 2.68 ± 1.82 | 0.36 ± 0.03 | 0.59 ± 0.05 | 0.67 ± 0.05 | 1.8 ± 39 × 10−11 | 6.7 ± 2.4 | 0.14 ± 0.09 | 0.078 ± 0.049 |
| 192 | 0.74 ± 0.10 | 0.21 ± 0.02 | 0.38 ± 0.02 | 0.55 ± 0.06 | 7.7 ± 7.4 × 10⁻² | 26.7 ± 8.0 | 1.6 ± 0.4 | 0.17 ± 0.14 |
| 237 | 2.15 ± 0.98 | 0.27 ± 0.04 | 0.69 ± 0.07 | 1.34 ± 0.26 | 7.3 ± 82 × 10−9 | 15.0 ± 6.5 | 0.040 ± 0.034 | 8.7 ± 31 × 10−6 |
| 302 | 2.58 ± 1.19 | 0.24 ± 0.03 | 0.69 ± 0.06 | 0.79 ± 0.09 | 1.0 ± 16 × 10−12 | 12.2 ± 4.2 | 0.011 ± 0.010 | 3.7 ± 4.9 × 10⁻³ |
| 422 | 4.98 ± 4.58 | 0.30 ± 0.05 | 1.34 ± 0.21 | 0.83 ± 0.07 | 1.4 ± 110 × 10−34 | 3.3 ± 2.3 | 2.3 ± 8.5 × 10⁻⁸ | 1.4 ± 1.9 × 10⁻⁴ |
| Peak pos. | ΔG‡ |
κ |
||||||
|---|---|---|---|---|---|---|---|---|
| Substrate-freeouter | Substrate-freeinner | l-Serine | l-Threonine | Substrate-freeouter | Substrate-freeinner | l-Serine | l-Threonine | |
| aa | kBT | N/m | ||||||
| 70 | 62 | 16 | 22 | 32 | 0.07 | 2.41 | 0.55 | 0.22 |
| 79 | 114 | 18 | 22 | 25 | 0.04 | 1.72 | 1.00 | 0.64 |
| 147 | 43 | 17 | 21 | 21 | 0.05 | 1.06 | 0.49 | 0.39 |
| 192 | 21 | 15 | 18 | 20 | 0.32 | 2.84 | 1.01 | 0.55 |
| 237 | 37 | 16 | 22 | 30 | 0.07 | 1.84 | 0.38 | 0.14 |
| 302 | 46 | 16 | 23 | 24 | 0.06 | 2.27 | 0.40 | 0.32 |
| 422 | 97 | 17 | 36 | 27 | 0.03 | 1.64 | 0.17 | 0.33 |
On the contrary, the dynamic force spectra recorded in the presence of l-serine (Fig. 3, middle column) or l-threonine (Fig. 3, right column) revealed a single linear regime for every structural segment of SteT. This suggests that a single energy barrier stabilized the folded state of these structural segments in the ligand-bound state. For SteT in the presence of l-serine, xu ranged from 0.38 to 1.34 nm, and k0 ranged from 2.3·10−8 to 1.6 s−1. In the presence of l-threonine xu ranged from 0.55 to 1.34 nm, and k0 ranged from 1.5·10−6 to 0.17 s−1 (Table 3). Except for the last structural segment, the energy barriers determined for SteT in the presence of l-threonine showed slightly higher xu values than in the presence of l-serine. Depending on the substrate, the unfolding rate k0 of some structural segments changed by more than 3 orders of magnitude (Table 3, highlighted in bold). Transition states and unfolding rates determined for SteT in the presence of either substrate differed significantly from the values obtained for the inner barrier of substrate-free SteT.
Correlation of xu, k0, and ΔG‡
Taking all structural segments of SteT probed in the absence and presence of substrate into account we found a linear correlation (r = 0.71) between the position of the transition state xu and the free energy of activation, ΔG‡ (Fig. 4A). Concomitant with an increase in ΔG‡ the transition state shifted away from the energy minimum (higher xu; Fig. 4A and Table 3). For all structural segments xu increased along with ΔG‡ upon ligand binding, thus showing a Hammond-like behavior (70, 72–76). To further investigate the relationship between xu and ΔG‡, we plotted the ratio xu,substrate/xu,inner versus the ratio ΔGsubstrate‡/ΔGinner‡ for every structural segment (Fig. 4B). Assuming a linear relationship between the ratios xu,substrate/xu,inner and ΔGsubstrate‡/ΔGinner‡ (70), it becomes evident from the representative fits shown in Fig. 4B that every structural segment showed a unique energetic sensitivity toward ligand binding as the slopes of the fits for the individual structural segments were different.
FIGURE 4.

Correlation between xu and ΔG‡. A, plotting xu versus ΔG‡ reveals their linear correlation for all structural segments of substrate-free SteT (inner barrier; black symbols) and SteT in the presence of 5 mm l-serine (dark gray symbols) or 5 mm l-threonine (light gray symbols). Error bars represent S.D. B, changes in xu and ΔG‡ for SteT in the absence (inner barrier; black symbols) and presence of l-serine (dark gray symbols) or l-threonine (light gray symbols) with respect to the values for the inner barrier of substrate-free SteT. All structural segments revealed an apparent Hammond behavior; i.e. upon ligand binding xu increased with increasing ΔG‡. Short-dashed, long-dashed, and dot-dashed lines represent linear fits to the values obtained for the structural segments at 79 (open circle), 192 (open triangle), and 422 aa (filled diamond), respectively. The different slopes of these fits (2.31, 4.85, and 3.25 for the short-dashed, long-dashed, and dot-dashed lines) show that ligand binding influenced each individual structural segment differently. Data are taken from Table 3.
Mechanical Properties of SteT
Rigidity refers to the resistance of a material to structurally deform in response to a mechanical force. The rigidity of a protein depends on the curvature of the potential well of the energy profile, the height of the energy barrier, ΔG‡, and the distance xu separating ground and transition state (Fig. 2). The energy landscape describes the energy as a function of the conformational entropy of a protein structure (77–79). Accordingly decreasing (increasing) the width of an energy valley that defines the conformational entropy of a protein structure allows the protein to adopt less (more) conformational substates. This decrease (increase) of conformational substates is usually described as decreasing (increasing) the conformational flexibility (44, 57, 62, 80). In the absence of further information, we assumed a parabolic potential in the vicinity of the energy minimum and a sharp transition barrier for all structural segments of SteT (44, 62). To approximate the rigidity of individual structural segments we calculated their spring constants applying Equation 4. For substrate-free SteT we calculated spring constants for each of the two energy barriers that stabilized a structural segment (Table 3). The outer barriers of these structural segments showed spring constants between 0.03 and 0.07 N/m except for the segment correlated to force peak at ∼192 aa that exhibited an increased spring constant of 0.32 N/m. In contrast, the inner barriers of these structural segments showed much higher spring constants ranging from 1.06 to 2.84 N/m. In the presence of substrate, the spring constants of the individual structural segments ranging from 0.17 to 1.01 N/m for l-serine laid slightly above the spring constants for l-threonine ranging from 0.14 to 0.64 N/m (Table 3 and Fig. 5). These spring constants indicated that the rigidity of the structural segments within SteT was generally lower in the presence of substrate than that determined for the inner barriers and higher than that of the outer barriers of substrate-free SteT.
FIGURE 5.

Rigidity of structural segments of SteT in the absence and presence of substrate. For substrate-free SteT, rigidity of the outer and inner energy barriers is shown. Rigidity was estimated using Equation 4 to calculate the spring constant κ from xu and ΔG‡ obtained from DFS experiments. Errors represent S.D. and were propagated from the errors of xu and ΔG‡.
DISCUSSION
Amino Acid Binding by SteT Lacks Detectable Localized Interactions
Previously SMFS has been applied to reveal the unfolding pathways of several membrane proteins, i.e. rhodopsins (39, 51–53, 81) and antiporters (50, 82). Here we used SMFS to probe SteT, a member of the APC family. As for all membrane proteins investigated so far, the F-D spectra recorded upon mechanical unfolding of SteT showed a reproducible force peak pattern (Fig. 1, C and D, and Table 2). This characteristic F-D pattern can serve as a fingerprint of the membrane protein (38). It was recently observed that the F-D spectra of the Na+/H+ antiporters NhaA from Escherichia coli and MjNhaP1 from Methanococcus jannaschii showed an additional force peak that was established upon ligand binding to the activated transporter and could be correlated to a specific interaction that had been established between Na+ and deprotonated aspartic acid residues (82, 83) at the Na+ binding site (84). It was demonstrated that these functionally important aspartic acid residues established localized interactions with Na+ that caused an additional force peak in the F-D spectra. In contrast, substrate binding to the antiporter SteT did not show clear changes of the F-D pattern (Fig. 1, C and D). Thus, the binding of amino acids to an amino acid antiporter may follow different interaction patterns compared with those observed upon Na+ binding to a Na+/H+ antiporter.
Unfortunately no high resolution structure of SteT or of a homologue is available. However, crystal structures of other amino acid transporters in complex with their amino acids have been determined (20, 22). These structures revealed various ways for a transporter to bind an amino acid. For example in LeuTAa, a member of the neurotransmitter sodium symporter family, amino acids of the partially unwound TMHs I and VI coordinate the α-amino and α-carboxyl groups of leucine, whereas the leucine side chain resides in a hydrophobic pocket formed by TMHs III, VI, and VIII (22). Altogether 12 amino acids from four TMHs of LeuTAa were involved in leucine binding. Recent biochemical studies suggested that the E. coli cadaverine/l-lysine antiporter CadB, an APC family member (1), forms a hydrophilic cavity that requires eight of 12 TMHs to participate (85). Assuming that the substrate binding site is located within the translocation pathway, it seems feasible that multiple amino acid residues from several TMHs contribute to ligand binding. This notion is supported by the hydropathy profile alignment of membrane transport proteins that showed that APC transporters exhibit core structures similar to those of members of the neurotransmitter sodium symporter family (86). Therefore, it may be assumed that the interactions established between ligand and SteT are distributed such as observed for LeuT and CadB and not highly localized such as observed for Na+/H+ antiporters. Because our SMFS measurements did not reveal discrete changes of the F-D spectra that would have indicated localized interactions of the substrate with SteT, we conclude that binding of l-serine and l-threonine establishes rather weak interactions with multiple amino acid residues.
SteT Unfolds Differently Compared with Other Membrane Proteins
Recent DFS studies showed that structural segments of bacteriorhodopsin, bovine rhodopsin, and NhaA are stabilized by single energy barriers (44, 68, 69). In average, the transition state that separated the structural segments of these membrane proteins from their folded state was ∼0.4 nm (xu between 0.2 and 0.8 nm). Thus, it could be concluded that the structural segments had to be stretched by ∼0.4 nm to induce their cooperative unfolding. This short distance to the transition state leads to the assumption that rather short ranged inter- and intramolecular bonds had to be broken to induce unfolding and extraction of the structural segments of these membrane proteins. In contrast to this previous finding, the dynamic force spectra of substrate-free SteT were dominated by two linear regimes (Fig. 3, left column), which indicated that every structural segment of SteT was stabilized by two energy barriers. The two energy barriers of substrate-free SteT exhibited quite different characteristics. The inner energy barrier was located close to the native basin (xu between 0.21 and 0.36 nm), exhibited fast transition rates (k0 between 2.2 and 26.7 s−1), and caused a high structural rigidity as judged by the spring constants (κ between 1.06 and 2.84 N/m; Fig. 5 and Table 3). This indicates that the substrate-free SteT formed stiff and brittle structural segments that had been stabilized by short ranged localized and directional interactions. The fast transition rates, which lay above those measured for other membrane proteins (52, 68, 69), point toward a low kinetic stability of the structural segments. In contrast, the outer barrier was located far from the native basin (xu between 0.74 and 4.98 nm) and exhibited slower transition rates (k0 between 0.077 and 4.4·10−42 s−1; Fig. 5 and Table 3). Thus, the structural segments of SteT showed an altered mechanical behavior when crossing the outer barrier compared with traversing the inner barrier.
Evans and Ludwig (87) found two energy barriers at 0.7 and 1.2 nm when extracting biotinylated distearoylphosphatidylethanolamine from stearolyoleoylphosphatidylcholine bilayers. It was concluded that the hydrophobic core of the membrane forms a barrier against the extraction of the hydrophobic lipid tail. If the leaflet of a stearolyoleoylphosphatidylcholine membrane shows a ∼1.5-nm-thick hydrophobic region (88–90), the transition state of outer energy barrier (∼1.2 nm) correlates reasonably well with the estimated thickness of the hydrophobic core (87). The transition state position of the inner energy barrier (0.7 nm) was correlated with the position of the unsaturated bond in the oleoyl chain (87). Adapting this interpretation to membrane proteins, the relevant scale for hydrophobic interactions would approximate the thickness of the hydrophobic core of the lipid bilayer (∼2.5 nm for dimyristoylphosphatidylcholine (91)). Indeed the distance of the transition states obtained for the outer barriers of structural segments at 70, 147, 237, and 302 aa ranged between 2 and 3 nm. In contrast, the structural segments located at 79 and 422 aa showed higher xu values of ∼4.7 and ∼5.0 nm that exceeded the thickness of the lipidic hydrophobic core. However, it should be considered that TMHs of transporters, including APC superfamily members, can cross the membrane highly tilted (20, 22, 92). Tilted helices bury longer polypeptide stretches within the membrane and, therefore, may cause larger xu values. Thus, the narrow inner and the wide outer energy barriers observed for substrate-free SteT may characterize different unfolding processes. If this conclusion is correct, crossing the inner energy barrier may describe an unfolding step that has been induced by breaking specific short ranged interactions stabilizing the structural segments. Because the transition rate of the inner barrier is quite substantial it may be assumed that this barrier can be also crossed in the absence of a pulling force. In such a case the outer unfolding barrier would establish a system that protects complete unfolding of the structural segment. This outer barrier is kinetically much more stable compared with the kinetically instable inner barrier. It may be further assumed that the outer barrier is stabilized by longer ranged interactions compared with the inner barrier. However, applying a mechanical stress can force this structural segment to overcome its outer barrier to complete the unfolding process.
Substrate Binding Changes the Energy Landscape of SteT
To investigate how substrate binding changes the energy landscape of SteT, we conducted DFS in the presence of l-serine and l-threonine. First of all, the position of the stable structural segments did not seem to depend on the substrate binding, indicating that each structural segment unfolded independently and exhibited an intrinsic stability. However, comparison of the dynamic force spectra showed a dramatic change of the energy landscape. The inner and outer energy barriers observed for substrate-free SteT changed to only one energy barrier in the presence of substrate. Substrate binding created energy barriers with transition states that were located between those determined for the inner and outer energy barriers of substrate-free SteT.
Distances between ground state and transition state are a measure of the conformational flexibility that a folded structure can adopt within the constricting energy well (93, 94). Thus, the shift from narrow inner barriers of substrate-free SteT to wider energy barriers in the presence of substrate indicates an increased conformational flexibility of the structural segments of SteT. Because in the presence of l-serine or l-threonine every structural segment of SteT changes its mechanical properties to favor functionally related structural changes of the antiporter (Fig. 5 and Table 3), this structural flexibility may be required to allow substrate transport. The alternate substrate access of an antiporter from one to the other membrane surface only occurs in the substrate-bound state (95). Antiporters in the substrate-unbound state do not alternate access from one to the other membrane surface. Thus, the observed increased structural flexibility of SteT in the substrate-bound state reflects the increased probability of this state to alternate the substrate access from one to the other side of the membrane. In contrast, the substrate-free state of SteT is trapped in a more brittle and rigid conformation (Fig. 6). It is suggested that such restricted conformations favor the specific binding of substrates (96). Substrate binding also lowered the unfolding rate of structural segments of SteT (compare k0 values in Table 3). It can be concluded that substrate binding sets the structural segments into a deeper energy minimum (97) and, thus, kinetically stabilizes SteT (Equation 3; compare k0 and ΔG‡ values in Table 3). Studies on soluble proteins showed that ligand binding can increase the midpoint of thermal unfolding by several °C corresponding to stabilization of the protein (98).
FIGURE 6.

Energy landscape and mechanical properties of SteT changing upon substrate binding. In the absence of substrate (SteTfree) the inner energy barrier of SteT shows a narrow energy well exhibiting a low kinetic stability that determines a rigid and brittle structure. The second outer energy barrier of SteTfree is not shown. In presence of substrate (SteTbound) the two energy barriers stabilizing every structural segment of SteT fuse into one single energy barrier that provides SteT with very different mechanical and kinetic characteristics. The energy barrier of SteTbound is broad and shows an increased kinetic stability that shapes resilient and flexible structural segments of SteT.
Albeit l-serine and l-threonine are structurally similar and show similar side chain properties, the additional methylene group in l-threonine seems to affect the energy landscape of SteT to some extent. In the presence of l-threonine, the energy barriers of the first six segments of SteT showed increased distances to their transition state, lower unfolding rates, and lower spring constants (Table 3). The last structural segment, detected at a contour length of 422 aa, revealed a smaller xu and higher k0 and κ values in the presence of l-threonine compared with l-serine. Although the differences in xu values were not significant, the unfolding rate for three structural segments (highlighted in bold in Table 3) changed significantly, demonstrating differential effects of the substrates on SteT. Functional studies on l-serine transport by SteT unveiled a slightly higher stimulating effect for l-threonine than for l-serine (14), indicating unlike SteT-substrate interactions for l-serine and l-threonine.
Hammond-like Behavior Reflects Ground State Changes
According to Hammond's postulate (72) two similar structures should exhibit similar energies. For protein folding, this leads to correlation between the free energy of activation and the position of the transition state on the reaction coordinate (73). Recently DFS studies detected that the unfolding intermediates of bacteriorhodopsin at different temperatures and of different bacteriorhodopsin mutants show Hammond behavior (70, 76). Here we observed that the unfolding intermediates formed by the structural segments of SteT show Hammond-like behavior, i.e. the distance from the ground state to the transition state increased with the free energy of activation. In the context of dynamic energy landscapes (93, 97), Hammond behavior can be explained as follows. The DFS data show that the force peaks denoting the unfolding intermediates of SteT did not change their position upon substrate binding. Thus, we can conclude that substrate binding did not establish new strong localized interactions within SteT and did not change the unfolding intermediates of SteT. Nevertheless analysis of the DFS data showed that the distance between the energy minimum and the transition state changes along with the free energy of activation. At first sight, this Hammond behavior points toward stabilization of the folded state. As pointed out by Sánchez and Kiefhaber (74, 75) true Hammond behavior would require (structural) changes in the transition state, whereas the ground and unfolded states would remain structurally unaffected and retain their position on the energy landscape. Because DFS reveals the distance between transition state and ground state, a ground state shifting away from a stable transition state would show the same effect as true Hammond behavior. Indeed it was shown for soluble proteins that the transition state structure can be insensitive to changes in protein stability such as introduced by point mutations (74). Doubtless the ground state for SteT in the absence and presence of substrate will be different. Combined molecular dynamics/Monte Carlo simulations showed ligand binding to cause a shift in the most frequently populated protein conformations and, thus, to redistribute proteins to a deeper energy well that has been created in the energy landscape upon ligand binding (97). Consequently the observed correlation between xu and ΔG‡ for SteT would be attributed to changes in the ground state and does not reflect true Hammond behavior. The implication would be that small differences in the substrate, e.g. a slightly longer amino acid side chain, could significantly alter energetics and conformations of the antiporter.
Conclusions
Inter- and intramolecular interactions shape the energy landscape that describes the conformational flexibility and kinetic stability of proteins. Using SMFS, we investigated how substrate binding establishes interactions that modify the energy landscape of the serine/threonine antiporter SteT. Upon addition of substrate, SMFS could not detect large changes in the interactions that stabilized the structural segments of SteT. Therefore, we conclude that substrate binding of SteT is mediated by multiple weak interactions rather than by a few strongly localized interactions. Although individually weak, in summary these interactions change the energy landscape of all structural segments. However, to which extent substrate binding changes the energy barriers of individual structural segments remains intrinsic to the structural region itself (Table 3). From a structural point it appears hardly possible that the substrate interacts with all structural segments of the antiporter. Thus, it remains to be determined which of these interactions are mediated by direct interactions with the substrate and which ones result from indirect interactions.
In the absence of substrate, the energy landscape showed that every structural segment of SteT was stabilized by two very different energy barriers. The co-existence of two energy barriers indicated that the structural segments were stabilized by two different mechanisms. The first energy barrier was dominated by short range interactions that shaped a very narrow energy well and determined a short lifetime. As a result, these structures resemble brittle mechanical properties that were kinetically less stable. This kinetic instability suggests a considerable propensity of these structures to overcome the barrier stabilizing their conformational states in the absence of any applied force. Normally such a transition would lead to the unfolding of the structural segment. However, each structural segment of the antiporter establishes a second energy barrier that showed an extended transition state and increased kinetic stability. In contrast to the inner barrier this outer barrier may be dominated by longer ranged interactions.
In the presence of substrate, this complex energy landscape was significantly simplified, revealing a single energy barrier for every structural segment. Thus ligand binding shifted the structural segments into a new, deeper well on the energy landscape. Comparing the inner barriers of substrate-free SteT with the barriers of SteT in the presence of substrate, we could reveal that ligand binding kinetically stabilized SteT and changed its mechanical properties from a rigid and brittle structure to a more resilient and kinetically stable one (Fig. 6). Whereas rigid structural segments constrain the conformational flexibility and, thus, favor the specificity required for specific amino acid binding, the enhanced conformational flexibility may be required for the antiporters to allow substrate binding at the other membrane surface and to facilitate substrate translocation.
Supplementary Material
Acknowledgments
We thank Jonne Helenius and Alexej Kedrov for fruitful discussion.
This work was supported by the European Union, the Deutsche Forschungsgemeinschaft, the Berne University Research Foundation, the Swiss National Foundation for Scientific Research, and the Spanish Ministry of Science and Education.

The on-line version of this article (available at http://www.jbc.org) contains supplemental Figs. S1–S5.
- APC
- amino acid/polyamine/organocation
- aa
- amino acids
- AFM
- atomic force microscope
- DFS
- dynamic force spectroscopy
- F-D
- force-distance
- SMFS
- single molecule force spectroscopy
- SteT
- serine/threonine exchange transporter
- TMH
- transmembrane helix
- WLC
- wormlike chain
- LAT
- l-amino acid transporter
- N
- newtons
- pN
- piconewtons.
REFERENCES
- 1.Jack D. L., Paulsen I. T., Saier M. H., Jr. (2000) Microbiology 146, 1797–1814 [DOI] [PubMed] [Google Scholar]
- 2.Verrey F., Jack D. L., Paulsen I. T., Saier M. H., Jr., Pfeiffer R. (1999) J. Membr. Biol. 172, 181–192 [DOI] [PubMed] [Google Scholar]
- 3.Palacín M., Nunes V., Font-Llitjós M., Jiménez-Vidal M., Fort J., Gasol E., Pineda M., Feliubadaló L., Chillarón J., Zorzano A. (2005) Physiology 20, 112–124 [DOI] [PubMed] [Google Scholar]
- 4.Calonge M. J., Gasparini P., Chillarón J., Chillón M., Gallucci M., Rousaud F., Zelante L., Testar X., Dallapiccola B., Di Silverio F., Barceló P., Estivill X., Zorzano A., Nunes V., Palacín M. (1994) Nat. Genet. 6, 420–425 [DOI] [PubMed] [Google Scholar]
- 5.Feliubadaló L., Font M., Purroy J., Rousaud F., Estivill X., Nunes V., Golomb E., Centola M., Aksentijevich I., Kreiss Y., Goldman B., Pras M., Kastner D. L., Pras E., Gasparini P., Bisceglia L., Beccia E., Gallucci M., de Sanctis L., Ponzone A., Rizzoni G. F., Zelante L., Bassi M. T., George A. L., Jr., Manzoni M., De Grandi A., Riboni M., Endsley J. K., Ballabio A., Borsani G., Reig N., Fernández E., Estévez R., Pineda M., Torrents D., Camps M., Lloberas J., Zorzano A., Palacín M. (1999) Nat. Genet. 23, 52–57 [DOI] [PubMed] [Google Scholar]
- 6.Borsani G., Bassi M. T., Sperandeo M. P., De Grandi A., Buoninconti A., Riboni M., Manzoni M., Incerti B., Pepe A., Andria G., Ballabio A., Sebastio G. (1999) Nat. Genet. 21, 297–301 [DOI] [PubMed] [Google Scholar]
- 7.Torrents D., Mykkänen J., Pineda M., Feliubadaló L., Estévez R., de Cid R., Sanjurjo P., Zorzano A., Nunes V., Huoponen K., Reinikainen A., Simell O., Savontaus M. L., Aula P., Palacín M. (1999) Nat. Genet. 21, 293–296 [DOI] [PubMed] [Google Scholar]
- 8.Bassi M. T., Gasol E., Manzoni M., Pineda M., Riboni M., Martín R., Zorzano A., Borsani G., Palacín M. (2001) Pflugers Arch. 442, 286–296 [DOI] [PubMed] [Google Scholar]
- 9.Sato H., Tamba M., Ishii T., Bannai S. (1999) J. Biol. Chem. 274, 11455–11458 [DOI] [PubMed] [Google Scholar]
- 10.Baker D. A., McFarland K., Lake R. W., Shen H., Tang X. C., Toda S., Kalivas P. W. (2003) Nat. Neurosci. 6, 743–749 [DOI] [PubMed] [Google Scholar]
- 11.Sato H., Shiiya A., Kimata M., Maebara K., Tamba M., Sakakura Y., Makino N., Sugiyama F., Yagami K., Moriguchi T., Takahashi S., Bannai S. (2005) J. Biol. Chem. 280, 37423–37429 [DOI] [PubMed] [Google Scholar]
- 12.Fuchs B. C., Bode B. P. (2005) Semin. Cancer Biol. 15, 254–266 [DOI] [PubMed] [Google Scholar]
- 13.Gasol E., Jiménez-Vidal M., Chillarón J., Zorzano A., Palacín M. (2004) J. Biol. Chem. 279, 31228–31236 [DOI] [PubMed] [Google Scholar]
- 14.Reig N., del Rio C., Casagrande F., Ratera M., Gelpí J. L., Torrents D., Henderson P. J., Xie H., Baldwin S. A., Zorzano A., Fotiadis D., Palacín M. (2007) J. Biol. Chem. 282, 13270–13281 [DOI] [PubMed] [Google Scholar]
- 15.Sobczak I., Lolkema J. S. (2004) J. Biol. Chem. 279, 31113–31120 [DOI] [PubMed] [Google Scholar]
- 16.Ward A., Reyes C. L., Yu J., Roth C. B., Chang G. (2007) Proc. Natl. Acad. Sci. U.S.A. 104, 19005–19010 [DOI] [PMC free article] [PubMed] [Google Scholar]
- 17.Weyand S., Shimamura T., Yajima S., Suzuki S., Mirza O., Krusong K., Carpenter E. P., Rutherford N. G., Hadden J. M., O'Reilly J., Ma P., Saidijam M., Patching S. G., Hope R. J., Norbertczak H. T., Roach P. C., Iwata S., Henderson P. J., Cameron A. D. (2008) Science 322, 709–713 [DOI] [PMC free article] [PubMed] [Google Scholar]
- 18.Law C. J., Maloney P. C., Wang D. N. (2008) Annu. Rev. Microbiol. 62, 289–305 [DOI] [PMC free article] [PubMed] [Google Scholar]
- 19.Arkin I. T., Xu H., Jensen M. Ø., Arbely E., Bennett E. R., Bowers K. J., Chow E., Dror R. O., Eastwood M. P., Flitman-Tene R., Gregersen B. A., Klepeis J. L., Kolossváry I., Shan Y., Shaw D. E. (2007) Science 317, 799–803 [DOI] [PubMed] [Google Scholar]
- 20.Yernool D., Boudker O., Jin Y., Gouaux E. (2004) Nature 431, 811–818 [DOI] [PubMed] [Google Scholar]
- 21.Hollenstein K., Dawson R. J., Locher K. P. (2007) Curr. Opin. Struct. Biol. 17, 412–418 [DOI] [PubMed] [Google Scholar]
- 22.Yamashita A., Singh S. K., Kawate T., Jin Y., Gouaux E. (2005) Nature 437, 215–223 [DOI] [PubMed] [Google Scholar]
- 23.Hu Y., Fan C. P., Fu G., Zhu D., Jin Q., Wang D. C. (2008) J. Mol. Biol. 382, 99–111 [DOI] [PubMed] [Google Scholar]
- 24.Uchino H., Kanai Y., Kim D. K., Wempe M. F., Chairoungdua A., Morimoto E., Anders M. W., Endou H. (2002) Mol. Pharmacol. 61, 729–737 [DOI] [PubMed] [Google Scholar]
- 25.Binnig G., Quate C. F., Gerber C. (1986) Phys. Rev. Lett. 56, 930–933 [DOI] [PubMed] [Google Scholar]
- 26.Engel A., Gaub H. E. (2008) Annu. Rev. Biochem. 77, 127–148 [DOI] [PubMed] [Google Scholar]
- 27.Müller D. J., Engel A. (2007) Nat. Protoc. 2, 2191–2197 [DOI] [PubMed] [Google Scholar]
- 28.Muller D. J. (2008) Biochemistry 47, 7986–7998 [DOI] [PubMed] [Google Scholar]
- 29.Fisher T. E., Marszalek P. E., Fernandez J. M. (2000) Nat. Struct. Biol. 7, 719–724 [DOI] [PubMed] [Google Scholar]
- 30.Ludwig T., Kirmse R., Poole K., Schwarz U. S. (2008) Pflugers Arch. 456, 29–49 [DOI] [PubMed] [Google Scholar]
- 31.Helenius J., Heisenberg C. P., Gaub H. E., Muller D. J. (2008) J. Cell Sci. 121, 1785–1791 [DOI] [PubMed] [Google Scholar]
- 32.Florin E. L., Moy V. T., Gaub H. E. (1994) Science 264, 415–417 [DOI] [PubMed] [Google Scholar]
- 33.Lee G. U., Kidwell D. A., Colton R. J. (1994) Langmuir 10, 354–357 [Google Scholar]
- 34.Lee G. U., Chrisey L. A., Colton R. J. (1994) Science 266, 771–773 [DOI] [PubMed] [Google Scholar]
- 35.Dammer U., Hegner M., Anselmetti D., Wagner P., Dreier M., Huber W., Güntherodt H. J. (1996) Biophys. J. 70, 2437–2441 [DOI] [PMC free article] [PubMed] [Google Scholar]
- 36.Rief M., Gautel M., Oesterhelt F., Fernandez J. M., Gaub H. E. (1997) Science 276, 1109–1112 [DOI] [PubMed] [Google Scholar]
- 37.Benoit M., Gabriel D., Gerisch G., Gaub H. E. (2000) Nat. Cell Biol. 2, 313–317 [DOI] [PubMed] [Google Scholar]
- 38.Kedrov A., Janovjak H., Sapra K. T., Müller D. J. (2007) Annu. Rev. Biophys. Biomol. Struct. 36, 233–260 [DOI] [PubMed] [Google Scholar]
- 39.Oesterhelt F., Oesterhelt D., Pfeiffer M., Engel A., Gaub H. E., Müller D. J. (2000) Science 288, 143–146 [DOI] [PubMed] [Google Scholar]
- 40.Bell G. I. (1978) Science 200, 618–627 [DOI] [PubMed] [Google Scholar]
- 41.Evans E. (1998) Faraday Discuss. 111, 1–16 [DOI] [PubMed] [Google Scholar]
- 42.Evans E., Ritchie K. (1997) Biophys. J. 72, 1541–1555 [DOI] [PMC free article] [PubMed] [Google Scholar]
- 43.Dietz H., Berkemeier F., Bertz M., Rief M. (2006) Proc. Natl. Acad. Sci. U.S.A. 103, 12724–12728 [DOI] [PMC free article] [PubMed] [Google Scholar]
- 44.Sapra K. T., Park P. S., Palczewski K., Muller D. J. (2008) Langmuir 24, 1330–1337 [DOI] [PMC free article] [PubMed] [Google Scholar]
- 45.Butt H. J., Jaschke M. (1995) Nanotechnology 6, 1–7 [Google Scholar]
- 46.Florin E. L., Rief M., Lehmann H., Ludwig M., Dornmair C., Moy V. T., Gaub H. E. (1995) Biosens. Bioelectron. 10, 895–901 [Google Scholar]
- 47.Fotiadis D., Scheuring S., Müller S. A., Engel A., Müller D. J. (2002) Micron 33, 385–397 [DOI] [PubMed] [Google Scholar]
- 48.Yu J., Bippes C. A., Hand G. M., Muller D. J., Sosinsky G. E. (2007) J. Biol. Chem. 282, 8895–8904 [DOI] [PubMed] [Google Scholar]
- 49.Müller D. J., Kessler M., Oesterhelt F., Möller C., Oesterhelt D., Gaub H. (2002) Biophys. J. 83, 3578–3588 [DOI] [PMC free article] [PubMed] [Google Scholar]
- 50.Kedrov A., Ziegler C., Janovjak H., Kühlbrandt W., Müller D. J. (2004) J. Mol. Biol. 340, 1143–1152 [DOI] [PubMed] [Google Scholar]
- 51.Cisneros D. A., Oesterhelt D., Müller D. J. (2005) Structure 13, 235–242 [DOI] [PubMed] [Google Scholar]
- 52.Sapra K. T., Park P. S., Filipek S., Engel A., Müller D. J., Palczewski K. (2006) J. Mol. Biol. 358, 255–269 [DOI] [PubMed] [Google Scholar]
- 53.Cisneros D. A., Oberbarnscheidt L., Pannier A., Klare J. P., Helenius J., Engelhard M., Oesterhelt F., Muller D. J. (2008) Structure 16, 1206–1213 [DOI] [PubMed] [Google Scholar]
- 54.Kessler M., Gaub H. E. (2006) Structure 14, 521–527 [DOI] [PubMed] [Google Scholar]
- 55.Bustamante C., Marko J. F., Siggia E. D., Smith S. (1994) Science 265, 1599–1600 [DOI] [PubMed] [Google Scholar]
- 56.Janovjak H., Struckmeier J., Müller D. J. (2005) Eur. Biophys. J. 34, 91–96 [DOI] [PubMed] [Google Scholar]
- 57.Schlierf M., Rief M. (2005) J. Mol. Biol. 354, 497–503 [DOI] [PubMed] [Google Scholar]
- 58.Dietz H., Rief M. (2004) Proc. Natl. Acad. Sci. U.S.A. 101, 16192–16197 [DOI] [PMC free article] [PubMed] [Google Scholar]
- 59.Bieri O., Wirz J., Hellrung B., Schutkowski M., Drewello M., Kiefhaber T. (1999) Proc. Natl. Acad. Sci. U.S.A. 96, 9597–9601 [DOI] [PMC free article] [PubMed] [Google Scholar]
- 60.Krieger F., Fierz B., Bieri O., Drewello M., Kiefhaber T. (2003) J. Mol. Biol. 332, 265–274 [DOI] [PubMed] [Google Scholar]
- 61.Gräter F., Grubmüller H. (2007) J. Struct. Biol. 157, 557–569 [DOI] [PubMed] [Google Scholar]
- 62.Howard J. (2001) Mechanics of Motor Proteins and the Cytoskeleton, pp. 9–28, Sinauer Associates, Sunderland, MA [Google Scholar]
- 63.Bosshart P. D., Casagrande F., Frederix P. L., Ratera M., Bippes C. A., Muller D. J., Palacin M., Engel A., Fotiadis D. (2008) Nanotechnology 19, 384014 [DOI] [PubMed] [Google Scholar]
- 64.Käll L., Krogh A., Sonnhammer E. L. (2007) Nucleic Acids Res. 35, W429–432 [DOI] [PMC free article] [PubMed] [Google Scholar]
- 65.McGuffin L. J., Bryson K., Jones D. T. (2000) Bioinformatics 16, 404–405 [DOI] [PubMed] [Google Scholar]
- 66.Carrion-Vazquez M., Oberhauser A. F., Fowler S. B., Marszalek P. E., Broedel S. E., Clarke J., Fernandez J. M. (1999) Proc. Natl. Acad. Sci. U.S.A. 96, 3694–3699 [DOI] [PMC free article] [PubMed] [Google Scholar]
- 67.Williams P. M., Fowler S. B., Best R. B., Toca-Herrera J. L., Scott K. A., Steward A., Clarke J. (2003) Nature 422, 446–449 [DOI] [PubMed] [Google Scholar]
- 68.Janovjak H., Struckmeier J., Hubain M., Kedrov A., Kessler M., Müller D. J. (2004) Structure 12, 871–879 [DOI] [PubMed] [Google Scholar]
- 69.Kedrov A., Appel M., Baumann H., Ziegler C., Muller D. J. (2008) J. Mol. Biol. 375, 1258–1266 [DOI] [PubMed] [Google Scholar]
- 70.Sapra K. T., Balasubramanian G. P., Labudde D., Bowie J. U., Muller D. J. (2008) J. Mol. Biol. 376, 1076–1090 [DOI] [PMC free article] [PubMed] [Google Scholar]
- 71.Sapra K. T., Doehner J., Renugopalakrishnan V., Padrós E., Muller D. J. (2008) Biophys. J. 95, 3407–3418 [DOI] [PMC free article] [PubMed] [Google Scholar]
- 72.Hammond G. S. (1955) J. Am. Chem. Soc. 77, 334–338 [Google Scholar]
- 73.Matouschek A., Fersht A. R. (1993) Proc. Natl. Acad. Sci. U.S.A. 90, 7814–7818 [DOI] [PMC free article] [PubMed] [Google Scholar]
- 74.Sánchez I. E., Kiefhaber T. (2003) J. Mol. Biol. 327, 867–884 [DOI] [PubMed] [Google Scholar]
- 75.Sánchez I. E., Kiefhaber T. (2003) Biophys. Chem. 100, 397–407 [DOI] [PubMed] [Google Scholar]
- 76.Janovjak H., Knaus H., Muller D. J. (2007) J. Am. Chem. Soc. 129, 246–247 [DOI] [PubMed] [Google Scholar]
- 77.Dill K. A., Bromberg S., Yue K., Fiebig K. M., Yee D. P., Thomas P. D., Chan H. S. (1995) Protein Sci. 4, 561–602 [DOI] [PMC free article] [PubMed] [Google Scholar]
- 78.Dill K. A., Chan H. S. (1997) Nat. Struct. Biol. 4, 10–19 [DOI] [PubMed] [Google Scholar]
- 79.Wolynes P. G., Onuchic J. N., Thirumalai D. (1995) Science 267, 1619–1620 [DOI] [PubMed] [Google Scholar]
- 80.Sanders C. R., Nagy J. K. (2000) Curr. Opin. Struct. Biol. 10, 438–442 [DOI] [PubMed] [Google Scholar]
- 81.Klyszejko A. L., Shastri S., Mari S. A., Grubmüller H., Muller D. J., Glaubitz C. (2008) J. Mol. Biol. 376, 35–41 [DOI] [PubMed] [Google Scholar]
- 82.Kedrov A., Wegmann S., Smits S. H., Goswami P., Baumann H., Muller D. J. (2007) J. Struct. Biol. 159, 290–301 [DOI] [PubMed] [Google Scholar]
- 83.Kedrov A., Krieg M., Ziegler C., Kuhlbrandt W., Muller D. J. (2005) EMBO Rep. 6, 668–674 [DOI] [PMC free article] [PubMed] [Google Scholar]
- 84.Inoue H., Noumi T., Tsuchiya T., Kanazawa H. (1995) FEBS Lett. 363, 264–268 [DOI] [PubMed] [Google Scholar]
- 85.Soksawatmaekhin W., Uemura T., Fukiwake N., Kashiwagi K., Igarashi K. (2006) J. Biol. Chem. 281, 29213–29220 [DOI] [PubMed] [Google Scholar]
- 86.Lolkema J. S., Slotboom D. J. (2008) Mol. Membr. Biol. 25, 567–570 [DOI] [PubMed] [Google Scholar]
- 87.Evans E., Ludwig F. (2000) J. Phys. Condens. Matter 12, A315–320 [Google Scholar]
- 88.Allende D., Simon S. A., McIntosh T. J. (2005) Biophys. J. 88, 1828–1837 [DOI] [PMC free article] [PubMed] [Google Scholar]
- 89.Aranda-Espinoza H., Bermudez H., Bates F. S., Discher D. E. (2001) Phys. Rev. Lett. 87, 208301 [DOI] [PubMed] [Google Scholar]
- 90.Rawicz W., Olbrich K. C., McIntosh T., Needham D., Evans E. (2000) Biophys. J. 79, 328–339 [DOI] [PMC free article] [PubMed] [Google Scholar]
- 91.Gruszecki W. I., Sielewiesiuk J. (1990) Biochim. Biophys. Acta 1023, 405–412 [DOI] [PubMed] [Google Scholar]
- 92.Casagrande F., Ratera M., Schenk A. D., Chami M., Valencia E., Lopez J. M., Torrents D., Engel A., Palacin M., Fotiadis D. (2008) J. Biol. Chem. 283, 33240–33248 [DOI] [PMC free article] [PubMed] [Google Scholar]
- 93.Kumar S., Ma B., Tsai C. J., Sinha N., Nussinov R. (2000) Protein Sci. 9, 10–19 [DOI] [PMC free article] [PubMed] [Google Scholar]
- 94.Oliveberg M., Wolynes P. G. (2005) Q. Rev. Biophys. 38, 245–288 [DOI] [PubMed] [Google Scholar]
- 95.West I. C. (1997) Biochim. Biophys. Acta 1331, 213–234 [DOI] [PubMed] [Google Scholar]
- 96.Tsai C. J., Kumar S., Ma B., Nussinov R. (1999) Protein Sci. 8, 1181–1190 [DOI] [PMC free article] [PubMed] [Google Scholar]
- 97.Okazaki K., Takada S. (2008) Proc. Natl. Acad. Sci. U.S.A. 105, 11182–11187 [DOI] [PMC free article] [PubMed] [Google Scholar]
- 98.Prajapati R. S., Indu S., Varadarajan R. (2007) Biochemistry 46, 10339–10352 [DOI] [PubMed] [Google Scholar]
- 99.Li L., Huang H. H., Badilla C. L., Fernandez J. M. (2005) J. Mol. Biol. 345, 817–826 [DOI] [PubMed] [Google Scholar]
- 100.Oberhauser A. F., Hansma P. K., Carrion-Vazquez M., Fernandez J. M. (2001) Proc. Natl. Acad. Sci. U.S.A. 98, 468–472 [DOI] [PMC free article] [PubMed] [Google Scholar]
- 101.Oberhauser A. F., Marszalek P. E., Carrion-Vazquez M., Fernandez J. M. (1999) Nat. Struct. Biol. 6, 1025–1028 [DOI] [PubMed] [Google Scholar]
- 102.Peng Q., Li H. (2008) Proc. Natl. Acad. Sci. U.S.A. 105, 1885–1890 [DOI] [PMC free article] [PubMed] [Google Scholar]
Associated Data
This section collects any data citations, data availability statements, or supplementary materials included in this article.