

Abstract
Cells store excess energy in the form of cytoplasmic lipid droplets. At present, it is unclear how different types of fatty acids contribute to the formation of lipid-droplets. We describe a compound Raman microscope capable of both high-speed chemical imaging and quantitative spectral analysis on the same platform. We use a picosecond laser source to perform coherent Raman scattering imaging of a biological sample and confocal Raman spectral analysis at points of interest. The potential of the compound Raman microscope is evaluated on lipid bodies of cultured cells and live animals. Our data indicate that the in vivo fat contains much more unsaturated fatty acids (FAs) than the fat formed via de novo synthesis in 3T3-L1 cells. Furthermore, in vivo analysis of subcutaneous adipocytes and glands revealed a drastic difference not only in the unsaturation level but also in the thermodynamic state of FAs inside their lipid bodies. Additionally, the compound Raman microscope allows tracking the cellular uptake of a specific fatty acid and its abundance in nascent cytoplasmic lipid droplets. The high-speed vibrational imaging and spectral analysis capability renders compound Raman microscopy an indispensible analytical tool to the studies of lipid-droplet biology.
Keywords: coherent anti-Stokes Raman scattering microscopy, stimulated Raman scattering, confocal Raman, lipid droplet, vibrational imaging
Introduction
Obesity is an established risk factor for type II diabetes, hypertension, strokes, many types of cancer, atherosclerosis, and other diseases 1,2. A central goal of obesity studies is to understand how cells store excess energy in the form of cytoplasmic lipid droplets (LDs) 3. As lipid synthesis and storage pathways are conserved among many organisms, cell model systems derived from simple organisms have been employed to bring insight into the cause of obesity in humans 4. Using a murine fibroblast-derived 3T3-L1 cell line developed by Green and Kehinde, the transcriptional regulation of fat cell differentiation has been well-elucidated 4,5. In recent years, a number of lipid binding proteins have been identified and their functions in LD formation and mobilization have been characterized 6. Furthermore, genome-wide RNA interference screen in Drosophila S2 cells has revealed a role of phospholipid synthesis in regulating LD size, number, and morphology 7. Nonetheless, significant details on the biology of LDs are still lacking 6,8. Currently, it is not clearly understood how different types of phospholipids or fatty acids contribute to the formation of LDs. Consequently, nutritional intervention of obesity is largely based on restriction of calorie uptake. Effective obesity intervention based on dietary composition is not yet possible due to a lack of understanding on the roles of nutritional ingredients in LD formation.
Until recently, the studies of lipid-droplet biology have been relying on non-specific, invasive, or population measurements. Traditionally, intracellular LDs are visualized based on the fluorescence of lipophilic dyes such as Oil red O (ORO) or Nile red 5,9. The use of ORO in particular requires cell fixation which prevents dynamic study of LD mobilization and has also been shown to fuse LDs 10. More importantly, because most lipid or fatty acid (FA) molecules have no known specific markers, the fluorescence signals from ORO or Nile red contain no information regarding lipid composition or organization. To analyze the composition of LDs, standard techniques including gas chromatography, liquid chromatography, and mass spectrometry have been employed. While such analytical techniques are powerful, they only provide population average information.
Recent advances in vibrational imaging are opening up exciting opportunities for dynamic, non-invasive, and compositional analysis of single LDs. Confocal Raman microscopy allowed visualization of arachidonic acids in LDs inside leukocytes 11. However, long acquisition time on the order of seconds per pixel restricts the use of Raman microscopy to relatively static samples. To increase the vibrational signal level without additional labeling, coherent anti-Stokes Raman scattering (CARS) microscopy has been developed 12 and employed to visualize lipid-rich structures at the speed of a few μs per pixel or 1 s per frame on a laser-scanning microscope platform13-15. The large CARS signal is produced by quadratic dependence on the concentration of molecular vibration in the focal volume and by spectrally focusing all laser energy into a single Raman band such as the CH2 symmetric stretch mode with picosecond (ps) pulse excitation. Such single-frequency CARS microscopy has been employed to monitor LD formation and mobilization in live cells and C. elegans 10,16-18. A drawback of single-frequency CARS microscopy is its lack of spectral information. Multiplex CARS (M-CARS) microscopy using broadband pulses has been devised to overcome this shortcoming 19,20 and has been recently applied to study the level of fatty acid saturation as well as the thermodynamic state of LDs in fixed 3T3-L1 cells 21. Compared to Raman microscopy, the vibrational signal in M-CARS is enhanced via mixing with the non-resonant background and can be extracted by the maximum entropy method 21. However, compared to single-frequency CARS, the M-CARS signal is significantly weaker because the excitation energy is spread over a broad spectral window. Consequently, M-CARS has reduced sensitivity and requires minutes to obtain an image of 100×100 pixels 21. Such acquisition speed precludes its application to analysis of highly dynamic features such as live cells.
During the development of CARS microscopy, we came to realize that coherent Raman and spontaneous Raman techniques are inherently complementary to each other: Coherent Raman scattering permits high-speed vibrational imaging by using ps pulses to focus the excitation energy on a single Raman band 22; Spontaneous Raman scattering is inherently multiplex, background-free, and allows fast spectral analysis at a specified location. We demonstrate herein a compound Raman microscope that implements high-speed coherent Raman imaging of a biological sample and confocal Raman spectral analysis at points of interest using a ps laser source. With the capability of vibrational imaging and spectral analysis within a few seconds, the compound Raman microscope is applied to analyze the LDs in cultured Chinese ovary hamster (CHO) and 3T3-L1 cells, and subcutaneous adipocytes and sebaceous glands in a living BALB/c mouse.
Experimental Methods
Compound Raman microscopy
Two synchronized 5-ps, 80 MHz, laser oscilators (Tsunami, Spectra-Physics Lasers Inc., Mountain view, CA) are temporally synchronized and collinearly combined into a laser-scanning inverted microscope (FV300+IX71, Olympus Inc, Central Valley, PA) (Fig.1a). The laser is focused into the sample using 40x (numerical aperture, NA=0.80, LUMPlanFI/IR, Olympus) or 60x (NA=1.2, UPlanApo/IR, Olympus) water-immersion objectives. The CARS signals are detected by photomultiplier tube detectors (H7422-40, Hamamatsu, Japan) in either forward (F-CARS) or backward (E-CARS) directions. The F-CARS signal is collected by an air condenser (NA=0.55), while the epi-detected E-CARS signal is collected by the same water immersion objectives. Confocal Raman microspectroscopy is realized by mounting a spectrometer (Shamrock SR-303i-A, Andor Technology, Belfast, UK) to the side port of the microscope. The spectrometer is externally triggered by a point-scan signal from the scanner. To achieve 3D spatial resolution the spectrometer slit assembly is replaced with a pinhole of 100-μm diameter. For CARS imaging and Raman spectra measurements of LDs, the pump and Stokes lasers are tuned to 707 nm or 14140 cm-1 and 885 nm or 11300 cm-1, respectively, to be in resonance with the CH2 symmetric stretch vibration. After acquisition of a CARS image using the signal from the CH2 vibration, the Stokes beam is blocked and the long-pass dichroic mirror (670dcxr, Chroma Technology Corp, Rockingham, VT) in the turret for E-CARS imaging is switched to a short-pass dichroic mirror (720dcsp, Chroma) which directs the Raman signal toward the spectrometer. The utilization of the same ps laser for both CARS imaging and confocal Raman spectrometry eliminates the need for any spatial calibration.
Figure 1. Layout and performance of the compound Raman microscope.
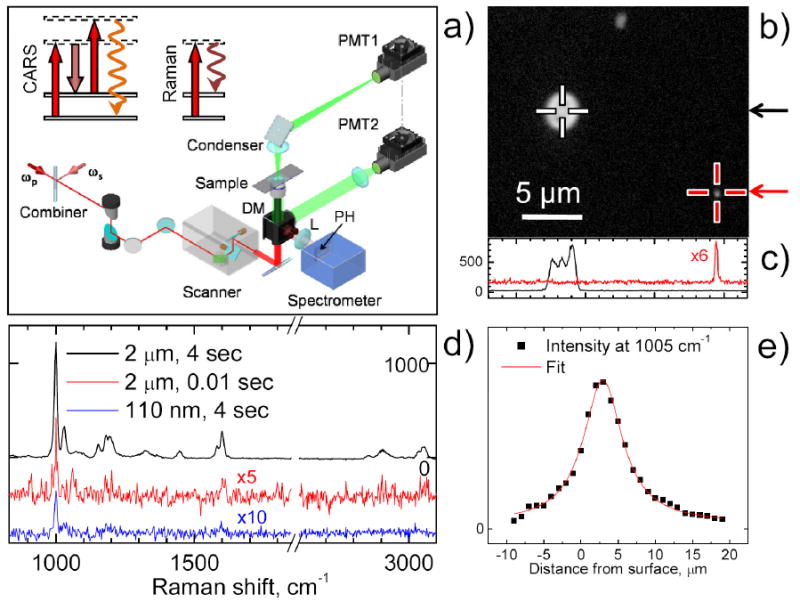
(a) Optical layout and diagrams for CARS and spontaneous Raman scattering. ωp and ωs are pump and Stokes laser beams, respectively, DM is an exchangeable dichroic mirror, L is an achromatic lens of 100 mm focal length, PH is a 100-μm pinhole. PMT1 and PMT2 are photomultiplier tubes for forward and backward (epi) detection, respectively. In the CARS and Raman diagrams, the solid horizontal lines represent ground and vibrationally excited states. The dashed horizontal lines represent virtual levels. The red and dark red arrows correspond to the pump and Stokes laser beams, respectively. The wavy arrows stand for emitted signals. (b) Epi-detected CARS image of a mixture of PS beads of 2.2 μm and 110 nm diameter taken with a 60x W/IR objective (Olympus) and average pump and Stokes powers of 10 mW and 15 mW at the sample position. The total integration time per pixel is 150 μs. Crosses indicate positions where the confocal Raman point scan was performed. (c) Intensity profiles along the lines indicated by arrows in panel (b). (d) Raman spectrum obtained from the two PS beads in panel (b) at different acquisition modes and 3 mW of pump laser at the sample position. For clarity the middle and bottom spectra are offset and multiplied by factor 5 and 10, respectively. The PS beads were dried on a fused silica coverslip to reduce the fluorescence background. (e) Intensity profile showing the depth resolution of confocal Raman measurement.
The Raman signal is filtered from the scattered light using a band-pass filter and focused into the pinhole using an achromatic lens of 100 mm focal length. The spectrometer is equipped with a 300 g/mm 500 nm blaze angle grating and a TE cooled back-illuminated EMCCD (Newton DU970N-BV, Andor). Our current setting permits spectral analysis in a wide range from 830 cm-1 to 3100 cm-1, which covers both the fingerprint and the CH-stretch vibration regions. The EMCCD is cooled to -70° C to minimize dark current noise. Additionally the EMCCD is used in a crop mode to collect signal only from 20 rows to further decrease the noise because the light from the entrance pinhole illuminates only a small portion of rows on EMCCD. The cropping mode also decreases the EMCCD signal processing time and maximizes the repetition rate. For sample preparation, fused silica coverslips are used instead of standard borosilicate glass coverslips to minimize the substrate fluorescence background. The interferometric intensity modulation caused by the back-illuminated EMCCD and the fluorescence background are removed by data processing (see Fig. S1 in Supporting Information).
Due to the space limitation in the scanning unit, we have placed the spectrometer in a non-descanned port of the microscope. To maximize the efficiency of confocal detection, we have used a micro-positioning translational stage to position the point of interest to the center of the field of view for Raman spectral analysis.
For SRS imaging, a Pockel Cell (360-80, Con-optics, Danbury, CT) is inserted in the pump beam for intensity modulation at 1.0 MHz. A 60x dipping water objective (1.1 NA, LUMFI, Olympus) is used instead of air condencer (0.55 NA) to collect the forward pump and Stokes beams in order to minimize the thermal lensing effect. The Stokes beam is selected by bandpass filters and detected by a large area photodiode (DET100A, Thorlabs, Newton, NJ). A Lock-in amplifier (SR844, Standord Research Systems, Sunnyvale, CA) is used for phase-sensitive detection of the Raman gain signal at a time constant of 100 μs.
De novo lipid synthesis in 3T3-L1 cells
De novo lipid synthesis was induced using an adipogenesis assay kit (Cat. No. ECM 950, Chemicon International). 3T3-L1 cells were grown to confluence in DMEM media consisting of 25 mM of glucose supplemented with 10% calf serum and penicillin/streptomycin. On day 0, the cells were induced with the initiation media composed of 0.5 μM IBMX and 1 μM dexamethasone in DMEM media supplemented with 10% fetal calf serum and penicillin (100 units/ml) / streptomycin (100 μg/ml). On day 2, the initiation media was replaced with the progression media composed of 10 μg/ml insulin in DMEM media supplemented with 10% fetal calf serum and penicillin/streptomycin. On day 4, the progression media was replaced with the maintenance media (DMEM supplemented with 10% fetal calf serum and penicillin/streptomycin). From day 4 to day 14, the cells were kept in maintenance media with new maintenance media being replaced by every two days. Cells were incubated at 37°C with 5% CO2.
Results and Discussion
Characterization of spatial resolution and spectral sensitivity
We first evaluated the performance of our setup using polystyrene (PS) beads of known diameters. Single PS bead of 2.2 μm and 110 nm in diameter spread on a coverslip were first visualized by epi-detected CARS (Fig. 1b). The CARS intensity profiles cross the beads are displayed in Figure 1c. The lateral full-width-at-half-maximum (FWHM) resolution is 230 nm for the 110 nm PS bead, which is smaller than the 300 nm (FWHM) Airy disk calculated from the wavelength of the pump beam and assuming NA=1.2 for the objective. The confocal Raman spectra of the PS beads were obtained using two acquisition modes of the EMCCD. Firstly, we acquired the Raman spectra of the PS beads in 4 s with the CCD in conventional mode and a 50 kHz readout speed. For the ring breathing band at 1005 cm-1, the signal-to-noise ratio for the 2.2 μm and 110 nm PS beads is 100 and 6, respectively (Fig. 1d). Secondly, we measured the spectrum of the 2 μm PS bead with the EMCCD in the electro-multiplying regime at a 2.5 MHz readout speed and 10 ms acquisition time. The resulting spectrum exhibits a signal-to-noise ratio of 3 (Fig. 1d). Furthermore, we evaluated the depth resolution of the confocal Raman spectrometer by obtaining spectra of a 2.2 μm PS bead at different depths. The intensities of the 1005 cm-1 peak were fitted with a Lorentzian function, which yielded an axial FWHM of 6.4 μm. The depth resolution was further confirmed by the nearly linear dependence of the Raman spectral intensity on the diameter for LDs smaller than 10 μm (Fig. S2). The above data demonstrate the ability of compound Raman microscopy to provide high-sensitivity CARS imaging and confocal Raman spectral analysis of a point-of-interest in the milliseconds to seconds time scale.
Compound Raman analysis of single LDs within live cells
To build the foundation for quantitative analysis of LDs, we first employed our setup to obtain Raman spectra of pure esterified fatty acids. We tested three fatty acid (FA) species: saturated palmitic acid (C16:0), monounsaturated oleic acid (C18:1), and polyunsaturated linoleic acid (C18:2). The palmitic acid was tested in a gel state at room temperature of 23 °C and in a liquid state at 50 °C. Full spectral assignment of fatty acids is summarized in Table S1. Since the peak intensity of CH2 deformation band at 1445 cm-1 has nearly no dependence on the number of unsaturated C=C bonds, it is used as an internal reference for quantitative analysis. When normalized by the intensity of the 1445 cm-1 peak (I1445), several distinctive spectral features among the different fatty acids can be discerned (Fig. 2a). The most prominent difference is observed at the 1654 cm-1 peak which corresponds to the C=C stretching vibration. The 1654 cm-1 band is absent in the saturated palmitic acid (I1654/I1445 = 0), present at low intensity for the monounsaturated oleic acid (I1654/I1445 = 0.58), and present at high intensity for the polyunsaturated linoleic acid (I1654/I1445 = 1.27). Another distinctive feature is observed at the 2935 cm-1 peak which corresponds to the CH3 symmetric stretch and is enhanced by Fermi resonance in ordered packing 23. Correspondingly, using the CH2 stretching band at 2850 cm-1 as a reference, the 2935 cm-1 peak is significantly higher in the gel state than in the liquid state for the saturated palmitic acid (Fig. 2a).
Figure 2. Raman spectra of fatty acids and compound Raman analysis of LDs in CHO cells.

(a) Raman spectra of linoleic methyl ester (LE), oleic methyl ester (OE), palmitic methyl ester (PE) in liquid state at 50° C, and palmitic methyl ester (PE) in gel state at room temperature, top to bottom respectively. (b-c) F-CARS image of CHO cells incubated for 0 and 6 h in medium contained 500 μM of oleic FA. Each image is a stack of four 512×512 pixels images with 1.0 μm depth separation acquired at the speed of 10 μs/pixel. The CARS images were obtained using a 60x IR objective (Olympus), 10 mW of pump and 15 mW of Stokes at the sample. The crosses numbered 1 to 3 indicate the position where Raman point scans were performed. (d) The obtained Raman spectra from three LDs marked in panel (c) together with differences shown in green. The difference spectra are offset for clarity. (e) Confocal Raman spectrum of LD #1 from panel (c) together with the spectrum of pure oleic FA. Both spectra are normalized on the CH2 deformation band around 1445 cm-1. The acquisition time for each Raman spectrum in panels (d) and (e) is 4 s.
With the above data, we applied compound Raman microscopy to monitor the uptake and storage of oleic acid by CHO cells incubated with 500 μM oleic acid for 6 h. Using CARS imaging at the speed of 10 μs/pixel, we visualized numerous cytoplasmic LDs with varying diameters up to 1.5 μm (Fig. 2c) compare to the few smaller-in-diameter LDs in untreated CHO cells (Fig. 2b). Three LDs (Fig. 2c) within a CHO cell were analyzed and their Raman spectra are displayed in Fig. 2d. For the 1445 cm-1 peak, the Raman spectra of lipid droplets acquired in 4 s have a signal-to-noise ratio of 30. The Raman spectra of cytoplasmic LDs are identical to each other (Fig. 2d) and resemble the spectrum of pure oleic FA in solution (Fig. 2e). However, a few distinctive spectral features between the LDs and oleic FA are observed. First, the LD spectra exhibit a higher intensity of the =CH deformation band at 1265 cm-1 and of the C=C stretching band at 1654 cm-1, indicating a higher level of unsaturation per chain as compared to the oleic FA. This result agrees with the fact that exogenous fatty acids may be desaturated and elongated in cells before being stored in cytoplasmic LDs. Second, only the LD spectra exhibit peaks at 1742 cm-1, which is assigned to the C=O carbonyl stretching vibration and is present in the ester forms of FAs (Fig. 2a). This spectral feature strongly suggests the conversion of free FA into the esterified form, possibly into triglyceride which is the dominant component of LDs. Together, these data demonstrates the capability of compound Raman microscopy for fast CARS imaging and full Raman spectral analysis of single LDs within the time scale of a few seconds.
Analysis of endogenous and exogenous FAs within single LDs
Using LDs accumulated in 3T3-L1 cells (Supplemental materials, Fig. S3), we evaluated the capability of compound Raman microscopy in resolving the contribution of endogenous and exogenous FAs within single LDs. First, we have analyzed the LDs formed through de novo lipid synthesis (Fig. 3a-b). The Raman spectrum showed peaks similar in frequences to that of FAs (Fig. 2a). When we supplemented predifferentiated 3T3-L1 cells with 50 μM of deuterated palmitic acids for 4 days (Fig. 3c) and repeated Raman analysis. We observed in all LDs a distinctive peak around 2100 cm-1 which corresponds to the C-D stretching vibration (Fig. 3d). The integral intensity of the C-D (IC-D) and C-H (IC-H) stretching bands were measured to indicate the fraction of exogenous and endogenous FAs in the LD. In order to account for the different Raman cross sections and instrument sensitivity for CD and CH vibrations we recorded Raman spectrum of mixture of 1:9 (molar) d31-palmitic FA and oleic FA at 50 °C and obtained the IC-D/IC-H ratio of 0.185. From the calibrated value of IC-D/(IC-D + IC-H) we find that exogenous FAs constitute 19% of total lipid in the probed volume. For comparison, we supplied undifferentiated 3T3-L1 with 50 μM of deuterated palmitic acid for 4 days (Fig. 3e). Because de novo lipid synthesis was not stimulated, we anticipated that the source of FAs in LDs in 3T3-L1 cells would be dominated by exogenous palmitic acid. Correspondingly, we observed the IC-D/(IC-D + IC-H) value of 0.70 which suggests a 70% composition of exogenous fatty acids (Fig. 3f). These results demonstrate that compound Raman microscopy can distinguish the origin of FA species within single LDs. Our data shown in Fig. 3 suggest that LDs accumulated in differentiating 3T3-L1 cells in the presence of exogenous FAs is due to the free FA uptake as well as de novo lipid synthesis where the carbon source is derived from acetyl-CoA, a glycolysis byproduct of glucose. For 3T3-L1 cells, the ratio of I1654/I1445 for FAs produced through de novo synitesis have is 0.32±0.04 (n = 20; mean ± s.d.) (Fig. S4). Compared to the ratio of 0.58 for monounsaturated oleic acid, our data show that the LDs in 3T3-L1 cells contain a significant portion of saturated FAs. It should be noted that we have assumed homogeneity of LDs in the above analysis. Muller and coworkers 21 showed phase separation within single LDs composed of highly saturated FAs. However, such separation happened only if fraction of saturated FAs reached 75%. In the present study such high fraction of saturated FAs was not reached even in case of LDs in 3T3-L1 cells dominated by exogenous palmitic acid (see Fig. 3b). We anticipate that such high fraction of saturated FAs is rarely reached in de novo synthesis.
Figure 3. Compound Raman analysis of exogenous and endogenous FAs in LDs of live 3T3-L1 cells.
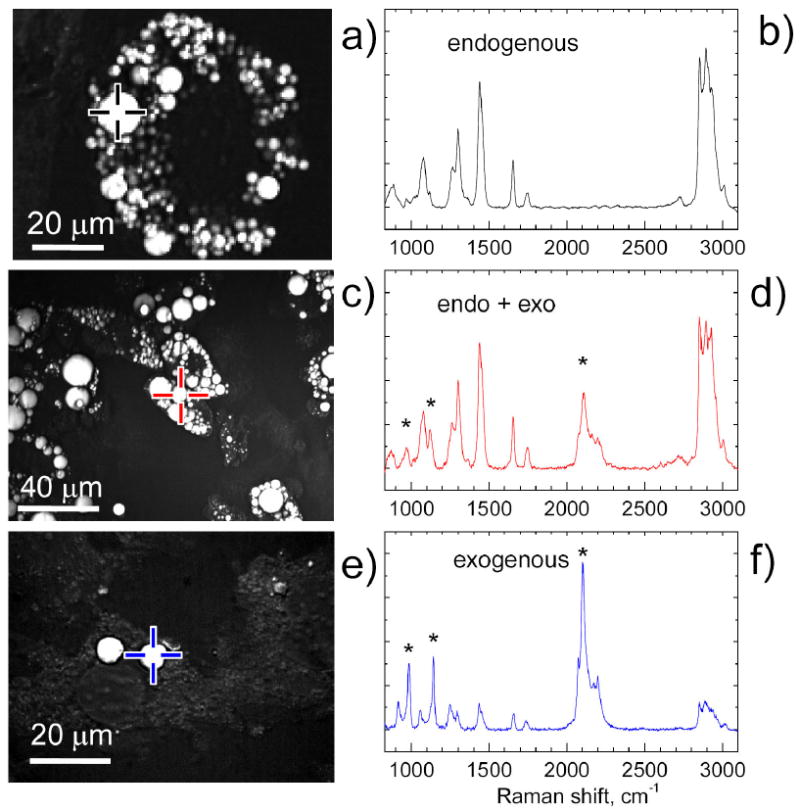
(a) F-CARS image of 3T3-L1 cells incubated for 2 weeks in the medium containing FAs secreted by VF. (c) F-CARS image of 3T3-L1 cells incubated for 2 weeks in the medium containing FAs secreted by VF and additionally for 4 days with added 50 μM of d31-palmitic FA. (e) F-CARS image of undifferentiated 3T3-L1 cells incubated for 4 days in the medium containing 50 μM of d31-palmitic FA. (b,d,f) Corresponding Raman spectra of LDs indicated by crosses in panel (a,c,e), marked black, red and blue colors, respectively. The asterisks show the position of peaks of d31–palmitic acid.
In vivo analysis of lipid-rich structures
A clear advantage of CARS imaging over Nile red staining lies in label-free imaging of lipid-rich structures in a complex tissue environment where the labeling is not readily accessible.24 Based on this advantage of coherent Raman imaging we have further evaluated the capability of our compound Raman microscope for chemical imaging and spectral analysis of lipid-rich structures in vivo. We first identified subcutaneous adipocytes and sebaceous glands in the ear of a living BALB/c mouse by E-CARS imaging (Fig. 4a-b). Subsequent spectral analyses of the adipocytes and glands revealed a I1654/I1445 ratio of 0.82±0.04 (n = 3; mean ± s.d.) and 0.29±0.03 (n = 3; mean ± s.d.) for the subcutaneous adipocytes and the sebaceous glands, respectively (Fig. 4c-d). Because the 1654 cm-1 and the 1445 cm-1 peaks correspond to C=C stretching and C-H deformation vibrations, respectively, our result indicates a much higher level of saturated lipids in the glands. This result is consistent with the high wax ester concentration of a sebaceous gland where it can reach up to 26% of the sebum weight 25,26. The high concentration of saturated lipid species in sebaceous glands is also reflected in the fitted peak ratio of I2850/I2935 which is 2.1 times of that in the subcutaneous adipocytes (Fig. 4d). Here I2850 and I2935 represent the peak intensity of CH2 and CH3 symmetric stretching bands. This result suggests that lipid packing in the sebaceous gland is much more ordered than that in the subcutaneous adipocytes (c.f. Fig. 2). Notably, the I1654/I1445 ratio of 0.82 for subcutaneous adipocytes is significantly higher than the ratio of 0.32 for in vitro 3T3-L1 cells, indicating that the in vivo fat contains much more unsaturated FAs than the fat formed via de novo synthesis in 3T3-L1 cells. To summarize, these measurements demonstrate the significance of quantitative Raman spectral analysis for in vivo CARS imaging studies.
Figure 4. Compound Raman analysis of lipid-rich structures in vivo.

(a-b) Overlapped CARS (red) and SHG (light blue) images of mouse skin at two different depths. (c) Raman spectra taken at points indicated in panels (a) and (b) corresponding to the gland and adipocyte, respectively. (d) Raman spectra of the C-H stretching regions of the LDs in the gland and adipocyte together with least-squares fitting by 6 Lorentzian lines.
Coupling spontaneous Raman with stimulated Raman scattering
Finally we demonstrate the integration of confocal Raman analysis and stimulated Raman scattering (SRS) imaging27. High-speed SRS imaging of live cells with ps pulses was demonstrated recently 28. However, it is cumbersome to record a SRS spectrum by tuning the ps laser. Herein we overcame such difficulty by performing confocal Raman analysis and subsequent SRS imaging using the same ps laser source (see Experimental methods). By transmission illumination and confocal Raman analysis, we first recorded the whole vibrational spectra of individual LD, cytoplasm, and nucleus in a 3T3-L1 cell (Fig. 5a-b). Our data showed that the intensity ratio of the CH2 symmetric stretch at 2850 cm-1 to the CH3 symmetric stretch at 2935 cm-1 in the LD is higher than that in the cytoplasm and nucleus. A possible explanation is that the lipids stored in the LDs have a higher density of CH2 groups than proteins which are abundant in the cytoplasm and nucleus. Another interesting spectral feature is the amide I band of proteins at around 1650 cm-1. However, it coincides with the stronger C=C vibration of FAs at 1654 cm-1. To confirm the spectral analysis, we performed stimulated Raman gain imaging of the same cell. At 1654 cm-1 we mainly observed signal from LDs and very low contrast from cytoplasm due to the small intensity of amide I band (Fig. 5d). At the CH2 stretching vibration frequency of 2850 cm-1, we observed a bright contrast from the large LDs, low contrast from the cytoplasm, and no signal from the nucleus (Fig. 5e). At the CH3 stretching vibration frequency of 2935 cm-1, we observed a higher contrast from the cytoplasm as well as the nucleus (Fig. 5f). The contrast nearly disappeared at 2600 cm-1, away from any Raman resonance (Fig. 5c). The recorded spectrum at the CH stretching region further confirmed that the Raman gain signal is background free (Fig. S5).
Figure 5. Confocal Raman analysis and SRS imaging of LDs in a differentiated 3T3-L1 cell.

(a) Transmission image of a 3T3-L1 cell. (b) Raman spectra of LD, cytoplasm and nucleous indicated by crosses in panel (a). The spectra of cytoplasm and nucleus are multiplied by 5 and off set for clarity. (c-f) SRS images of 3T3-L1 cell at 2600 cm-1, 1654 cm-1, 2850 cm-1, and 2935 cm-1, respectively. The intensity profiles along the dashed lines are shown for each SRS image. Cells were pre-differentiated for 5 days. The acquisition time for each Raman spectrum in panel (b) is 20 s. The acquisition time for each SRS image is 53 s.
Conclusions
We have developed a compound Raman microscope capable of high-speed vibrational imaging with coherent Raman signals and quantitative spectral analysis with spontaneous Raman signals. We have evaluated the performance of our compound Raman microscope on lipid bodies of cultured cells and live animals. Important information including lipid body abundance, size, degree of carbon chain unsaturation, and lipid-packing density could be obtained within a few seconds. In particular, our compound Raman microscope has allowed quantitative analysis of the abundance of an exogenous FA species within single lipid droplets. Such information is critical to analysis of lipid distribution 29 under the in vivo condition, thus permitting real-time evaluation of the effectiveness of an obesity treatment. We expect the high-speed data acquisition capability of compound Raman microscopy will open up exciting possibilities for in vivo studies of lipid metabolism where the impact of microenvironments including vasculatures, extracellular matrix, and stromal cells, can be evaluated. Although we focused on lipid bodies in this work, our method also allows high-speed spectral analysis and chemical imaging of samples in pharmaceutical, environmental, and other research fields.
Supplementary Material
Acknowledgments
This work is partially supported by a National Institutes of Health grant R01 EB007243 to JXC. TTL is supported by a National Institutes of Health postdoctoral fellowship F32HL089074.
Footnotes
Supporting Information Available. Methods details, parameters, five figures, and table with Raman peaks assignments are available free of charge via the Internet at http://pubs.acs.org.
References
- 1.Kopelman PG. Nature. 2000;404:635. doi: 10.1038/35007508. [DOI] [PubMed] [Google Scholar]
- 2.Calle EE, Kaaks R. Nat Rev Cancer. 2004;4:579. doi: 10.1038/nrc1408. [DOI] [PubMed] [Google Scholar]
- 3.Rosen ED, Spiegelman BM. Nature. 2006;444:847. doi: 10.1038/nature05483. [DOI] [PMC free article] [PubMed] [Google Scholar]
- 4.Rosen ED, MacDougald OA. Nat Rev Mol Cell Biol. 2006;7:885. doi: 10.1038/nrm2066. [DOI] [PubMed] [Google Scholar]
- 5.Green H, Kehinde O. Cell. 1974;1:113. [Google Scholar]
- 6.Martin S, Parton RG. Nat Rev Mol Cell Biol. 2006;7:373. doi: 10.1038/nrm1912. [DOI] [PubMed] [Google Scholar]
- 7.Guo Y, Walther TC, Rao M, Stuurman N, Goshima G, Terayama K, Wong JS, Vale RD, Walter P, Farese RV. Nature. 2008;453:657. doi: 10.1038/nature06928. [DOI] [PMC free article] [PubMed] [Google Scholar]
- 8.Fujimoto T, Ohsaki Y, Cheng J, Suzuki M, Shinohara Y. Histochem Cell Biol. 2008;130:263. doi: 10.1007/s00418-008-0449-0. [DOI] [PMC free article] [PubMed] [Google Scholar]
- 9.Greenspan P, Mayer EP, Fowler SD. J Cell Biol. 1985;100:965. doi: 10.1083/jcb.100.3.965. [DOI] [PMC free article] [PubMed] [Google Scholar]
- 10.Nan XL, Cheng JX, Xie XS. J Lipid Res. 2003;44:2202. doi: 10.1194/jlr.D300022-JLR200. [DOI] [PubMed] [Google Scholar]
- 11.van Manen HJ, Kraan YM, Roos D, Otto C. Proc Natl Acad Sci USA. 2005;102:10159. doi: 10.1073/pnas.0502746102. [DOI] [PMC free article] [PubMed] [Google Scholar]
- 12.Cheng JX, Xie XS. J Phys Chem B. 2004;108:827. [Google Scholar]
- 13.Evans CL, Potma EO, Puoris’haag M, Cote D, Lin CP, Xie XS. Proc Natl Acad Sci USA. 2005;102:16807. doi: 10.1073/pnas.0508282102. [DOI] [PMC free article] [PubMed] [Google Scholar]
- 14.Wang HF, Fu Y, Zickmund P, Shi RY, Cheng JX. Biophys J. 2005;89:581. doi: 10.1529/biophysj.105.061911. [DOI] [PMC free article] [PubMed] [Google Scholar]
- 15.Li L, Wang HF, Cheng JX. Biophys J. 2005;89:3480. doi: 10.1529/biophysj.105.065607. [DOI] [PMC free article] [PubMed] [Google Scholar]
- 16.Nan XL, Potma EO, Xie XS. Biophys J. 2006;91:728. doi: 10.1529/biophysj.105.074534. [DOI] [PMC free article] [PubMed] [Google Scholar]
- 17.Yamaguchi T, Omatsu N, Morimoto E, Nakashima H, Ueno K, Tanaka T, Satouchi K, Hirose F, Osumi T. J Lipid Res. 2007;48:1078. doi: 10.1194/jlr.M600493-JLR200. [DOI] [PubMed] [Google Scholar]
- 18.Hellerer T, Axang C, Brackmann C, Hillertz P, Pilon M, Enejder A. Proc Natl Acad Sci USA. 2007;104:14658. doi: 10.1073/pnas.0703594104. [DOI] [PMC free article] [PubMed] [Google Scholar]
- 19.Cheng JX, Volkmer A, Book LD, Xie XS. J Phys Chem B. 2002;106:8493. [Google Scholar]
- 20.Muller M, Schins JM. J Phys Chem B. 2002;106:3715. [Google Scholar]
- 21.Rinia HA, Burger KNJ, Bonn M, Muller M. Biophys J. 2008;95:4908. doi: 10.1529/biophysj.108.137737. [DOI] [PMC free article] [PubMed] [Google Scholar]
- 22.Cheng J-X, Volkmer A, Book LD, Xie XS. J Phys Chem B. 2001;105:1277. [Google Scholar]
- 23.Levin IW. In: Advances in Infrared and Raman Spectroscopy. Clark RJH, Hester RE, editors. Vol. 11. Wiley Heyden; New York: 1984. pp. 1–48. [Google Scholar]
- 24.Evans CL, Xie XS. Annu Rev Anal Chem. 2008;1:883. doi: 10.1146/annurev.anchem.1.031207.112754. [DOI] [PubMed] [Google Scholar]
- 25.Smith KR, Thiboutot DM. J Lipid Res. 2008;49:271. doi: 10.1194/jlr.R700015-JLR200. [DOI] [PubMed] [Google Scholar]
- 26.Caspers PJ, Lucassen GW, Puppels GJ. Biophys J. 2003;85:572. doi: 10.1016/S0006-3495(03)74501-9. [DOI] [PMC free article] [PubMed] [Google Scholar]
- 27.Ploetz E, Laimgruber S, Berner S, Zinth W, Gilch P. App Phys B. 2007;87:389. [Google Scholar]
- 28.Freudiger CW, Min W, Saar BG, Lu S, Holtom GR, He C, Tsai JC, Kang JX, Xie XS. Science. 2008;322:1857. doi: 10.1126/science.1165758. [DOI] [PMC free article] [PubMed] [Google Scholar]
- 29.Weiss R. Eur J Endocrinol. 2007;157:S39. doi: 10.1530/EJE-07-0125. [DOI] [PubMed] [Google Scholar]
Associated Data
This section collects any data citations, data availability statements, or supplementary materials included in this article.