Abstract
The Pro23 to Thr (P23T) mutation in human γD-crystallin (HGD) shows several cataract phenotypes. We found earlier (Pande et al. (2005) Biochemistry 44, 2491–2500) that the mutation dramatically lowers the solubility of P23T but the overall protein fold is maintained. Recently we observed that solutions of P23T showed liquid-liquid phase transition behavior similar to that of HGD but the liquid-protein crystal phase transition was altered, suggesting an asymmetric distribution of “sticky” patches on the protein surface (McManus et al. (2007) PNAS 104, 16856–16861). Here we present high-resolution NMR studies on HGD and P23T in which we have made nearly complete backbone assignments. The data provide a structural basis for explaining the retrograde solubility of P23T by (a) identifying possible “sticky” patches on the surface of P23T and (b) highlighting their asymmetric distribution.
Keywords: crystallin, mutation, chemical shift, NMR, cataract
A number of studies of the mutants of human γD-crystallin provide compelling evidence that the aggregation and lowered solubility of these mutants may be directly involved in cataract formation [1–3]. In many cases, the mutant protein largely maintains its secondary and tertiary structure. One example of this is the P23T mutation, reported to be geographically widespread and universally linked to cataract formation. In a previous study we provided the molecular basis of opacity due to this mutation and showed that the overall protein fold of P23T is maintained not only in solution, but also in the aggregated state [1]. However, the retrograde solubility pattern (i.e. inverse dependence of solubility with temperature) shown by P23T suggested that there may be “sticky” patches on the protein surface which facilitate aggregation due to hydrophobic, protein-protein interactions. Other investigators [4] have used synchrotron-based circular dichroism (CD) spectroscopy and shown that minor structural changes occur in P23T. Such minor differences between a cataract-associated mutant and HGD have been observed previously by us and others in the high-resolution x-ray crystal structure of the Arg58 to His (R58H) and the Arg36 to Ser (R36S) mutants [2, 5], although here again, these mutations resulted in a dramatic lowering of protein solubility.
In order to ascertain what the minor structural changes in P23T could be which lead to its lower and retrograde solubility relative to HGD, we examined the solution structure of P23T and HGD using high-resolution NMR spectroscopy. This technique is well suited to examining proteins such as P23T, since our attempts and those of others [4] to crystallize this mutant have not been successful thus far.
Materials and methods
Cloning, expression and purification of HGD and P23T have already been described [1]. For the NMR experiments, E. coli cells were grown in LB broth until induction, and transferred to either (i) the M9 minimal medium containing 1 g/L [U-15N]NH4Cl and 2g/L D-glucose (for [U-,15N] labeled protein), or (ii) to the M9 minimal medium containing 1 g/L [U-15N]NH4Cl and 2g/L [U-13C6] D-glucose [for U-,15N,13C labeled protein]. The protein was obtained in the soluble form and purified as already described for the unlabeled protein [1]. Protein samples in the concentration range 0.3–0.5 mM were dissolved in the NMR buffer (10mM KPO4 (pH 7.0), 100 mM NaCl, 0.02% NaN3, 90% H2O and 10% D2O).
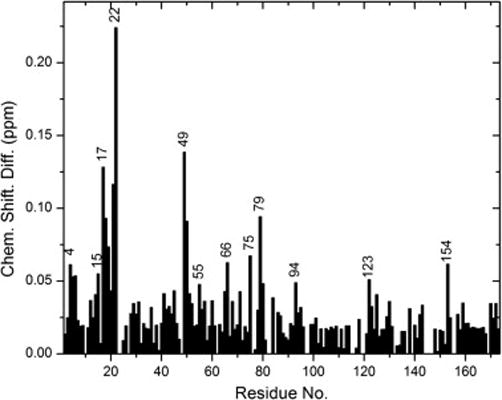
NMR spectra were collected at 25°C in a Bruker Avance spectrometer, operating at a 1H frequency of 500 MHz, and equipped with a z-axis gradient TCI cryoprobe. Standard double and triple resonance NMR experiments, 2D 1H-15N HSQC and 3D CBCA(CO)NH, HNCACO, HNCO, and HNCACB, were used for the backbone chemical shifts assignments [6]. All spectra were processed using TOPSPIN 2.1 (Bruker Inc.) and the NMR chemical shift assignments were made using CARA [7]. Chemical shift differences (shown in Fig. 3), are weighted-averages for each 1H/15N pair, and calculated as [(Δδ2NH+Δδ2N/25)/2]1/2, as in [8], where ΔδNH and ΔδN are differences in the amide 1H and 15N chemical shifts for HGD and P23T, respectively.
Fig. 3.

Average amide chemical shift difference for all the assigned residues in HGD and P23T. The average is weighted average of the 1H and 15N chemical shifts calculated as [(Δδ2NH+Δδ2N/25)/2]1/2 (see text for details). The residue numbering for the C-terminal end (i.e. 87 to 174) was shifted up by one residue to match the numbering in the x-ray structure [5]. Only high (greater than 0.1 ppm) and moderate (between 0.1 ppm and 0.05 ppm) chemical shift differences are indicated by the individual residue numbers. For the sake of clarity, all consecutive residues have not been marked.
Amino acid residues are numbered according to the sequence of HGD (www.expasy.ch:seq.IDCRGD_human). However, residue 86 in the sequence is at 87 in the x-ray structure of HGD. Therefore, in Figs. 3 and 4 we have adopted the numbering according to the x-ray structure.
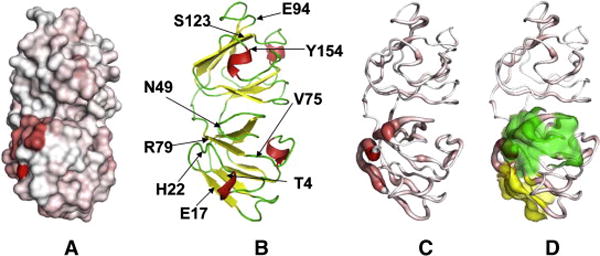
Fig. 4.

Four representations of the crystal structure of HGD in identical orientation, showing the regions where amide chemical shift differences are significant. A. Surface representation indicating change by means of the intensity of the red color on a grey surface. B. A backbone cartoon representation of HGD structure showing the location of the residues noted in Fig. 3. C. A backbone tubular representation of HGD, showing the magnitude of the chemical shift differences (see Fig. 3) by the thickness of the tube and the color intensity. Unlike the surface representation (A), it permits views within the structure and in the background. D. Same as (C) but with yellow and green transparent areas which show two potentially ‘sticky’ patches discussed in the text. Fig. 4 was made using the Pymol software [17].
Results and discussion
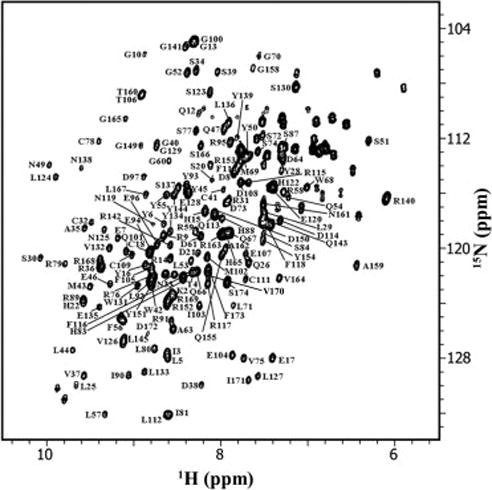
Fig. 1 shows the 15N-HSQC spectrum of HGD. It provides a fingerprint of the 3D structure, and each backbone amide except proline is expected to contribute a single cross-peak. Besides proline the following 11 residues could not be assigned in HGD: G1, N24, Y62, G85, Y98, R99, I121, L146, M147, D156 and W157, and the following 13 residues could not be identified in P23T: G1, T23, N24, Y62, R76, Y98, R99, I121, R140, L146, M147, D156 and W157. N-terminal amines are usually unassigned during standard NMR procedures [6]. Except for G1, all other residues are located in the solvent exposed loop structures of HGD and are possibly broadened due to chemical exchange of amides with water. Most of the unassigned residues are common to the two proteins. Thus, overall, about 90% of the backbone amides have been assigned. We note that several assigned resonances appear to be of low intensity, e.g. residues D21, H22, L71, S84 and Q154. This is probably due to the unfavorable exchange rates of these residues.
Fig. 1.

2D 15N-1H HSQC spectrum of 500 μM [U-, 15N] human γD-crystallin (HGD), with assignments indicated by residue number and identity. The protein sample was dissolved in the NMR buffer (10mM KPO4 (pH 7.0), 100 mM NaCl, 0.02% NaN3, 90% H2O and 10% D2O). NMR data was acquired on 500 MHz Bruker Avance NMR spectrometer at 25 °C.
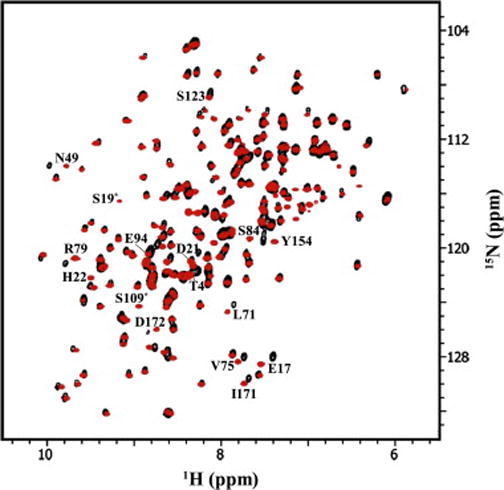
Fig. 2 shows the overlay of the spectra for HGD (black) and P23T (red). The large dispersion in both 15N and 1H dimensions indicates that both HGD and P23T are well folded, and the striking congruence of the spectra suggests that the two 3D- structures are nearly identical. NMR chemical shifts are highly sensitive to even small, local changes in tertiary structure.
Fig. 2.

2D 15N-1H HSQC spectrum of 500 μM [U-, 15N] HGD (black contours), and 500 μM [U-, 15N] P23T (red contours). Residues with large average amide chemical shift differences between the two proteins are marked (compare with Figs. 3 and 4). The contours marked with an asterisk(*) are those for which HGD contours are not visible at this contour level.
In Fig. 3 the average amide chemical shift differences are plotted which reveal several differences in the 3D structures of HGD and P23T. We have mapped these chemical shift differences on the high-resolution crystal structure of HGD [5], (shown in Fig. 4). This enabled us to find patches on the surface of HGD that are likely to facilitate the formation of “clusters” due to the P23T mutation. Clusters are small protein nuclei or agglomerates that grow to form larger aggregates, as elaborated earlier [1].
From Fig. 3 it is clear that most of the large changes, i.e. chemical shift differences greater than 0.1 ppm, are localized in the N-terminal domain (residues 1–85). Conspicuously large changes are seen in D21 and H22 – residues adjoining the mutation site. This is expected since these two amino acids are the nearest neighbors of residue 23, the mutation site. We were not able to assign T23 or N24 (the other neighboring residue).
Figs. 4A & 4B show that residues D21 and H22 along with R79 and Y50 make a patch on the surface of the protein. A major change is also observed in residues N49 and Y50. Along with residue V75 which shows a moderate change, these three residues could make a hydrophobic patch, contiguous with the first patch. Residues H15, E17 and C18 which are part of the beta-strand immediately preceding the loop containing T23 (the mutation site), also appear to be affected. The residues T4, L5, and Y6, which are part of the adjoining beta-strand, show some change as well, probably because they are in close proximity (~4 Å) to the strand containing residues E17 and C18. Therefore residues T4, L5, Y6 make another contiguous patch with residues H15, E17 and C18 (Fig. 4C). Thus, the major changes in the N-terminal domain of the protein can be characterized on the basis of changes in these three patches: patch 1 consists of residues D21, H22, Y50 and R79, patch 2 contains N49, Y50 and V75, and patch 3 contains T4, L5, Y6, H15, E17, and C18. Patches 1 and 2 share residue 50 and are contiguous. Clearly, each patch has a distinct composition based on the charge and hydrophobicity of the constituent amino acid residues. In addition to the changes found in the 3 patches, minor changes are also observed in several other residues, which are apparent in Figs. 3, 4A and 4C.
We recognize that it is possible to characterize the changes observed in Fig. 3 by an alternate set of patches. Two such surface patches, covering approximately the same region on the protein surface, were found computationally by using the Sharp2 [9] protein server. This is a web-based bioinformatics tool for predicting potential protein-protein interaction sites on the surface of proteins, based on the analysis of known structures of complexes by Jones and Thornton [10]. Using only two parameters, i.e. a high overall hydrophobicity and a low solvation potential, we obtained two surface patches on HGD with 7 residues each, shown in Fig. 4D: patch 1 centered on residue T4 and containing K2, T4, H15, Y16, E17, C18 and R36 (yellow), and patch 2 centered on P48 and containing P23, N24, Q46, P48, N49, Y50 and R76 (green). Therefore, in HGD there are “potentially sticky” patches already present, which are probably rendered more effective in promoting aggregation in P23T.
Our data show that compared to the N-terminal domain of HGD, only minor changes occur in the C-terminal domain. Residues E94, S123 and Y154 are moderately affected. In HGD E94 and Y154 are partially solvent accessible, while S123 is largely buried. These changes and others in the C-terminal domain (see Fig. 4C) may provide other sites on the surface of P23T that facilitate cluster formation.
From a detailed study of several HGD mutants related to P23T, we concluded earlier [1] that it was not the introduction of a Thr residue at site 23, but the deletion of the Pro residue was the key to cluster formation. We reasoned that local structural perturbations due to the missing Pro residue were significant in affecting the hydrophobic interactions and altered solubility of P23T. This conclusion is consistent with the NMR results which show strong, localized perturbations. The surface patches identified above contain both hydrophobic and hydrophilic residues. However, as stated earlier [1], the condensation of P23T to form protein clusters involves a significant gain in the net hydrophobic interactions between molecules of P23T leading to aggregation.
The retrograde solubility of P23T [1] is similar to that observed in hemoglobin S (HbS) [11] in which a single residue in the beta chain is mutated from Glu to Val. Detailed structural studies have shown that while the net interactions governing the solubility of HbS are hydrophobic in nature; several ionic interactions are likely to be involved in forming the condensed phase [12, 13]. Thus it is not surprising that in P23T, the observed surface changes are not limited only to the hydrophobic residues.
An interesting aspect of our NMR studies is that the major chemical shift changes are localized in the N-terminal domain. This may give rise to orientation-dependent protein-protein interactions, as observed in the phase-diagrams of a related mutant, Pro23 to Val (P23V) [14, 15]. This mutant also shows a retrograde solubility behavior and similar overall structure as P23T, but its higher solubility compared to P23T enabled us to study its liquid-liquid and liquid-crystal phase boundaries [14]. While the liquid-liquid phase boundary of P23V was identical to that of P23T, its liquid-crystal boundary was not. This difference could only be explained on the basis of orientation-dependent protein-protein interactions which were clearly important in the solid state, but were being averaged in the solution state. Therefore, if as we suggest, the surface patches shown in Fig. 4A & C, are in fact the major sites of protein-protein interactions that lead to cluster formation, then their asymmetric distribution on the protein surface is consistent with these conclusions from the phase diagrams.
As stated earlier [14], the series of HGD mutants P23T, P23S and P23V share a common feature with HbS, i.e. a lower and retrograde solubility relative to the wild-type, but the details of the phase-diagrams of the crystallin mutants are distinct from that of HbS. Unlike the crystallin mutants which give rise to a ‘cluster’ condensed phase [1], HbS gives rise to fibers [11, 16]. Similarly, HbS shows a lower consolute temperature in liquid-liquid phase diagrams [16], while the crystallin mutants do not [1, 14]. Some of these differences may arise from the vectorial nature of the axial and lateral interactions observed in crystals of HbS [12, 13], which are also observed in HbS fibers, while for the crystallin mutants, only clusters (not fibers) are observed in the condensed phase [1].
In conclusion, our NMR data suggest an asymmetric distribution of distinct “sticky” patches on the surface of the P23T mutant which could explain its retrograde solubility and atypical phase diagram.
Acknowledgments
This work was supported by the ADA Career Development Award 1-06-CD-23 to A.S., and by the NIH Grant EY10535 to J.P. We are grateful to Dr. George Thurston for his insightful comments.
Footnotes
Publisher's Disclaimer: This is a PDF file of an unedited manuscript that has been accepted for publication. As a service to our customers we are providing this early version of the manuscript. The manuscript will undergo copyediting, typesetting, and review of the resulting proof before it is published in its final citable form. Please note that during the production process errors may be discovered which could affect the content, and all legal disclaimers that apply to the journal pertain.
References
- 1.Pande A, Annunziata O, Asherie N, Ogun O, Benedek GB, Pande J. Decrease in protein solubility and cataract formation caused by the Pro23 to Thr mutation in human gamma D-crystallin. Biochemistry. 2005;44:2491–2500. doi: 10.1021/bi0479611. [DOI] [PubMed] [Google Scholar]
- 2.Kmoch S, Brynda J, Asfaw B, Bezouska K, Novak P, Rezacova P, Ondrova L, Filipec M, Sedlacek J, Elleder M. Link between a novel human gammaD-crystallin allele and a unique cataract phenotype explained by protein crystallography. Hum Mol Genet. 2000;9:1779–1786. doi: 10.1093/hmg/9.12.1779. [DOI] [PubMed] [Google Scholar]
- 3.Pande A, Pande J, Asherie N, Lomakin A, Ogun O, King JA, Lubsen NH, Walton D, Benedek GB. Molecular basis of a progressive juvenile-onset hereditary cataract. Proc Natl Acad Sci U S A. 2000;97:1993–1998. doi: 10.1073/pnas.040554397. [DOI] [PMC free article] [PubMed] [Google Scholar]
- 4.Evans P, Wyatt K, Wistow GJ, Bateman OA, Wallace BA, Slingsby C. The P23T cataract mutation causes loss of solubility of folded gammaD-crystallin. J Mol Biol. 2004;343:435–444. doi: 10.1016/j.jmb.2004.08.050. [DOI] [PubMed] [Google Scholar]
- 5.Basak A, Bateman O, Slingsby C, Pande A, Asherie N, Ogun O, Benedek GB, Pande J. High-resolution X-ray crystal structures of human gammaD crystallin (1.25 A) and the R58H mutant (1.15 A) associated with aculeiform cataract. J Mol Biol. 2003;328:1137–1147. doi: 10.1016/s0022-2836(03)00375-9. [DOI] [PubMed] [Google Scholar]
- 6.Cavanagh J, Fairbrother WJ, Palmer AG, Rance M, Skelton NJ. Protein NMR spectroscopy: principles and practice. 2. Academic Press; Amsterdam, Boston: 2007. pp. 533–678. [Google Scholar]
- 7.Masse JE, Keller R. AutoLink: automated sequential resonance assignment of biopolymers from NMR data by relative-hypothesis-prioritization-based simulated logic. J Magn Reson. 2005;174:133–151. doi: 10.1016/j.jmr.2005.01.017. [DOI] [PubMed] [Google Scholar]
- 8.Song J, Markley JL. Protein inhibitors of serine proteinases: role of backbone structure and dynamics in controlling the hydrolysis constant. Biochemistry. 2003;42:5186–5194. doi: 10.1021/bi034041u. [DOI] [PubMed] [Google Scholar]
- 9.Murakami Y, Jones S. SHARP2: protein-protein interaction predictions using patch analysis. Bioinformatics. 2006;22:1794–1795. doi: 10.1093/bioinformatics/btl171. [DOI] [PubMed] [Google Scholar]
- 10.Jones S, Thornton JM. Analysis of protein-protein interaction sites using surface patches. J Mol Biol. 1997;272:121–132. doi: 10.1006/jmbi.1997.1234. [DOI] [PubMed] [Google Scholar]
- 11.Eaton WA, Hofrichter J. Sickle cell hemoglobin polymerization. Adv Protein Chem. 1990;40:63–279. doi: 10.1016/s0065-3233(08)60287-9. [DOI] [PubMed] [Google Scholar]
- 12.Harrington DJ, Adachi K, Royer WE., Jr The high resolution crystal structure of deoxyhemoglobin S. J Mol Biol. 1997;272:398–407. doi: 10.1006/jmbi.1997.1253. [DOI] [PubMed] [Google Scholar]
- 13.Harrington DJ, Adachi K, Royer WE., Jr Crystal structure of deoxy-human hemoglobin beta6 Glu --> Trp. Implications for the structure and formation of the sickle cell fiber. J Biol Chem. 1998;273:32690–32696. doi: 10.1074/jbc.273.49.32690. [DOI] [PubMed] [Google Scholar]
- 14.McManus JJ, Lomakin A, Ogun O, Pande A, Basan M, Pande J, Benedek GB. Altered phase diagram due to a single point mutation in human gammaD-crystallin. Proc Natl Acad Sci U S A. 2007;104:16856–16861. doi: 10.1073/pnas.0707412104. [DOI] [PMC free article] [PubMed] [Google Scholar]
- 15.Thurston GM. Protein anisotropy turns solubility on its head. Proc Natl Acad Sci U S A. 2007;104:18877–18878. doi: 10.1073/pnas.0708631104. [DOI] [PMC free article] [PubMed] [Google Scholar]
- 16.Galkin O, Chen K, Nagel RL, Hirsch RE, Vekilov PG. Liquid-liquid separation in solutions of normal and sickle cell hemoglobin. Proc Natl Acad Sci U S A. 2002;99:8479–8483. doi: 10.1073/pnas.122055299. [DOI] [PMC free article] [PubMed] [Google Scholar]
- 17.DeLano WL. The Pymol Molecular Graphics System. 2008. [Google Scholar]


