

Abstract
In order to validate a gel free quantitative proteomics assay for the model methylotrophic bacterium Methylobacterium extorquens AM1, we examined the M. extorquens AM1 proteome under single carbon (methanol) and multi-carbon (succinate) growth, conditions that have been studied for decades and for which extensive corroborative data have been compiled. In total, 4,447 proteins from a database containing 7,556 putative ORFs from M. extorquens AM1 could be identified with two or more peptide sequences, corresponding to a qualitative proteome coverage of 58%. Statistically significant non-zero (log2 scale) differential abundance ratios of methanol/succinate could be detected for 317 proteins using summed ion intensity measurements and 585 proteins using spectral counting, at a q-value cut-off of 0.01, a measure of false discovery rate. The results were compared to recent microarray studies performed under equivalent chemostat conditions. The M. extorquens AM1 studies demonstrated the feasibility of scaling up the multidimensional capillary HPLC tandem mass spectrometry approach to a prokaryotic organism with a proteome more than three times the size of microbes we have investigated previously, while maintaining a high degree of proteome coverage and reliable quantitative abundance ratios.
Keywords: C1 metabolism, Methylobacterium extorquens AM1, MudPIT, Methylotrophy
1 Introduction
Methylotrophy describes the ability to metabolize one carbon (C1) sources such as methanol for use as a sole source of carbon and energy. C1 compounds can be converted to either biomass or carbon dioxide, accumulating cellular formaldehyde in the process [1]. Methylotrophy has been studied intensively in recent decades because of its relevance for the global carbon cycle and its applicability in biotechnological detoxification and production processes [2, 3]. Among the best characterized model organisms for the study of one carbon metabolism is the facultatively methylotrophic Methylobacterium extorquens AM1, which is able to grow on C1 substrates (e.g. methanol) and also several C2, C3 and C4 compounds, such as ethanol, pyruvate and succinate [3-6]. The special metabolic properties of Methylobacterium species appear to contribute to their widespread distribution in the environment [7-9], and specifically in the phytosphere. The numerical predominance of the epiphytic species M. extorquens in the plant colonization process was shown to be dependent on its ability to make use of methanol as a carbon source [10]. Although a wealth of information about the enzymes and regulators involved in C1 metabolic pathways has been provided through genomic, genetic, enzymatic, metabolic flux and modelling studies, and more recently metabolic profiling analysis and in planta experiments [6, 7, 11-14], a number of enzymes and their functions remain uncharacterized. To identify the remaining unknown functions required for methylotrophic growth, recent studies have taken a more global approach to understanding the metabolism and physiology of M. extorquens, including 2-D gel proteomic [13, 15] and whole genome microarray studies based on the existing gapped genome sequence of 6.7 Mbp [16]. The first proteome level experiments with M. extorquens were performed using 2-D gel electrophoresis and peptide mass fingerprinting by Laukel and coworkers, yielding 229 identified proteins [15]. This study provided valuable information about the protein adaptations M. extorquens undergoes when grown on synthetic medium with methanol as a sole carbon source in comparison to succinate, describing 68 proteins as induced under methylotrophic conditions, although a number of primary oxidation, C1 transfer and formate oxidation proteins could not be detected using the gel-based approach [15].
In order to obtain a more comprehensive model of methylotrophy in M. extorquens, we developed a non-gel proteomic assay using a MudPIT [17-22] approach under the assumption that such an assay would provide a more complete and quantitative description of the proteome than would be possible using other methods. The assay was applied to experiments using chemostat grown cultures with methanol or succinate as substrates, respectively, and an ORF database based on the same annotation used for the global transcription studies [16]. This work was also a necessary step on the road towards future work planned for the analysis of model microbial communities or consortia, in that it involved analysis of a much larger and more technically challenging proteome relative to what we have worked with in the past.
2 Materials and methods
If not stated otherwise, chemicals were from Sigma-Aldrich (St. Louis, MO, USA).
2.1 Chemostat cultivation, sample preparation and HPLC pre-fractionation
In order to achieve reproducible culture conditions among biological replicates and for facilitating the comparison of our proteomics data with the recent microarray study by Okubo and Skovran et al. [16], continuous cultures of M. extorquens AM1 were grown under the same conditions as described [16, 23]. After having maintained stable conditions regarding optical density (1.0 +/- 0.05 at 600 nm), pH and dissolved oxygen for at least three chemostat residence times, 250 ml aliquots for two biological replicates per substrate condition, containing approximately 5 × 10¹⁰ cells each, were decanted, cooled rapidly and harvested by centrifugation at 4,500 g for 6 minutes at 4 °C. After washing with cooled 15 mM Tris HCl pH 8, the pellets were immediately frozen in liquid nitrogen, lyophilized to dryness (dry weight about 100 mg) as described [14] and stored at -80 °C until further use.
For lysis, the pellets were resuspended in 400 μl of boiling resuspension buffer containing 15 mM Tris HCl pH 8.5, 0.02% Rapigest™ (Waters, Milford, MA) by vortexing and water bath sonication (Branson Instruments Inc., Danbury, CT, USA). The suspension was kept boiling for 3 min in a water bath, followed again by vortexing. After cooling, MgCl2 was added to a final concentration of 2 mM, and 2 units of benzonase (Roche Applied Sciences, Indianapolis, IN, USA) were added. The suspension was incubated at room temperature for 15 min. Ethanoland buffer-washed glass beads (150 μm, equivalent volume of 300 μl) were added, the volume adjusted to 1.5 ml with resuspension buffer, and bead beating was performed for 2 × 3 minutes at 48 rpm in a MiniBeadBeater™ from BioSpec Products (Bartlesville, OK, USA). The homogenates (including the insoluble debris portion and the beads) were lyophilized to dryness. For digestion, the dry pellets were resuspended in 375 μl digestion-buffer (2M Urea, 5% acetonitrile, 5 mM DTT and 0.1% Rapigest™. The pH was 8 to 8.5. After reduction with 10 mM dithiothreitol for 30 min at 37 °C and alkylation with 30 mM iodoacetamide for 30 min at 30 °C (in the dark), digestion was started by adding EndoLysC (Roche Applied Sciences, Indianapolis, IN, USA) at a ratio of 1:200 protease to protein according to the Bradford Assay [24], incubating over night at 37 °C. After roughly 20 hrs, Trypsin (Promega, Madison, WI, USA) was added 1:50 and incubation was continued for 8 hrs at 37 °C. The reaction was stopped by adding 0.3 % (final concentration) TFA until the pH had dropped to 2.5. Rapigest™ was precipitated by further incubation at 37 °C for 30 min. Each sample was then centrifuged for 10 min at 14,000 rpm in a tabletop centrifuge (Eppendorf, Westbury, NY, USA), and the supernatant was collected. The pellet (containing insoluble particles and the glass beads) was washed twice with 250 μl 0.5% TFA, and 5% acetonitrile. All supernatants were pooled and the pH was adjusted to 2.5 with TFA if necessary. After freezing, the sample was lyophilized to 150 μl.
For HPLC pre-fractionation, each sample was centrifuged for 10 min at 14,000 rpm in a tabletop centrifuge (Eppendorf) and the supernatant was applied to a PLRP-S 2.1 mm i.d. × 250 mm, 300 Å, 5 μm reversed phase column (Polymer Laboratories, Amherst, MA 01002, USA) with mobile phases of 0.1 % TFA in H2O and acetonitrile, respectively. Peptides were eluted at 0.3 ml/min according to a gradient of 5-60 % acetonitrile in 75 min and 60-90 % acetonitrile in 15 min, and collected in 10 fractions. The pre-fractions were concentrated and adjusted to 0.5 % acetic acid and 5 % acetonitrile (v/v).
2.2 Linear ion trap tandem mass spectrometry
The proteolytic digests were further analyzed in duplicate or triplicate per biological replicate, using a biphasic 2-D capillary HPLC system, coupled to an LTQ linear ion trap mass spectrometer (Thermo Fisher Scientific, San Jose, CA, USA), as described [25, 26]. Briefly, samples were analyzed on a Michrom Magic 2002 HPLC (Michrom, Auburn, CA, USA) modified in-house for capillary column operation, using a 75 μm inner diameter biphasic column which consisted of a 3 cm strong cation exchange section followed by a 10 cm reversed phase C18 section. The column was coupled to the LTQ mass spectrometer through an in-house built electrospray ionization interface. The apparatus was similar to that originally described by Washburn et al. [17-19]. The peptides were eluted by ammonium acetate solutions (0, 10, 25, 50, 100, 250 and 500 mM), followed by reverse phase gradients of 5-12% in 1 min, 12% B for 9 min, 12-40% B in 50 min, 40-80% B in 11 min, 80% B for 10 min and 80-5% B in 5 min. Solvent B: 99.5% acetonitrile, 0.5% acetic acid (v/v). The MS1 scan range was 400-2000 m/z. After each main beam (MS1) scan, the 10 most intense ions above threshold were selected for CID scans with one CID scan collected for each of the precursor ions. Default parameters under the Xcalibur 1.4 data acquisition software (Thermo Fisher) were used, with the exception of an isolation width of 3.0 m/z units and a normalized collision energy of 40%.
2.3 SEQUEST and DTASelect
SEQUEST database searching [27] and DTASelect [28] filtering were performed as described [25, 26]. Briefly, product ion (MS2) mass spectra were searched using TurboSEQUEST Cluster Version 3.2 (Thermo-Finnigan) on a 16-CPU computing cluster (Denali Advanced Integration, Seattle, WA, USA) against a concatenated fasta database that included M. extorquens proteins, the human subset of the nrdb depleted of all virus sequences, with reversed sequence decoy versions of the M. extorquens and human database appended. The concatenated, 91 Mb database comprised a total of 203,065 protein sequences, 7,556 of which belonged to the M. extorquens database. A gapped genome sequence (6.5 × coverage; http:\\www.integratedgenomics.com/genomereleases.html#list6) was used to generate the M. extorquens protein fasta database, corresponding to the DNA sequence database underlying the transcriptomics results by Okubo and Skovran et al. [16]. The DTASelect Version 1.9 filtering criteria chosen comprised fully tryptic peptides and ΔCn/Xcorr values for different peptide charge states of 0.08/1.9 for +1, 0.08/2.0 for + 2, and 0.08/3.3 for +3. All redundant spectra detected for each sequence were retained (t = 0 in DTASelect). Two peptides unique to a particular ORF were required for positive identification. Unique means that the peptide sequence could only be found in one ORF entry in the concatenated database. Prior to final archiving in PRIDE (http://www.ebi.ac.uk/pride/), the DTASelect 1.9 filter data for all protein identifications will be posted on the corresponding author's website (http://depts.washington.edu/mhlab/). Summary Tables S1 and S2 for the complete proteomic dataset can be found at the same URL, along with conversion tables to allow use of the data with more recent annotations, as they become available. Tables S1 and S2 also contain an abbreviated version of the microarray data previously published [[16]. An abbreviated table of the most relevant proteomic and microarray results with respect to methylotrophy, Table S3, is included in the electronic supplement to this paper, along with explanatory notes for all tables, supplementary figures, equations (t-test and G-test) and additional detail regarding the normalization and multiple hypothesis testing procedures described below.
2.4 Estimation of the qualitative random false positive rate
Random false positive identifications at the peptide level were assessed from the reversed protein sequences in the concatenated database (Section 2.3). Search results that passed the criteria described above and matched an entry in the decoy database were counted as false positives. The qualitative random false positive rate [29, 30] was thus estimated to be 2.6%.
2.5 Data processing for estimation of protein abundance ratios from protein intensity and spectral counting values
Detailed descriptions of the Visual Basic, R and Filemaker scripts applied to estimate protein abundances on the basis of summed protein intensity and spectral count values are given in previous work by Xia et al. [25, 26]. Summed protein intensity refers to the summation of all processed parent ion intensity measurements (MS1) for which a confirming CID spectrum (MS2) exists according to the DTASelect filter files mentioned above in Section 2.3. Additional R source code used specifically for the present work is given in the electronic supplement. Briefly, a Visual Basic 2005 program (IntensityMaker Version 2.0) was applied to convert raw data files into plain text intensity files, which were, together with the DTAselect filter file containing spectral counting information, imported into a relational FileMaker Pro 8 database as separate tables. A FileMaker script application (QuantScript, Version 1.0, March 2006) combined these two streams of information into ion intensity based protein abundance ratios for methanol/succinate. The protein level summed signal intensity method used the summed intensity values in MS1 from all unique peptides identified for a given protein in order to calculate the abundance ratios for each protein given in Table 2 and supplementary Tables S1-S3.
Table 2.
Highest abundance changes a) estimated by spectral counting values for select proteins under methanol vs. succinate growth conditions, compared with the corresponding transcription array ratios by Okubo, Skovran et al. [16].
| Proteomics data | Microarray data | ||||||
|---|---|---|---|---|---|---|---|
| Biological process / protein | Gene name, functional description | Spectr. count ratio MeOH/Succin (log2)b) | Sum (log2)c) | q-value d) | Avg. ratio MeOH/Succin (log10) | Avg. p-value | SAM δ=1.25 score e) |
| Methylotrophy | |||||||
| RMQ12669 | fdh2A, NAD-linked formate dehydrogenase, α-subunit | 8.46 | 9.460 | 0.000086 | 0.9510 | 0.000000 | 15.8053 |
| RMQ12670 | fdh2B, NAD-linked formate dehydrogenase, β-subunit | 8.11 | 9.11 | 0.000000 | 0.3144 | 0.000005 | 4.2410 |
| RMQ04236 | fdh2C, NAD-linked formate dehydrogenase, γ-subunit | 4.66 | 5.71 | 0.000000 | 0.8310 | 0.000000 | 12.1072 |
| MELfdh2D | Molybdenum-dependent formate dehydrogenase | 5.67 | 6.70 | 0.000000 | 0.6008 | 0.000000 | 8.8664 |
| RMQ06989 | mtkA, malate thiokinase, α-subunit | 4.21 | 10.56 | 0.000000 | 0.4131 | 0.000000 | 5.6789 |
| RMQ06988 | mtkB, malate thiokinase, β-subunit | 3.47 | 9.65 | 0.000000 | 0.9416 | 0.000000 | 15.6636 |
| RMQ12088 | sga, serine glyoxylate aminotransferase | 3.42 | 12.33 | 0.000000 | 1.0458 | 0.000000 | 12.5071 |
| RMQ06990 | fch, methenyltetrahydrofolate cyclohydrolase | 2.67 | 10.32 | 0.000000 | 0.3522 | 0.000051 | 4.0102 |
| RMQ09318 | mauA, methylamine dehydrogenase, small subunit | 3.15 | 5.720 | 0.000000 | 0.0784 | 0.256444 | - |
| Electron transfer | |||||||
| RMQ08074 | Cytochrome C | 5.04 | 6.30 | 0.000000 | 0.5614 | 0.000289 | 7.8708 |
| RMQ09050 | Ferredoxin | 3.20 | 4.85 | 0.000000 | -0.2022 | 0.111892 | -1.8364 |
| RMQ 07487 | Alkanesulfonate monooxygenase | 2.63 | 4.51 | 0.000182 | 0.0682 | 0.210289 | - |
| RMQ04804 | Flavohemoprotein | 2.96 | 4.13 | 0.000749 | 0.0316 | 0.281579 | - |
| RMQ02158 | Cytochrome d ubiquinol oxidase subunit I | 2.83 | 4.02 | 0.002249 | -0.0103 | 0.494911 | - |
| Transport and binding | |||||||
| RMQ06614 | Oligopeptide transporter | 3.20 | 4.09 | 0.000604 | 0.0169 | 0.719162 | - |
| RMQ05821 | Transporter | 3.03 | 4.20 | 0.000264 | 0.1787 | 0.221674 | 3.1046 |
| RMQ06652 | Alkanesulfonates binding protein | 2.85 | 4.26 | 0.000489 | -0.0313 | 0.646506 | - |
| Bacteriochlorophyll biosynthesis | |||||||
| RMQ06356 | Light-independent protochlorophyllide reductase subunit N | 3.51 | 4.64 | 0.000000 | 0.8791 | 0.016483 | 5.9173 |
| RMQ01543 | Light-independent protochlorophyllide reductase subunit B | 2.60 | 4.24 | 0.001349 | 0.1087 | 0.104357 | - |
| RMQ08201 | Mg-protoporphyrin IX monomethyl ester oxidative cyclase (aerobic) | 2.54 | 4.19 | 0.001234 | 0.5887 | 0.000000 | 6.3932 |
| Others | |||||||
| RMQ05833 | 2-keto-4-pentenoate hydratase | 4.51 | 6.16 | 0.000000 | 0.0694 | 0.319367 | - |
| RMQ07275 | 2-dehydropantoate 2-reductase | 2.68 | 7.25 | 0.000000 | 0.1800 | 0.017278 | 3.6012 |
| RMQ01118 | CoA synthetase | 2.67 | 7.53 | 0.000000 | 0.1550 | 0.123622 | 1.9451 |
| RMQ06057 | Acetyl-CoA:acetoacetyl-CoA transferase α-subunit | 3.91 | 9.75 | 0.000000 | 0.5693 | 0.000000 | 7.4182 |
| RMQ04459 | SSU ribosomal protein S12P | 4.23 | 5.30 | 0.000000 | -0.1007 | 0.264939 | - |
| RMQ02615 | Universal stress protein family | 3.04 | 6.35 | 0.000000 | -0.0957 | 0.459547 | - |
| RMQ12593 | Glucose-fructose oxidoreductase | 2.72 | 4.14 | 0.001534 | 0.0125 | 0.765129 | - |
| RMQ07739 | fliM, Flagellar motor switch protein | 3.20 | 4.09 | 0.000036 | 0.0300 | 0.712640 | - |
| RMQ12403 | Metal-dependent hydrolase | 2.92 | 4.10 | 0.001086 | 0.2390 | 0.088655 | 2.5209 |
| Unknown function / hypothetical | |||||||
| RMQ11509 | Unknown function | 4.28 | 5.10 | 0.000000 | -0.0184 | 0.666193 | - |
| RMQ05835 | Hypothetical protein | 3.07 | 4.23 | 0.000000 | 0.2744 | 0.001003 | 1.9523 |
| RMQ11790 | Unknown function | 2.72 | 4.14 | 0.001061 | 0.1396 | 0.182216 | 1.7696 |
| RMQ08996 | Unknown function | 2.59 | 5.23 | 0.000000 | 0.0027 | 0.545101 | - |
Included in Table 2 are those proteins showing the 33 highest observed methanol vs. succinate ratios, with q-values < 0.01, i.e. those proteins that showed the strongest induction under methanol. For reasons of clarity, proteome level abundance changes are represented by spectral count values only. For a complete listing of all observed spectral counting and intensity ratios, see supplemental Tables S1 and S2. A subset of proteins relevant to methylotrophy is shown in Table S3. See Section 2.3 for instructions for accessing Tables S1 and S2.
Global log2 ratio of the average of the normalized total spectral count values for MeOH vs. Succininate: log2[(MeOH_1 + MeOH_2) ÷ (Succin_1 + Succin_2).
The sum of the normalized spectral counts for both MeOH and Succinate, providing an estimate of the degree to which a particular ORF is represented in the dataset
For spectral counting, the redundant numbers of peptides uniquely associated with each ORF were summed from the DTAselect filter table [25, 31]. This is a measurement of frequency of occurrence, not signal strength. After normalization, a ratio of summed spectral count values was calculated for each protein. Spectral counting is a frequency measurement that has been demonstrated in the literature to correlate with protein abundance [31-33]. For a discussion contrasting the strengths and weaknesses of spectral counting, summed signal intensity and other methods for generating protein abundance ratios for whole microbial cell studies, see the recent review by Xia et al. [34].
2.6 Experimental design, data normalization and significance testing
The overall experimental design (Fig. 1) involved two complete biological replicates as described above (Section 2.2) for each of the two nutrient conditions, methanol (MeOH_1, MeOH_2) and succinate (Succin_1, Succin_2). Each methanol replicate was compared to each succinate replicate, yielding four sets of abundance ratios. This design functions for non-label quantitation in a manner analogous to stable isotope “flip” replicates for metabolic labeling proteomic studies or dye swap replicates in a transcription microarray analysis. Each biological replicate consisted of the mean value of normalized total counts and total intensity calculated for each protein observed in the technical replicates. This design allowed for estimation of variance associated with technical replicates as well as sources of variance associated with different chemostat experiments (biological replicates). Global normalization of the data was based on the counts or summed intensity observed for the most abundant biological replicate. After normalization the average summed intensity or average spectral count was calculated. For spectral counting, the G-test was used with each ratio determination, as we have published previously [25], followed by calculation of GTotal, as per the method described in Sokal and Rohlf [35]. The global G-test functions much like analysis of variance (ANOVA), partitioning variance into that associated with the individual spectral count comparisons for a given ORF (within group variation) and that associated with significant deviation from the null hypothesis in terms of the overall trend in the four abundance ratios. For each value of GTotal, a p-value was calculated as in our previous work [25]. The uncorrected p-value was used as an input into the R package QVALUE (http://faculty.washington.edu/~jstorey/qvalue/), yielding a measure of the quantitative false discovery rate [36], the q-value [37]. For the summed intensity measurements, a paired t-test [38] was employed, n = 4. The t-test was used to generate a global p-value over all four comparisons. As with the G-test results, the p-values were input into the QVALUE R package using the default parameters. A significance level of q = 0.01 or lower was chosen as a cut-off for both methods, based on the criterion of achieving a best balance between false positive and false negative errors [34]. A q-value of zero in the tables means that the calculated value was less than the smallest value that could be calculated in R, a number that is platform dependent and equal to 2.22 × 10⁻¹⁶ for the work reported here. As a check on the reasonableness of the q cut-off, the lists of significantly changed proteins were checked against well defined regions of random error determined experimentally from the random scatter about zero expression change generated from LOWESS curves defining error boundaries in technical replicates [34], analogous to the M versus A plots commonly used in the microarray community. The q-value is appropriate for multiple hypothesis testing for thousands of proteins in a way that has proven to be more realistic and not as overtly conservative for global protein abundance data, relative to other, more established approaches to the multiple hypothesis problem [37]. The q-value associated with each global abundance ratio in supplemental Tables S1-S3 and main text Table 2 can be informally defined here as the minimum false discovery rate when rejecting the null hypothesis of no significant change in M. extorquens protein abundance. For a more technical description of the false discovery rate [36], and the q-value as originally developed for transcription microarray data, see Storey and Tibshirani [37] and the references contained therein.
Figure 1.
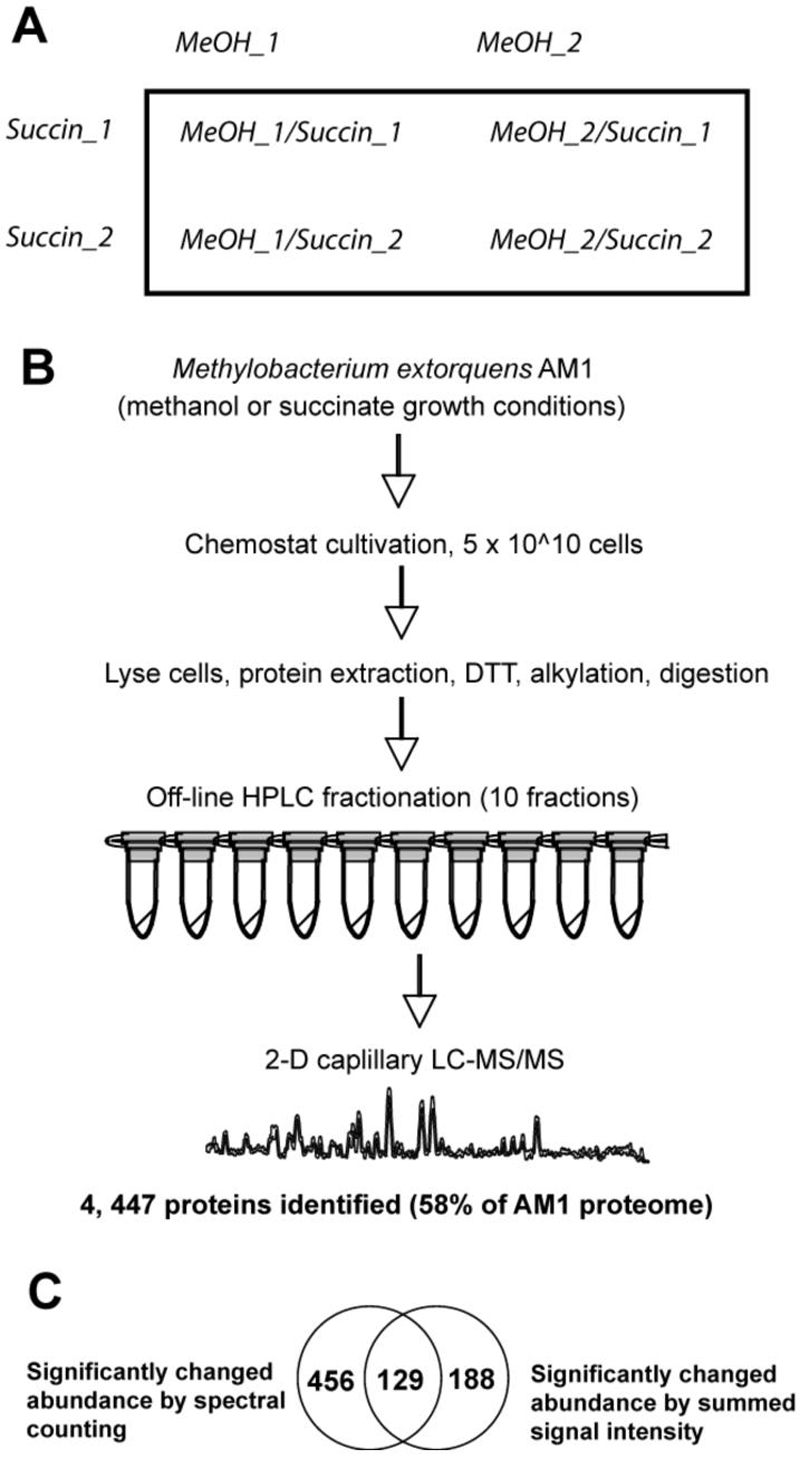
Project overview, showing (A), the experimental design; (B), an outline of the analytical procedure; and (C), the number of protein relative abundances called as significantly changed by the two calculation methods and the observed overlap of 129 proteins called as changed by both approaches.
The scatter plots and correlation analyses shown in Figs. 2-4 were performed using the standard, un-weighted linear regression routine in R on the log-transformed data (R Version 2.2.1, http://www.r-project.org/). More detail regarding the normalization method, G-test, t-test, q-value and color coding for the supplemental data tables and figures can be found in the on-line supplement under Notes and explanatory material for Tables S1-S3 and Figs. SF1-SF4.
Figure 2.
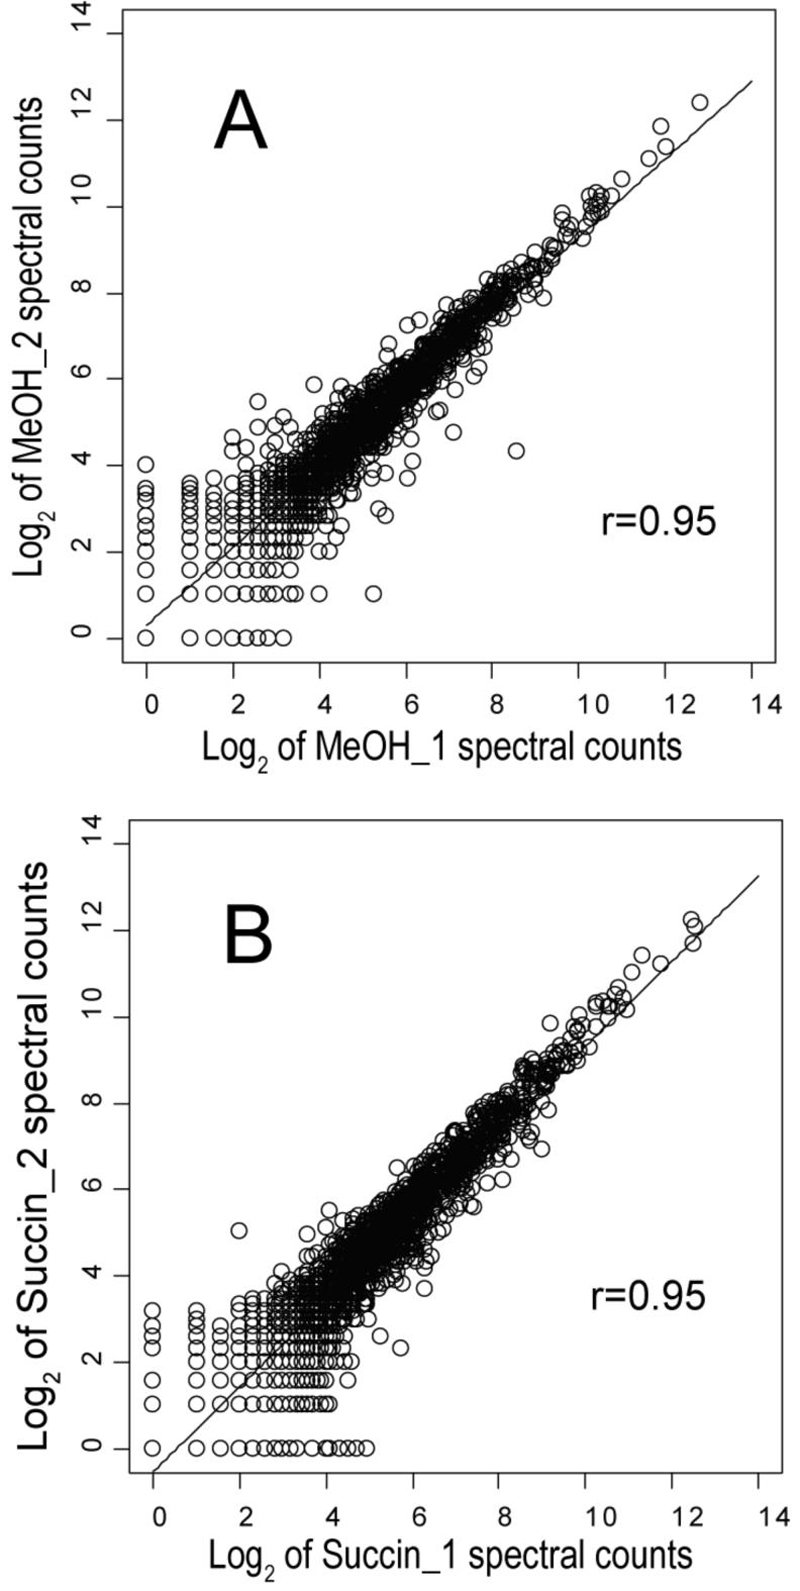
Scatter plot and linear regression showing the reproducibility of spectral counts for the biological replicates, i.e. separate chemostat runs, of methanol and succinate. (A), Plot of 2,959 proteins common to both replicates for methanol. (B), plot of 3,115 proteins common to both replicates for succinate.
Figure 4.
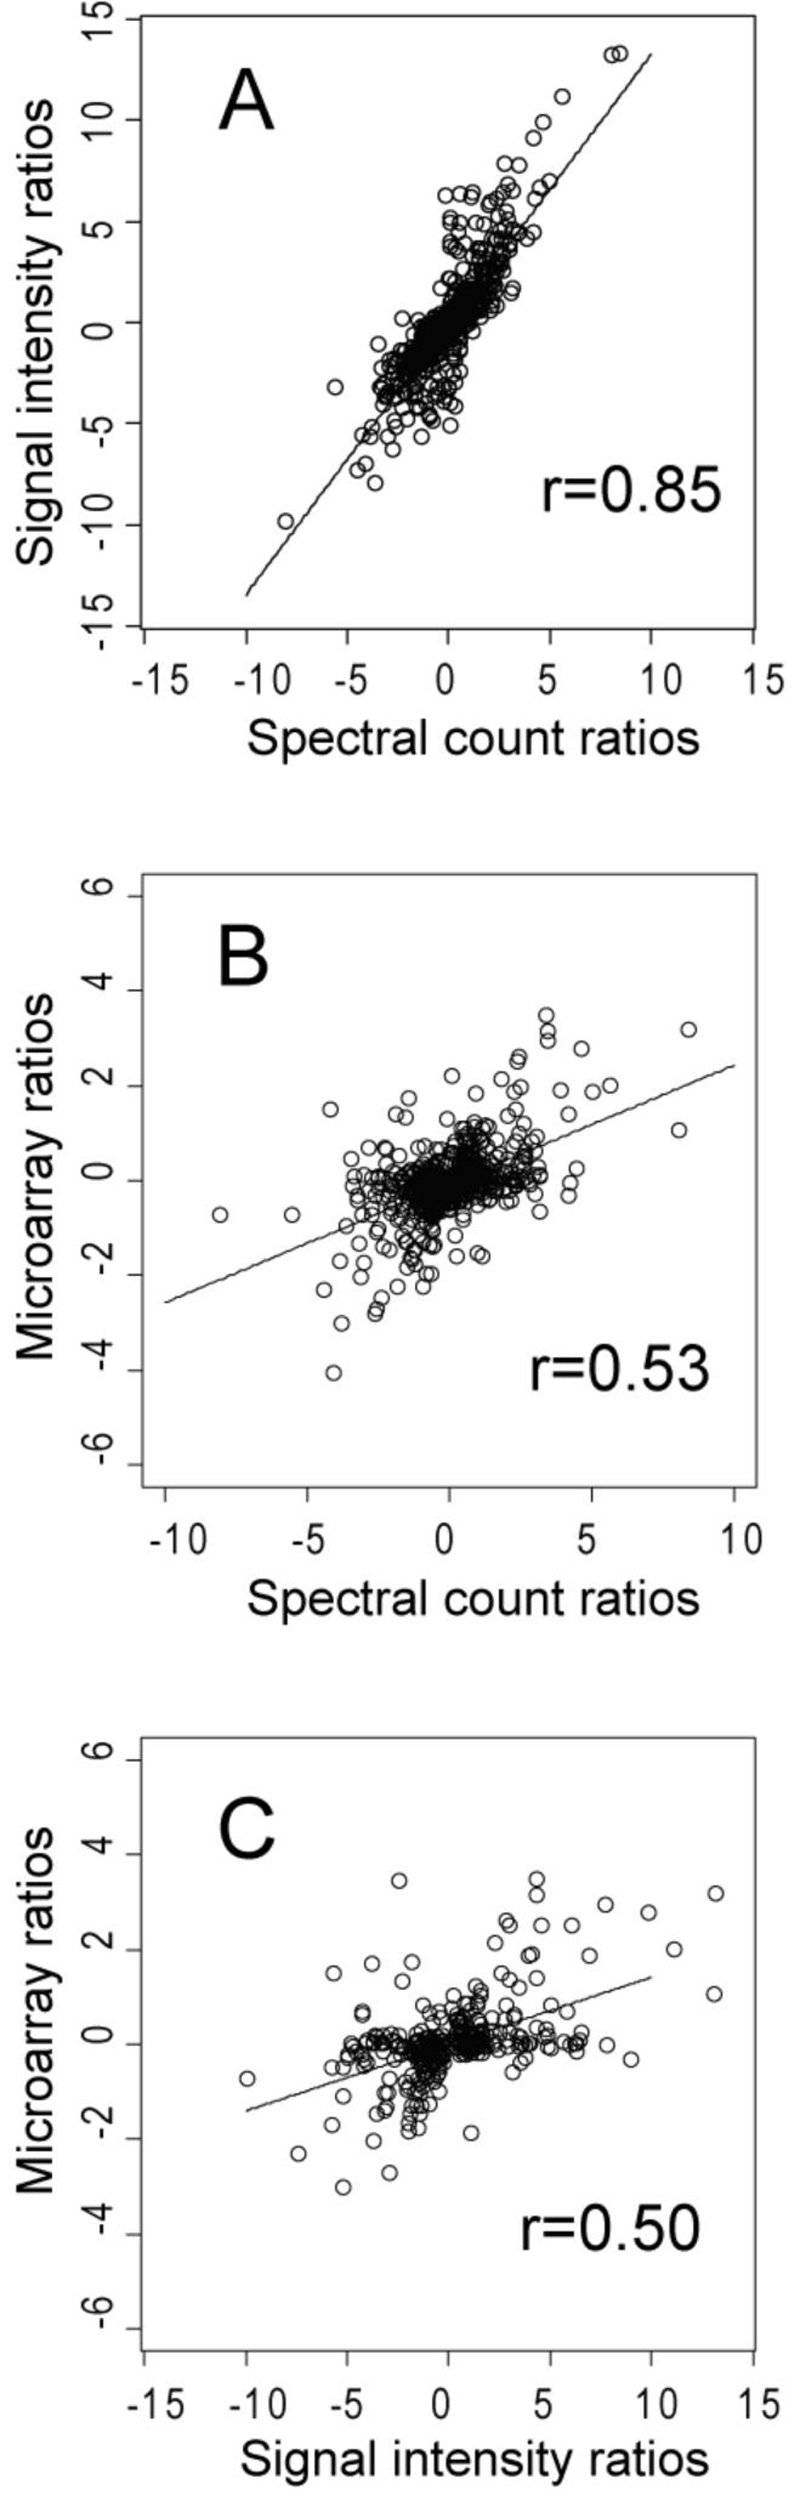
Scatter plots and linear regression for (A), the log2 protein abundance ratios calculated by summed signal intensity versus spectral counting for 762 proteins judged to be significantly changed by either method; (B), the log2 mRNA abundance ratios [16] versus the log2 spectral count proteomic abundance ratios for 585 ORFs showing significant change in protein abundance; and (C), the log2 mRNA abundance ratios [16] versus the log2 summed signal intensity proteomic abundance ratios for 317 ORFs showing significant change in protein abundance.
3 Results and discussion
3.1 Qualitative proteome coverage
In all biological replicates we qualitatively identified 4,447 proteins out of 7,556 ORFs found in the Methylobacterium extorquens AM1 first draft genome annotation. Specifically, 3,644 proteins were detected in MeOH_1, 3,170 in MeOH_2, 3,584 in Succin_1 and 3,401 proteins in Succin_2. The overall qualitative proteome coverage was 58%. Comprehensive lists of all identified proteins, abundance ratios, and a subset of proteins specifically associated with C1 metabolism are contained in supplementary Tables S1-S3 and can be downloaded as described in Section 2.3. The twenty most abundant proteins observed by spectral counting are shown in Table 1. In general, gene names are more widely recognized than annotation specific ORF numbers, thus we have used gene or gene product names wherever possible, and numbers from the 2002 annotation cited above (designated as RMQ numbers) when a name has not been assigned or is ambiguous. At this time there is no consensus categorization of the RMQ numbers by functional category, so such a summary presentation will have to wait until the final ORF designations and functional annotation become available, see Section 2.3.
Table 1.
The 20 most abundant proteins in the M. extorquens AM1 dataset according to the highest observed global average spectral count values a)
| Protein | Functional description | Gene name | Spectr. counts log2 MeOH b) | Spectr. counts log2 Succ b) |
|---|---|---|---|---|
| RMQ05966 | Methanol dehydrogenase large subunit | mxaF | 13.995 | 13.359 |
| RMQ09682 | Formaldehyde activating enzyme | fae | 13.251 | 12.374 |
| RMQ02595 | 60 kDa chaperonin GroEL | 13.116 | 13.336 | |
| RMQ04435 | Protein Translation Elongation Factor Tu (EF-TU) | 12.774 | 13.165 | |
| RMQ12088 | Serine glyoxylate aminotransferase | sga | 12.204 | 8.787 |
| RMQ03830 | Acetyl-CoA acetyltransferase | phaA | 11.899 | 12.528 |
| RMQ01212 | SSU ribosomal protein S1P | 11.759 | 12.056 | |
| RMQ08518 | ATP-dependent Clp protease ATP-binding subunit | clpA | 11.742 | 11.295 |
| RMQ03311 | Methylene-H4MTP-/methyleneH4F dehydrogenase | mtdA | 11.695 | 9.247 |
| RMQ06958 | Malyl-CoA lyase | mcl | 11.627 | 9.203 |
| RMQ05730 | Unknown function | 11.620 | 11.291 | |
| RMQ05057 | DNA-directed RNA polymerase beta chain | 11.608 | 11.605 | |
| RMQ07918 | Serine hydroxymethyltransferase | glyA | 11.550 | 11.040 |
| RMQ11455 | 60 kDa chaperonin GroEL | 11.535 | 11.382 | |
| RMQ05215 | LSU ribosomal protein L12P L7/L12 | 11.489 | 11.725 | |
| RMQ08089 | Trigger factor, PPIase | 11.412 | 11.232 | |
| RMQ06675 | Peptidyl-prolyl cis-trans isomerase | 11.266 | 10.881 | |
| RMQ07693 | DNA-directed RNA polymerase beta-prime chain | 11.114 | 11.429 | |
| RMQ11362 | ATP synthase alpha chain | 11.098 | 11.627 | |
| RMQ00428 | Unknown function | 11.085 | 10.568 |
Sorted from 4,447 global spectral count values observed under methanol conditions as shown in the supplementary data Tables S1 and S2.
Log2 of the normalized, observed global spectral counts for methanol or succinate samples, providing an estimate of the degree to which a particular protein is represented in its respective growth condition.
3.2 Reproducibility of biological replicates
Figs. 2 and 3 illustrate the reproducibility of the biological replicates for succinate and methanol. The statistical analysis as well as manual inspection of the proteomic results support the observation that no obvious trends could be associated with individual chemostat runs or MudPIT analyses, beyond one technical replicate in which twice as much sample was injected into the MudPIT instrumentation relative to all others. This type of systematic error is corrected at the normalization stage of the calculations and had little effect on the final global abundance ratio calculations. The random errors associated with the abundance ratios judged to be significantly different from zero on a log2 scale tended on average to be in the range of 15% to 35% RSD, towards the low end of this range for spectral counting (Fig. 2) and the high end for summed signal intensity (Fig. 3).
Figure 3.
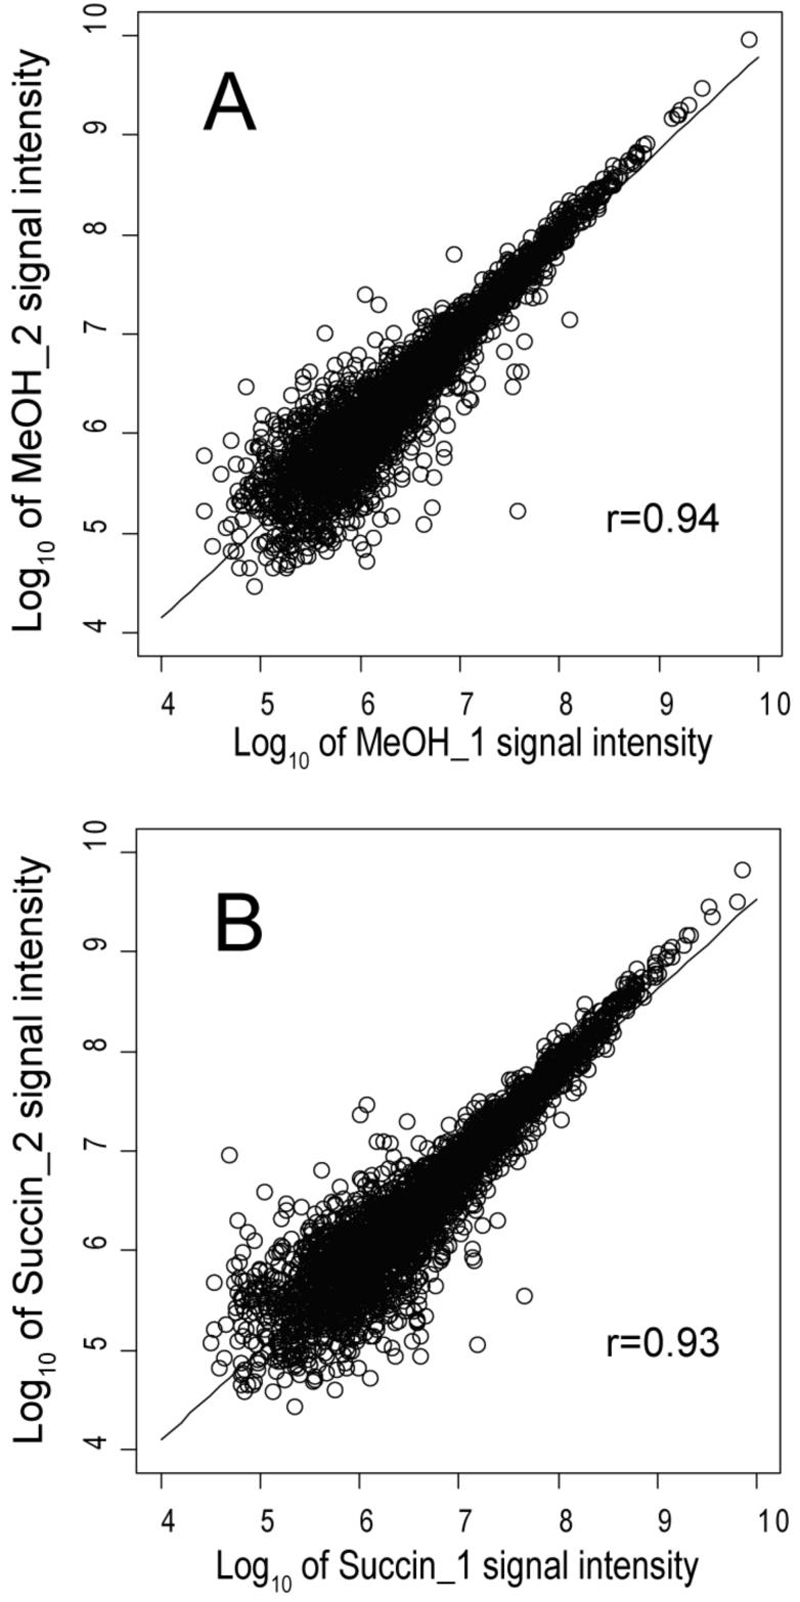
Scatter plot and linear regression showing the reproducibility of summed signal intensities for the biological replicates of methanol and succinate. (A), Plot of 2,959 proteins common to both replicates for methanol. (B), plot of 3,115 proteins common to both replicates for succinate.
3.3 Abundance change detection and proteome coverage
There is a clear relationship among the number of pre-fractions, sampling rates at the level of raw mass spectral data collection, proteome coverage and power to detect abundance change: more pre-fractionation and (or) faster data acquisition rates yield more coverage that equals higher power and thus lower quantitative FNRs (false negative rates). Non-label quantitative approaches such as spectral counting and summed signal intensity are especially sensitive to the coverage issue, but even with metabolic stable isotope labeling the same relationship holds true [34, 39, 40]. Because the sampling rate of the mass spectrometer is fixed under our experimental protocols, necessary improvements in throughput to maintain acceptable coverage were accomplished for the proteome of M. extorquens by doubling the number of pre-fractions collected prior to the 2-D capillary HPLC/mass spectrometry analysis from five to 10 for each biological replicate (Section 2.1), relative to our previous published work with less complex microbial proteomes [26, 40]. Spectral counts are very stable measurements, but can often be invariant with real abundance change in experiments where the true abundance change is known [34]. The methods employed here for both spectral counting and summed signal intensity are low in power (1-FNR) and thus suffer from inherently higher quantitative FNRs compared to the technology employed for the microarray analysis. This is in part a reflection of the greater time and expense associated with global expression proteomics relative to performing a similar experiment at the transcription level, which necessarily limits complete biological replicates to a number that can control for false discovery rate at an acceptable level, but that leaves quantitative FNRs unknown but presumed to be relatively high.
3.4 Overview of relative abundance changes
The differences between the two growth conditions were described by statistical evaluation of the log2 abundance ratios (Sections 2.6, 3.2, 3.3 and additional notes in the supplement) and are summarized over the entire observed M. extorquens proteome in the tables mentioned above. Table 2 summarizes the spectral counting abundance ratios observed for a subset of proteins most highly over-expressed under methanol, with q-values < 0.01. Due to the intrinsically higher degree of random error within the intensity data (Section 3.2), we used the spectral counting values as our main benchmark for protein abundance estimation, referring to the respective intensity values mainly for corroboration. Although trends in terms of relative abundance ratios were generally consistent by both methods (Fig. 4A), what was judged as significantly different from zero on a log2 scale in a statistical sense was less so, due to broad differences in the degree of random scatter observed with individual proteins and the somewhat different error distributions observed for the two methods [34]. The lower overall correlation between the transcription microarray expression ratios and proteomic abundance ratios (Fig. 4B, C) was expected, based on prior published work for prokaryotic systems [39-43].
The observed relative abundances for major housekeeping functions under single and multi-carbon conditions largely confirmed levels reported in an earlier study [15]. Hence, high spectral count levels under both conditions were found for chaperones and other proteins involved in quality control, ribosomal components, proteins with transcription and translation functions, proteins with roles in carbon utilization and energy production, and two proteins of unknown function, RMQ05730 and RMQ00428 (Table 1). With respect to abundance changes, cells grown with methanol not surprisingly showed higher methanol/succinate abundance ratios for those proteins and pathways connected with C1 metabolism. In addition, a set of transport and binding proteins, electron transport proteins relevant during C1 growth, proteins involved in bacteriochlorophyll biosynthesis and several other housekeeping and metabolic enzymes showed higher abundance under methanol (Table 2). Of note, the putative 2-keto-pentenoate hydratase, 2-dehydropantoate reductase, and CoA synthetase may form an operon with a putative formate/oxalate antiporter. The data for the formate/oxalate antiporter were not of sufficient quality to determine differential protein abundance. The putative operon and several additional genes from Table 2 are the subjects of ongoing studies.
In contrast, with succinate grown cells, dicarboxylate transport permeases, citric acid cycle proteins, pyruvate dehydrogenase and gluconeogenesis components, serine and glycine biosynthesis reactions, some flagellar and related proteins, as well as several oxidoreductases were all more abundant. Generally, these tendencies correlate well with the microarray data [16], except for two electron carrier proteins (RMQ09050, ferredoxin; RMQ02158, cytochrome d ubiquinol oxidase) as well as some iron uptake and related proteins. In the case of ferredoxin proteomics data showed methanol-induction, however the opposite trend was observed in the transcription arrays. For two iron and siderophore receptors (RMQ02369, RMQ02548) and a siderophore biosynthesis protein (RMQ10956), the proteomics data indicated higher relative abundance in succinate grown cells, which appeared as either marginally up-regulated (RMQ02369, RMQ10956) or unchanged (RMQ02548) in the microarrays.
3.5 C1 metabolism and associated metabolic pathways
The enzymatic requirements of M. extorquens for growth on one carbon substrates have been recently reviewed [7]. During both methanol and succinate growth, the overall highest abundance values in our dataset were found for the large subunit of methanol dehydrogenase (MxaF). However, the spectral counts for this protein under methanol growth conditions were still significantly higher relative to succinate. This finding correlates well with the microarray data and with previous findings that MxaF can comprise a large fraction of the total cellular protein content under methanol growth conditions [2, 15]. Similarly to the array data, we found the methanol dehydrogenase small subunit, MxaI, up-regulated, as was the methanol utilization protein PqqE, which is involved in coenzyme pyrroloquinoline quinone (PQQ) synthesis, the cofactor for methanol dehydrogenase. Except for PqqA, a small protein important for PQQ synthesis, and Orf17, which is involved in H4MPT biosynthesis, all components of the primary oxidation, C1 transfer and related cofactor biosynthesis modules were identified in the proteomics dataset.
For the formaldehyde activating enzyme Fae, we detected high spectral counts under both C1 and multi-carbon conditions, with the highest relative abundance observed for methanol grown cells, corroborating the microarray data [16] and previous proteomics [15]. Fae has been shown to catalyze the condensation of the toxic intermediate formaldehyde with H4MPT [44].
Consistent with the 2-D gel electrophoresis study by Laukel and coworkers [15] and the microarray data, we did not detect significant abundance change for methylene-H4MPT dehydrogenase B (MtdB). Apart from MtdB, all the primary oxidation and C1 transfer proteins discussed below were found to be methanol-induced according to the proteomics data, thus showing several differences between the proteomics and array studies. Methenyl-H4MPT cyclohydrolase (Mch) was only slightly over-expressed, as well as the gamma-subunit of the Formyl-H4MPT transferase/hydrolase protein complex (FhcA, B, C, D). While the microarray data showed no significant change for mch and fhc, Laukel and colleagues reported both Mch and the Fhc subunits A, B and C as induced under methanol, a finding which corroborates previous enzyme essays [45]. For the H4F-linked C1 transfer-proteins, formyl-H4F ligase (FtfL), methenyl-H4F cyclohydrolase (Fch) and methylene-H4MPT/methylene-H4F dehydrogenase (MtdA), their genes were up-regulated during methanol growth in the microarray data and the proteomics showed the same trend.
Two of the formate dehydrogenase complexes (Fdh1A, B and Fdh2A, B, C, D) were up-regulated under methanol, which is again consistent with the array data. The abundance ratios for Fdh2 were the highest in the entire dataset, but this may have more to do with molybdenum added to the growth medium than with methanol induction. The activity of Fdh2 in electron transport and energy production during methylotrophic growth is molybdenum-dependent. Only a few peptides were detected for the alpha chain of the newly identified formate dehydrogenase 4 (Fdh4, RMQ08549 and RMQ08550), which were not enough to determine a quantitative change in abundance. The fdh3 genes and gene products showed no statistically significant evidence for differential abundance.
In agreement with the microarray data and the proteomics study by Laukel et al. [15], high methanol/succinate ratios were calculated for almost all components of the serine cycle (in particular, MtkA, MtkB, Sga and Mcl). The serine cycle regulator QscR was strongly down-regulated under methanol conditions. The only known functions of QscR are as an activator of methylotrophy genes and as an autorepressor [47, 48]. Studies are currently underway investigating a potentially wider regulatory role for QscR.
Serine hydroxymethyltransferase (GlyA), which catalyzes the interconversion of serine and glycine yielding methylene-H4F, was methanol-induced in the proteome and microarrays. This metabolite is thought to be important in the metabolism of methanol in M. extorquens and is the major source of glycine and one-carbon units in non-methylotrophs like Escherichia coli [49]. A mutant lacking in functional GlyA was able to grow normally in succinate, suggesting this protein is not essential for growth under multi-carbon conditions [50]. Likewise, the first enzyme in serine biosynthesis, phosphoglycerate dehydrogenase, showed strong induction in the arrays and proteomics under succinate conditions. Up-regulation of the glycine cleavage system and of the downstream enzyme methylene-H4F reductase in the array and proteomics data also suggested the importance of C1 dependent functions in succinate grown cells. However, a reversible and thus glycine synthesizing activity of the glycine cleavage system has not been reported in prokaryotes.
For the serine cycle enzyme enolase, proteomics results showed a statistically significant increased abundance under methanol growth, as observed previously [15]. However, the microarrays did not show significant differential expression of the mRNA. High abundance values were observed for the acetoacetyl-CoA reductase PhaB, and lower values for the regulator PhaR. In addition, we detected Poly 3-hydroxyalkanoate polymerase (PhaC), the PHB granule associated proteins Gap11 and Gap20 [51] and also two proteins associated with PHB degradation (Hbd and RMQ09431) with a spectral count ratio indicating succinate induction. PhaA induction was recently demonstrated during the phyllosphere colonization phase of M. extorquens [13].
3.6 Central intermediary metabolism
A clear up-regulation was observed for the enzymes of the citric acid cycle under succinate growth, in agreement with the array data. This is not surprising since one half of the citric acid cycle, comprising citrate synthase, aconitase and the subsequent oxidative decarboxylation steps, is only necessary to provide glutamate for cellular biosynthesis during growth on methanol [7].
Malate dehydrogenase (Mdh) was detected as succinate-induced in the proteomics data but not significantly regulated in the transcriptomics. Although less abundant, membrane-associated Malate:quinone oxidoreductase (Mqo) was observed as clearly induced under multi-carbon conditions, in agreement with the transcription arrays and the previous proteomics study [15]. Apart from donating to the electron transfer chain, Mqo has been shown to support the malate dehydrogenase function, thus keeping the citric acid cycle functioning during growth on organic acids, which favors high oxaloacetate concentrations [15, 52, 53]. The citric acid cycle fueling pyruvate dehydrogenase complex (PdhA, B, C) was strongly induced under succinate, as were proteins for gluconeogenic and anaplerotic enzymes like phosphoenolpyruvate carboxykinase (Pck), pyruvate phosphate dikinase (Pdk), phosphoenolpyruvate synthase (Pps) and malic enzyme. The latter has been proposed as the main producer of pyruvate in M. extorquens based on enzyme activities [11].
3.7 NAD(P)H metabolism and electron transport
The subunits of NADH:ubiquinone oxidoreductase (NuoA-N) were all up-regulated in the transcription data under succinate conditions, which is consistent with a previous metabolic model and several mutant studies [6, 11, 54] emphasizing the importance of this enzyme complex for multi-carbon growth. However, the proteomics data only showed significant relative abundance increases under succinate for NuoB, F and G, while NuoI was increased under methanol. We could not obtain good quality mass spectra for NuoM, N, K and H. This might indicate an artifact due to the membrane location of this multi-subunit complex. The number of predicted proteolytic fragments recovered from membrane bound proteins, especially those that are intrinsic or that have extensive hydrophobic domains, is usually lower compared to proteins found in less hydrophobic environments. Lower recoveries imply less reliable abundance ratios, as discussed in Section 3.3.
The increase in abundance of the NADP-transhydrogenase PntA, B under succinate was also observed in the transcription arrays [16] and in the 2-D gel proteomics [15]. These findings are in physiological agreement with the need for M. extorquens to balance its redox state during growth on multi-carbon sources, where a surplus of reduction equivalents, e.g. from the citric acid cycle, must be compensated by reducing NADP through NADH oxidation, thus providing reducing power for anabolic reactions, such as gluconeogenesis [6].
Concluding remarks
Validating the 2-D capillary HPLC/tandem MS assay for M. extorquens was straightforward, given the amount of information that has been collected for this organism. The high frequencies of spectral counts for proteins of previously established high abundance observed under both methanol and succinate conditions were consistent with this body of work. For purposes of validation, the situation is less clear in the case of the abundant outer membrane protein RMQ12418 and several ORFs with unknown functions and high observed spectral count values.
The gene products showing different quantitative trends in the microarrays and the proteomics data may be of interest for further investigation, e.g. discrepancies concerning the C1 transfer enzymes Mch and FhcA, B, C, D; the detection of enolase as methanol-induced on the proteome level in two independent studies, but not in the microarrays; malate dehydrogenase as succinate-induced in the proteome, but not in the array data; and contradictory observations with respect to ferredoxin and proteins involved in iron uptake and siderophore biosynthesis.
Perhaps most importantly in terms of future work, the M. extorquens AM1 proteome reported here demonstrates the feasibility of extending the “bottom up” shotgun proteomics approach to more complex whole cell microbial proteomes in a reproducible and quantitative fashion. This suggests the possibility of further extension to model microbial communities or consortia, while retaining a high degree of proteome coverage for multiple organisms, up to a total of approximately 10,000 proteins. Beyond that level of complexity, the proteomics infrastructure described in Sections 2.1-2.6 would not provide adequate sampling depth for reliable quantitation. A major increase in throughput would be required, which would necessarily require improvements to several aspects of the analytical scheme, including separations, mass spectrometry and subsequent data processing. Fortuitously for the proteomics field, these are, at least in part, solved problems at the technical level. One would thus expect, for example, to see increasing use of multiple mass spectrometers operating in parallel with samples from a single experiment to increase throughput, a tactic that has been used in industrial settings for many years. Of greater concern is the pressing need for development of publicly available proteomics software designed to routinely accommodate such a scale of data acquisition and subsequent processing.
Supplementary Material
Acknowledgements
Funding was provided by the NIH under RO1 GM36296, with additional support provided by the UW College of Engineering. We thank Erik L. Hendrickson for insights and discussion; the UW Department of Microbiology, John A. Leigh and Eugene W. Nester for temporary space and infrastructure support; Greg J. Crowther and Xiaofeng Guo for help with the chemostats; Ludmila Chistoserdova and Marina G. Kalyuzhnaya for their critical review of the manuscript.
Glossary
Abbreviations:
- C1
one carbon
- FDR
false discovery rate
- FNR
false negative rate
- FPR
false positive rate
- H4MPT
tetrahydromethanopterin
- H4F
tetrahydrofolate
- LTQ
Thermo-Finnigan linear ion trap mass spectrometer
- MS1
first dimension of mass spectrometry
- MS2
second dimension of mass spectrometry
- MudPIT
multidimensional protein identification technology
- nrdb
non-redundant database
- PHB
polyhydroxybutyrate
- PQQ
pyrroloquinoline quinone
References
- [1].Vorholt JA. Cofactor-dependent pathways of formaldehyde oxidation in methylotrophic bacteria. Arch. Microbiol. 2002;178:239–249. doi: 10.1007/s00203-002-0450-2. [DOI] [PubMed] [Google Scholar]
- [2].Anthony C. The Biochemistry of Methylotrophs. Academic Press; New York: 1982. [Google Scholar]
- [3].Lidstrom ME. In: Methane and Methanol Utilizers. Murrell JC, Dalton H, editors. Plenum; New York: 1992. pp. 183–206. [Google Scholar]
- [4].Taylor IJ, Anthony C. A biochemical basis for obligate methylotrophy: Properties of a mutant of Pseudomonas AM1 lacking 2-oxoglutarate dehydrogenase. J. Gen. Microbiol. 1976;93:259–265. doi: 10.1099/00221287-93-2-259. [DOI] [PubMed] [Google Scholar]
- [5].Lidstrom ME. In: The Prokaryotes. 3rd edition. Stackebrandt E, editor. Springer; New York: 2001. pp. 223–244. [Google Scholar]
- [6].Van Dien SJ, Okubo Y, Hough MT, Korotkova N, et al. Reconstruction of C3 and C4 metabolism in Methylobacterium extorquens AM1 using transposon mutagenesis. Microbiology. 2003;149:601–609. doi: 10.1099/mic.0.25955-0. [DOI] [PubMed] [Google Scholar]
- [7].Chistoserdova L, Chen S-W, Lapidus A, Lidstrom ME. Methylotrophy in Methylobacterium extorquens AM1 from a genomic point of view. J. Bacteriol. 2003;185:2980–2987. doi: 10.1128/JB.185.10.2980-2987.2003. [DOI] [PMC free article] [PubMed] [Google Scholar]
- [8].Corpe WA, Basile DV. Methanol-utilizing bacteria associated with green plants. Dev. Ind. Microbiol. 1982;23:483–493. [Google Scholar]
- [9].Corpe WA, Rheem S. Ecology of the methylotrophic bacteria on living leaf surfaces. FEMS Microbiol. Lett. 1989;62:243–249. [Google Scholar]
- [10].Sy A, Timmers ACJ, Knief C, Vorholt JA. Methylotrophic metabolism is advantageous for Methylobacterium extorquens during colonization of Medicago truncatula under competitive conditions. Appl. Environ. Microb. 2005;71:7245–7252. doi: 10.1128/AEM.71.11.7245-7252.2005. [DOI] [PMC free article] [PubMed] [Google Scholar]
- [11].Van Dien SJ, Lidstrom ME. Stoichiometric model for evaluating the metabolic capabilities of the facultative methylotroph Methylobacterium extorquens AM1, with application to reconstruction of C3 and C4 metabolism. Biotech. Bioeng. 2002;78:296–312. doi: 10.1002/bit.10200. [DOI] [PubMed] [Google Scholar]
- [12].Marx CJ, Van Dien SJ, Lidstrom ME. Flux analysis uncovers key role of functional redundancy in formaldehyde metabolism. Plos Biol. 2005;3:244–253. doi: 10.1371/journal.pbio.0030016. [DOI] [PMC free article] [PubMed] [Google Scholar]
- [13].Gourion B, Rossignol M, Vorholt JA. A proteomic study of Methylobacterium extorquens reveals a response regulator essential for epiphytic growth. Proc. Natl. Acad. Sci. USA. 2006;103:13186–13191. doi: 10.1073/pnas.0603530103. [DOI] [PMC free article] [PubMed] [Google Scholar]
- [14].Guo X, Lidstrom ME. Metabolite profiling analysis of Methylobacterium extorquens AM1 by comprehensive two-dimensional gas chromatography coupled with time-of-flight mass spectrometry. Biotech. Bioeng. 2008;99:929–940. doi: 10.1002/bit.21652. [DOI] [PubMed] [Google Scholar]
- [15].Laukel M, Rossignol M, Borderies G, Völker U, Vorholt JA. Comparison of the proteome of Methylobacterium extorquens AM1 grown under methylotrophic and nonmethylotrophic conditions. Proteomics. 2004;4:1247–1264. doi: 10.1002/pmic.200300713. [DOI] [PubMed] [Google Scholar]
- [16].Okubo Y, Skovran E, Guo X, Sivam D, Lidstrom ME. Implementation of microarrays for Methylobacterium extorquens AM1. Omics. 2007;11:325–340. doi: 10.1089/omi.2007.0027. [DOI] [PubMed] [Google Scholar]
- [17].Washburn MP, Wolters D, Yates JR., 3rd Large-scale analysis of the yeast proteome by multidimensional protein identification technology. Nat. Biotechnol. 2001;19:242–247. doi: 10.1038/85686. [DOI] [PubMed] [Google Scholar]
- [18].Washburn MP, Ulaszek R, Deciu C, Schieltz DM, Yates JR., 3rd Analysis of quantitative proteomic data generated via multidimensional protein identification technology. Anal. Chem. 2002;74:1650–1657. doi: 10.1021/ac015704l. [DOI] [PubMed] [Google Scholar]
- [19].Washburn MP, Ulaszek RR, Yates JR., 3rd Reproducibility of quantitative proteomic analyses of complex biological mixtures by multidimensional protein identification technology. Anal. Chem. 2003;75:5054–5061. doi: 10.1021/ac034120b. [DOI] [PubMed] [Google Scholar]
- [20].Wolters DA, Washburn MP, Yates JR., 3rd An automated multidimensional protein technology for shotgun proteomics. Anal. Chem. 2001;73:5683–5690. doi: 10.1021/ac010617e. [DOI] [PubMed] [Google Scholar]
- [21].Washburn MP, Koller A, Oshiro G, Ulaszek RR, et al. Protein pathway and complex clustering of correlated mRNA and protein expression analyses in Saccharomyces cerevisiae. Proc. Natl. Acad. Sci. USA. 2003;100:3107–3112. doi: 10.1073/pnas.0634629100. [DOI] [PMC free article] [PubMed] [Google Scholar]
- [22].Lin D, Alpert AJ, Yates JR., 3rd Multidimensional protein identification technology as an effective tool for proteomics. Amer. Genom./Proteom. Technol. 2001;1:38–46. [Google Scholar]
- [23].Guo X, Lidstrom ME. Physiological Analysis of Methylobacterium extorquens AM1 continuous cultures. Arch. Microbiol. 2006;186:139–149. doi: 10.1007/s00203-006-0131-7. [DOI] [PubMed] [Google Scholar]
- [24].Bradford MM. A rapid and sensitive method for the quantitation of microgram quantities of protein utilizing the principle of protein-dye binding. Anal. Biochem. 1976;72:248–254. doi: 10.1016/0003-2697(76)90527-3. [DOI] [PubMed] [Google Scholar]
- [25].Xia QW, Wang TS, Park Y, Lamont RJ, Hackett M. Differential quantitative proteomics of Porphyromonas gingivalis by linear ion trap mass spectrometry: Non-label methods comparison, q-values and LOWESS curve fitting. Intl. J. Mass Spectrom. 2007;259:105–116. doi: 10.1016/j.ijms.2006.08.004. [DOI] [PMC free article] [PubMed] [Google Scholar]
- [26].Xia Q, Wang T, Taub F, Park Y, et al. Quantitative proteomics of intracellular Porphyromonas gingivalis. Proteomics. 2007;7:4323–4337. doi: 10.1002/pmic.200700543. [DOI] [PMC free article] [PubMed] [Google Scholar]
- [27].Eng JK, McCormack AL, Yates JR., 3rd An approach to correlate tandem mass-spectral data of peptides with amino-acid-sequences in a protein database. J. Am. Soc. Mass Spectrum. 1994;5:976–989. doi: 10.1016/1044-0305(94)80016-2. [DOI] [PubMed] [Google Scholar]
- [28].Tabb DL, McDonald WH, Yates JR., 3rd DTASelect and Contrast: tools for assembling and comparing protein identifications from shotgun proteomics. J. Proteome Res. 2002;1:21–26. doi: 10.1021/pr015504q. [DOI] [PMC free article] [PubMed] [Google Scholar]
- [29].Peng J, Elias JE, Thoreen CC, Licklider LJ, Gygi SP. Evaluation of multidimensional chromatography coupled with tandem mass spectrometry (LC/LC-MS/MS) for large-scale protein analysis: the yeast proteome. J. Proteome Res. 2003;2:43–50. doi: 10.1021/pr025556v. [DOI] [PubMed] [Google Scholar]
- [30].Elias JE, Gibbons FD, King OD, Roth FP, Gygi SP. Intensity-based protein identification by machine learning from a library of tandem mass spectra. Nat. Biotechnol. 2004;22:214–219. doi: 10.1038/nbt930. [DOI] [PubMed] [Google Scholar]
- [31].Liu H, Sadygov RG, Yates JR., 3rd A model for random sampling and estimation of relative protein abundance in shotgun proteomics. Anal. Chem. 2004;76:4193–4201. doi: 10.1021/ac0498563. [DOI] [PubMed] [Google Scholar]
- [32].Zybailov B, Coleman MK, Florens L, Washburn MP. Correlation of relative abundance ratios derived from peptide ion chromatograms and spectrum counting for quantitative proteomic analysis using stable isotope labeling. Anal. Chem. 2005;77:6218–6224. doi: 10.1021/ac050846r. [DOI] [PubMed] [Google Scholar]
- [33].Gao J, Opiteck GJ, Friedrichs MS, Dongre AR, Hefta SA. Changes in the protein expression of yeast as a function of carbon source. J. Proteome Res. 2003;2:643–649. doi: 10.1021/pr034038x. [DOI] [PubMed] [Google Scholar]
- [34].Xia Q, Hendrickson EL, Wang T, Lamont RJ, et al. Protein abundance ratios for global studies of prokaryotes. Proteomics. 2007;7:2904–2919. doi: 10.1002/pmic.200700267. [DOI] [PMC free article] [PubMed] [Google Scholar]
- [35].Sokal RR, Rohlf FJ. Biometry: the principles and practice of statistics in biological research. 3rd ed. Freeman W. H. and Co.; New York: 1995. pp. 715–724. [Google Scholar]
- [36].Benjamini Y, Hochberg Y,J. Controlling the false discovery rate: a practical and powerful approach to multiple testing. Royal Statist. Soc. Ser. B. 1995;57:289–300. [Google Scholar]
- [37].Storey JD, Tibshirani R. Statistical significance for genome wide studies. Proc. Natl. Acad. Sci. USA. 2003;100:9440–9445. doi: 10.1073/pnas.1530509100. [DOI] [PMC free article] [PubMed] [Google Scholar]
- [38].Sokal RR, Rohlf FJ. Biometry: the principles and practice of statistics in biological research. 3rd ed. Freeman W. H. and Co.; New York: 1995. pp. 352–356. [Google Scholar]
- [39].Hendrickson EL, Xia Q, Wang T, Leigh JA, Hackett M. Comparison of spectral counting and metabolic stable isotope labeling for use with quantitative microbial proteomics. Analyst. 2006;131:1335–1341. doi: 10.1039/b610957h. [DOI] [PMC free article] [PubMed] [Google Scholar]
- [40].Xia Q, Hendrickson EL, Zhang Y, Wang T, et al. Quantitative proteomics of the archaeon Methanococcus maripaludis validated by microarray analysis and real time PCR. Mol. Cell. Proteomics. 2006;5:868–881. doi: 10.1074/mcp.M500369-MCP200. [DOI] [PMC free article] [PubMed] [Google Scholar]
- [41].Souchelnytskyi S. Bridging proteomics and systems biology: what are the roads to be traveled? Proteomics. 2005;5:4123–4137. doi: 10.1002/pmic.200500135. [DOI] [PubMed] [Google Scholar]
- [42].Li L, Li Q, Rohlin L, Kim U, et al. Quantitative proteomic and microarray analysis of the archaeon Methanosarcina acetivorans grown with acetate versus methanol. J. Proteome Res. 2007;6:759–771. doi: 10.1021/pr060383l. [DOI] [PMC free article] [PubMed] [Google Scholar]
- [43].Scherl A, Francois P, Charbonnier Y, Deshusses JM, et al. Exploring glycopeptide-resistance in Staphylococcus aureus: a combined proteomics and transcriptomics approach for the identification of resistance-related markers. BMC genomics. 2006;7:296. doi: 10.1186/1471-2164-7-296. [DOI] [PMC free article] [PubMed] [Google Scholar]
- [44].Vorholt JA, Marx CJ, Lidstrom ME, Thauer RT. Novel formaldehyde-activating enzyme in Methylobacterium extorquens AM1 required for growth on methanol. J. Bacteriol. 2000;182:6645–6650. doi: 10.1128/jb.182.23.6645-6650.2000. [DOI] [PMC free article] [PubMed] [Google Scholar]
- [45].Chistoserdova L, Vorholt JA, Thauer RK, Lidstrom ME. Transfer enzymes and coenzymes linking methylotrophic bacteria and methanogenic archaea. Science. 1998;281:99–102. doi: 10.1126/science.281.5373.99. [DOI] [PubMed] [Google Scholar]
- [46].Chistoserdova L, Crowther GJ, Vorholt JA, Skovran E, et al. Identification of a fourth formate dehydrogenase in Methylobacterium extorquens AM1 and confirmation of the essential role of formate oxidation in methylotrophy. J. Bacteriol. 2007;189:9076–9081. doi: 10.1128/JB.01229-07. [DOI] [PMC free article] [PubMed] [Google Scholar]
- [47].Kalyuzhnaya MG, Lidstrom ME. QscR-mediated transcriptional activation of serine cycle genes in Methylobacterium extorquens AM1. J. Bacteriol. 2005;21:7511–7517. doi: 10.1128/JB.187.21.7511-7517.2005. [DOI] [PMC free article] [PubMed] [Google Scholar]
- [48].Kalyuzhnaya MG, Lidstrom ME. QscR, a LysR-type transcriptional regulator and CbbR homolog, is involved in regulation of the serine cycle genes in Methylobacterium extorquens AM1. J. Bacteriol. 2003;4:1229–1235. doi: 10.1128/JB.185.4.1229-1235.2003. [DOI] [PMC free article] [PubMed] [Google Scholar]
- [49].Stauffer GV. In: Escherichia coli and Salmonella typhimurium: Cellular and molecular biology. Ingraham JL, Low KB, Magasanik B, Schaechter M, Umbarger HE, Neidhardt FC, editors. vol. 1. American Society for Microbiology; Washington, D.C.: 1987. pp. 412–418. [Google Scholar]
- [50].Chistoserdova LV, Lidstrom ME. Genetics of the serine cycle in Methylobacterium extorquens AM1: cloning, sequence, mutation, and physiological effect of glyA, the gene for serine hydroxymethyltransferase. J. Bacteriol. 1994;176:6759–6762. doi: 10.1128/jb.176.21.6759-6762.1994. [DOI] [PMC free article] [PubMed] [Google Scholar]
- [51].Korotkova N, Chistoserdova L, Lidstrom ME. Poly-b-hydroxybutyrate biosynthesis in the facultative methylotroph Methylobacterium extorquens AM1: Identification and mutation of gap11, gap20, and phaR. J. Bacteriol. 2002;184:6174–6181. doi: 10.1128/JB.184.22.6174-6181.2002. [DOI] [PMC free article] [PubMed] [Google Scholar]
- [52].Van Der Rest ME, Frank C, Molenaar D. Functions of the membrane-associated and cytoplasmic malate dehydrogenases in the citric acid cycle of Escherichia coli. J. Bacteriol. 2000;182:6892–6899. doi: 10.1128/jb.182.24.6892-6899.2000. [DOI] [PMC free article] [PubMed] [Google Scholar]
- [53].Molenaar D, Van Der Rest ME, Drysch A, Yücel R. Functions of the Membrane-Associated and Cytoplasmic Malate Dehydrogenases in the Citric Acid Cycle of Corynebacterium glutamicum. J. Bacteriol. 2000;182:6884–6891. doi: 10.1128/jb.182.24.6884-6891.2000. [DOI] [PMC free article] [PubMed] [Google Scholar]
- [54].Dupuis A, Darrouzet E, Duborjal H, Pierrard B, et al. Distal genes of the nuo operon of Rhodobacter capsulatus equivalent to the mitochondrial ND subunits are all essential for the biogenesis of the respiratory NADH-ubiquinone oxidoreductase. Mol. Microbiol. 1998;28:531–541. doi: 10.1046/j.1365-2958.1998.00814.x. [DOI] [PubMed] [Google Scholar]
Associated Data
This section collects any data citations, data availability statements, or supplementary materials included in this article.