

Abstract
Background and purpose:
Increases in intracellular cyclic AMP (cAMP) augment the release/secretion of glucagon-like peptide-1 (GLP-1). As cAMP is hydrolysed by cAMP phosphodiesterases (PDEs), we determined the role of PDEs and particularly PDE4 in regulating GLP-1 release.
Experimental approach:
GLP-1 release, PDE expression and activity were investigated using rats and GLUTag cells, a GLP-1-releasing cell line. The effects of rolipram, a selective PDE4 inhibitor both in vivo and in vitro and stably overexpressed catalytically inactive PDE4D5 (D556A-PDE4D5) mutant in vitro on GLP-1 release were investigated.
Key results:
Rolipram (1.5 mg·kg−1 i.v.) increased plasma GLP-1 concentrations approximately twofold above controls in anaesthetized rats and enhanced glucose-induced GLP-1 release in GLUTag cells (EC50∼1.2 nmol·L−1). PDE4D mRNA transcript and protein were detected in GLUTag cells using RT-PCR with gene-specific primers and Western blotting with a specific PDE4D antibody respectively. Moreover, significant PDE activity was inhibited by rolipram in GLUTag cells. A GLUTag cell clone (C1) stably overexpressing the D556A-PDE4D5 mutant, exhibited elevated intracellular cAMP levels and increased basal and glucose-induced GLP-1 release compared with vector-transfected control cells. A role for intracellular cAMP/PKA in enhancing GLP-1 release in response to overexpression of D556A-PDE4D5 mutant was demonstrated by the finding that the PKA inhibitor H89 reduced both basal and glucose-induced GLP-1 release by 37% and 39%, respectively, from C1 GLUTag cells.
Conclusions and implications:
PDE4D may play an important role in regulating intracellular cAMP linked to the regulation of GLP-1 release.
British Journal of Pharmacology (2009) 157, 633–644; doi:10.1111/j.1476-5381.2009.00194.x; published online 9 April 2009
Keywords: cAMP, dominant negative, glucagon-like peptide-1, GLUTag cells, H89, PDE4D4, phosphodiesterase, rolipram
Introduction
Glucagon-like peptide-1 (GLP-1) is a major incretin and potent insulinotropic agent that increases insulin secretion from the pancreatic islet β-cells in a glucose-dependent manner (Holz and Habener, 1992). GLP-1 also suppresses gastric motility (Nauck et al., 1997), promotes satiety (Flint et al., 1998) and may possess insulinomimetic actions on glucose disposal (Egan et al., 2002). Therefore, GLP-1-based therapy provides a potential treatment of diabetes mellitus, based on drug-enhanced release of GLP-1. GLP-1 is released by enteroendocrine L cells in response to dietary nutrients, hormonal and neuronal signals (Reimann et al., 2006). The ATP-sensitive K+ channel-dependent pathway (Reimann and Gribble, 2002) and sodium glucose cotransporter (Gribble et al., 2003) may play a role in glucose sensing in GLUTag cells. Agents that increase intracellular cyclic AMP (cAMP), such as forskolin, 3-isobutyl-1-methylxanthine (IBMX) (Brubaker et al., 1998; Reimer et al., 2001; Reimann and Gribble, 2002; Simpson et al., 2007) and pituitary adenylate cyclase-activating polypeptide (PACAP) (Simpson et al., 2007), have also been shown to increase the expression and release of GLP-1. Moreover, agonists at the G protein-coupled receptor GPR119 that increase cAMP in both the pancreatic islet β-cell and the intestinal L cell are being developed for the treatment of type 2 diabetes (Overton et al., 2008; Semple et al., 2008). Whether cAMP enhances GLP-1 secretion through protein kinase A (PKA) or Epac signalling is uncertain, although recent work suggests that PKA mediates effects on GLP-1 secretion, whereas Epac mediates its effects on synthesis (Islam et al., 2009). These findings provide a rationale for investigating the role of cAMP phosphodiesterases (PDE) in regulating GLP-1 release.
PDEs represent a large family of enzymes that hydrolyse cAMP and cGMP to 5′-AMP and 5′-GMP respectively. At least 25 PDE genes have been identified and cloned. By alternative mRNA splicing and/or the use of multiple promoters, a single PDE gene can generate variant products in a tissue-specific manner. In this manner, 50 different PDE variants are produced from various PDE genes in mammalian cells (Beavo and Brunton, 2002; Lugnier, 2006; Conti and Beavo, 2007). The PDE enzymes are grouped into 11 families, which differ in their substrate selectivity (cAMP, cGMP), kinetics, allosteric regulation, tissue distribution, subcellular localization and susceptibility to pharmacological inhibition (Pyne and Furman, 2003). The PDE3 family is represented by two genes, A and B, where we and others have shown that PDE3B plays an important role in regulating glucose-induced insulin release from islet β-cells (Shafiee-Nick et al., 1995; Zhao et al., 1997; Ahmad et al., 2000; Härndahl et al., 2002; 2004; Furman and Pyne, 2006; Walz et al., 2007). The PDE4 family is encoded by four genes (A, B, C and D) that generate over 20 different isoforms (Conti et al., 2003; Houslay and Adams, 2003). In many cells these underpin important aspects of compartmentalized cAMP signalling due to the ability of particular isoforms to interact with specific signalling scaffold proteins to regulate the action of functional signalosomes (Houslay et al., 2007).
Here we set out to establish whether PDEs are also involved in regulating GLP-1 release from L cells. We have combined in vivo measurement of GLP-1 release with the use of the L cell model, GLUTag. The study of L cells is hampered by the low abundance of these cells in the intestine. Therefore, the development of GLP-1-secreting cell lines, such as GLUTag, STC-1 and NCI-H716, has provided a model for the study of L cell function. The GLUTag cell line is an established and widely used model of L cell for studying GLP-1 release and exhibits sensitivity to a range of physiological stimuli (Drucker et al., 1994; Brubaker et al., 1998; Reimann and Gribble, 2002; Gribble et al., 2003). This cell line was originally derived from a colonic tumour in a transgenic mouse expressing SV40 large T antigen under the control of the proglucagon promoter (Drucker et al., 1994).
Methods
Cell culture
GLUTag cells were maintained in Dulbecco's modified Eagle's medium containing 5.5 mmol·L−1 glucose supplemented with 10% (v/v) foetal calf serum, 2 mmol·L−1 glutamine, penicillin (100 IU·mL−1), streptomycin (100 µg·mL−1) and cultured in a humidified atmosphere containing 5% CO2/air at 37°C and pH 7.4.
RT-PCR
RT-PCR was performed using the gene-specific primer pairs, as shown in Table 1. The PCR reaction was carried out in a Perkin Elmer 480 Thermal Cycler using the following typical protocol optimum for each primer pair: 95°C, 5 min (initial denaturation) and 35 cycles of 95°C, 1 min 30 s (denaturation), 55°C, 30 s (annealing) and 68°C, 1 min 40 s (extension), followed by 68°C, 5 min (final extension).
Table 1.
The sequence of primers used in the RT-PCR experiments
| Primers | Nucleotide sequences |
|---|---|
| PDE3A | 5′-TCAACGGGCCTGCTAAATGTAAGG-3′ (forward) |
| 5′-TTCTTCCGGGTCATCAGTGTCTCC-3′ (reverse) | |
| PDE3B | 5′-TGAAGAAGCAACCCTGGGTCTACC-3′ (forward) |
| 5′-CAGTGAGGTGGTGCATTAGTTGGC-3′ (reverse) | |
| PDE4 | 5′-KCYGAYGTGGCVTAYCACAACARC-3′ (forward) |
| 5′-TGNACNAGRTCDGCCCABGTCTC-3′ (reverse) | |
| Legend: | |
| N = A + C + T + G; R = A + G; Y = C + T; K = T + G; | |
| B = T + C + G; D = A + T + G; V = A + C + G | |
| PDE10A | 5′-CGCTGCTCTTCGGCTCCG-3′ (forward) |
| 5′-TCTCCCGTTCTT CCCACTTGACC-3′ (reverse) | |
| PBGD | 5′-ATGTCCGGTAACGGCGGC-3′ (forward) |
| 5′-CAGCA TCGCTACCACAGTGTC-3′ (reverse) | |
| pcDNA3 | 5′-AGGAAAGGACAGTGGGAGTG-3′ (reverse) |
| used in combination with PDE4 (forward) |
Expression of PDEs in mouse intestinal L cells
BAC transgenic mice, 2–6 months old, expressing the yellow fluorescent protein, Venus, under the control of the proglucagon promoter, were killed by cervical dislocation and the gut collected into ice-cold Leibovitz-15 (L-15) medium. The small intestine plus colon was rinsed, chopped into 1–2 mm pieces and digested twice for 30 min with 1 mg·mL−1 collagenase-XI in calcium-free Hank's balanced salt solution at 37°C. Resulting cell suspensions were filtered through 70 µm nylon cell strainers, centrifuged at 300× g for 5 min and pellets re-suspended in L-15 supplemented with 10% foetal bovine serum. L cells, characterized by a high yellow fluorescence, were sorted using a MoFlo Beckman Coulter Cytomation sorter, at numbers of up to 30 000 into 1 mL RNAlater (Reimann et al., 2008). Extracted mRNA was subjected to two rounds of linear amplification before loading onto Affymetrix Murine 430 2.0 whole-genome expression arrays.
SDS/PAGE and Western blot analysis
GLUTag cells were lysed in an appropriate volume of SDS sample buffer. For separation into high-speed supernatant and pellet fractions, GLUTag cell homogenate in isotonic sucrose buffer, supplemented with 0.1 mmol·L−1 phenylmethanesulphonyl fluoride, 2 mmol·L−1 benzamidine, 20 µg·mL−1 aprotinin and 10 µg·mL−1 leupeptin, was centrifuged at 20 000× g at 4°C for 10 min. The pellet was then re-suspended in isotonic sucrose buffer. Appropriate volume of SDS sample buffer was added to both the high-speed supernatant (S) and pellet fractions (P). Samples were subjected to SDS-PAGE electrophoresis and blotted onto nitrocellulose membranes. Western blot analysis was then performed using PDE selective antibodies. Anti-PDE4D, anti-PDE4D4 and anti-PDE4D5 antibodies have been described previously (Bolger et al., 1997). Immunoreactive proteins were detected using appropriate alkaline phosphate-conjugated secondary antibodies. The blots were exposed to X-Omat film (Kodak) for visualization.
Immunofluorescence staining
Cells grown on sterilized glass coverslips were fixed using 3.7% (v/v) paraformaldehyde in phosphate-buffered saline (PBS) and then made permeable with 0.1% Triton X-100 (v/v) and incubated in blocking solution [5% BSA (w/v) and 1% (v/v) serum in PBS] for 30 min at room temperature. This was followed by overnight incubation at 4°C with primary antibody. Cells were then washed with PBS twice and further incubated with appropriate secondary antibodies conjugated with FITC, TRITC or Texas red for 1 h at room temperature in the dark. The coverslips were then washed twice with PBS before being mounted on glass slides using Vectashield mounting medium containing DAPI. The cells were visualized under a Nikon E600 epifluorescence microscope using objective oil lens and cell images were taken and processed using Metamorph Offline Version 4.6r3 software (Universal Imaging Corporation).
PDE assay
The activity of cAMP PDE was measured according to the method of Thompson and Appleman (1971) and as described in detail previously (Ahmad et al., 2000).
Measurement of cAMP
Intracellular cAMP level was measured using Amersham cAMP Biotrak Enzymeimmunoassay kit, as described previously by Simpson et al. (2007). The cAMP level was normalized to the cAMP level in the absence of test reagents measured in parallel or normalized by number of cells in wells plated in parallel with those lysed for cAMP assay.
GLP-1 release from GLUTag cells
GLP-1 release experiments were performed as previously described by Reimann and Gribble (2002). Briefly, GLUTag cells were plated on Matrigel-coated 24-well cell culture plates incubated in nutrient-free test buffer supplemented with 0.1 mmol·L−1 Diprotin A and 0.1% (w/v) BSA. Experiments were performed by incubating the cells with or without test reagents in the presence or absence of glucose or forskolin in the same solution for 2 h at 37°C. At the end of the incubation period, medium was collected and GLP-1 was assayed using an ELISA specific for GLP-1(7-36) amide and GLP-1(7-37). Where possible, data were normalized to the baseline and presented as ‘% relative to control cells’ (i.e. cells that were incubated in the absence of test reagent in each experiment), to avoid the requirement of cell counting, which introduces errors. However, this was not possible when comparing basal GLP-1 secretion of wild-type (WT) cells and C1 and absolute values were used to express the data from these experiments.
Measurement of plasma GLP-1 concentrations in rats
All animal work was undertaken in accordance with the Animals (Scientifc Procedures) Act 1986. Male Wistar rats (∼250 g) bred in the Biological Procedures Unit and maintained on standard laboratory diet and a 12 h light–dark cycle, were deprived of food overnight and then re-fed 1 h before anaesthesia (pentobarbitone 60 mg·kg−1 i.p.). The trachea was cannulated and the animals were allowed to breathe spontaneously. Cannulae were placed in the right femoral vein for i.v. administration and the right common carotid artery for blood sampling. A blood sample (0.4 mL) was removed using a heparin-treated syringe. Rolipram (1.5 mg·kg−1) or dimethyl sulfoxide (0.5 mL·kg−1) was administered by slow i.v. injection. Blood samples (0.4 mL) were removed at 10, 20 and 30 min after injection and dispensed into pre-cooled 1.5 mL Eppendorf tubes containing diprotinin-A to give 100 µmol·L−1 diprotinin-A per sample. All samples were stored on ice and centrifuged as soon as possible at 4°C. Plasma was removed and stored frozen (−70°C) until assayed using ELISA specific for GLP-1(7-36) amide and GLP-1(7-37) (Linco GLP-1 active ELISA-kit).
Transfection with catalytically inactive D556A-PDE4D5 mutant
D556A-PDE4D5 is catalytically inactive, with a single point mutation (D556→A) of a conserved aspartate group in the catalytic site. This disrupts interaction with the Zn2+ and Mg2+ ions essential for catalysis (Baillie et al., 2003; Lynch et al., 2005). GLUTag cells were transfected with the D556A-PDE4D5 plasmid construct, containing a neomycin-resistance gene in its plasmid vector and selected in 0.9 mg·mL−1 geneticin (G418) for stable D556A-PDE4D5-overexpressing clones.
Materials
L-15 medium was obtained from PAA (UK); nylon cell strainers, BD Falcon (UK); RNAlater, Ambion (UK). Anti-PDE7A and anti-PDE10A antibodies were purchased from FabGennix Inc. International (USA), and anti-PDE3B antibody was a gift from Professor Joseph A. Beavo (University of Washington, USA) (Zhao et al., 1997). The cAMP Biotrak Enzymeimmunoassay kit was obtained from GE Healthcare (Little Chalfort, UK); the Linco GLP-1 active ELISA-kit was from Biogenesis (Poole UK). Org 9935 (4,5-dihydro-6-(5,6-dimethoxy-benzo[b]-thien-2-yl-methyl-1(2H)-pyridazinone) was obtained from Organon Laboratories (Newhouse, Lanarkshire).
Statistical analysis
Results are presented as means ± SEM. Statistical significance was tested by Student's t-test or anova, where appropriate, using a threshold for significance of P < 0.05. The Affymetrix gene array data were analysed by robust multiarray average analysis (Irizarry et al., 2003).
Results
Rolipram enhances glucose-induced GLP-1 release from GLUTag cells
The cAMP PDE expression profile in mouse intestinal L cells determined using Affymetrix gene chip analysis is shown in Table 2. The relatively high abundance of PDE4D in L cells provided a strong rationale for testing the effect of rolipram, one of the most selective PDE4 inhibitors available, on GLP-1 secretion in vivo. Rolipram induced an approximately twofold increase in plasma GLP-1 levels 10 min post administration to fasted rats that had been re-fed 1 h prior to anaesthesia (Figure 1A). We therefore further investigated the mechanisms by which PDE4 regulates GLP-1 release in vitro using GLUTag cells. Exposure of GLUTag cells to 10 mmol·L−1 glucose increased GLP-1 release by approximately threefold compared with cells incubated in control buffer alone. Incubation with rolipram did not significantly modify basal GLP-1 release in the absence of nutrient (data not shown), but maximally increased GLP-1 release by 169.9 ± 3.1% versus control (P < 0.001) in the presence of 10 mmol·L−1 glucose, with an EC50 of ∼1.2 nmol·L−1 (Figure 1B).
Table 2.
Expression of genes for cyclic AMP phosphodiesterase (PDE) isoforms in mouse intestinal L cells (Affymetrix)
| PDE isoform | Expression (arbitrary units) |
|---|---|
| PDE1A | 15.3 ± 0.6 |
| PDE1B | 57.5 ± 1.3 |
| PDE1C | 42.0 ± 1.5 |
| PDE2A | 109.5 ± 13.9 |
| PDE3A | 47.6 ± 1.8 |
| PDE3B | 578.9 ± 99.7 |
| PDE4A | 49.8 ± 0.4 |
| PDE4B | 16.9 ± 0 |
| PDE4D | 221.3 ± 21 |
| PDE7A | 142.2 ± 14.6 |
| PDE8A | 218.6 ± 53 |
| PDE8B | 117.9 ± 21 |
| PDE10A | 62.9 ± 0.2 |
| PDE11A | 31.4 ± 0.5 |
Figure 1.
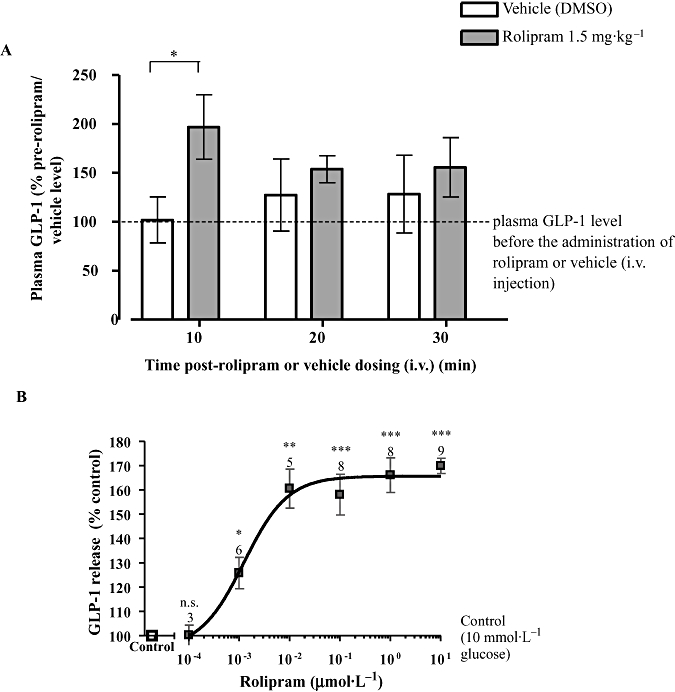
The effect of glucose and rolipram on glucagon-like peptide-1 (GLP-1) release. (A) The effect of rolipram (1.5 mg·kg−1, i.v.) on plasma GLP-1 concentrations in anaesthetized rats, deprived of food overnight and re-fed 1 h prior to anaesthesia. The data were obtained from eight to nine rats and presented as the percentage of plasma GLP-1 level before the administration of rolipram or dimethyl sulfoxide (DMSO) (defined as 100%; the absolute values for plasma GLP-1 concentrations in control rats were 2.4 ± 0.37 pmol·L−1; n= 17). (B) GLUTag cells were incubated in the presence of varying concentrations of rolipram with 10 mmol·L−1 glucose. The number of wells, from at least two separate experiments, is indicated above each symbol. Statistical significance was assessed relative to GLP-1 release in the presence of 10 mmol·L−1 glucose without rolipram (B), using Student's one-sample t-test: ***P < 0.001, **P < 0.01, *P < 0.05, n.s.P > 0.05.
PDE4 isoforms are expressed in GLUTag cells
We used RT-PCR with gene-specific primers and Western blotting with a specific PDE4D antibody to determine whether GLUTag cells express PDE4. RT-PCR analysis with PDE4-specific primers designed to amplify the catalytic domain (Koyanagi et al., 1998) of all PDE4 isoforms demonstrated the expression of PDE4 (Figure 2A). Nucleotide sequencing of the 704 bp PCR product exhibited nucleotide sequence homology with mouse PDE4D (Genebank accession number NM_011056.2). All of the sequenced nucleotides (494 bp) of PDE4 amplicon matched the mouse PDE4D sequence, with the exception of substitution of ‘T’ in mouse PDE4D (base-1603) with ‘C’ in the amplicon (base-238), resulting in a silent mutation of TTG to CTG, both coding for leucine; no PDE4A, B or C mRNA transcript was amplified by RT-PCR. Western blot analysis using anti-PDE4D antibody immunostained two major proteins with Mr = 119 and 105 kDa in the high-speed supernatant fraction (S) containing cytosol and that co-migrated on SDS-PAGE with PDE4D4 and PDE4D5, respectively, which had been ectopically expressed in HEK 293 cells (Figure 2B). Both immunoreactive proteins were also detected in the high-speed pellet (P) fraction of GLUTag cells (Figure 2B). A very faint band corresponding to PDE4D3 was also present, which may indicate a very low expression of this isoform in the cytosol, but this remains to be confirmed. Western blot analysis with a PDE4D4-specific antibody immunostained a protein with an Mr = 119 kDa in the high-speed supernatant fraction (S) and pellet (P) fractions, thereby suggesting the expression of this isoform in GLUTag cells (Figure 2C). Further evidence that GLUTag cells express PDE4D was obtained by immunofluoresence imaging analysis. These experiments demonstrated anti-PDE4D antibody staining in GLUTag cells (Figure 2D). A similar immunostaining pattern was observed when GLUTag cells were stained with anti-PDE4D4 and anti-PDE4D5 antibodies (Figure 2D). No such immunostaining was observed when secondary antibody alone was used (Figure 2D). This immunoreactivity specific to PDE4 indicates its protein expression and was correlated with results showing that the selective PDE4 inhibitor rolipram significantly inhibited PDE activity in high-speed supernatant and pellet fractions in a concentration-dependent manner (Figure 2E).
Figure 2.
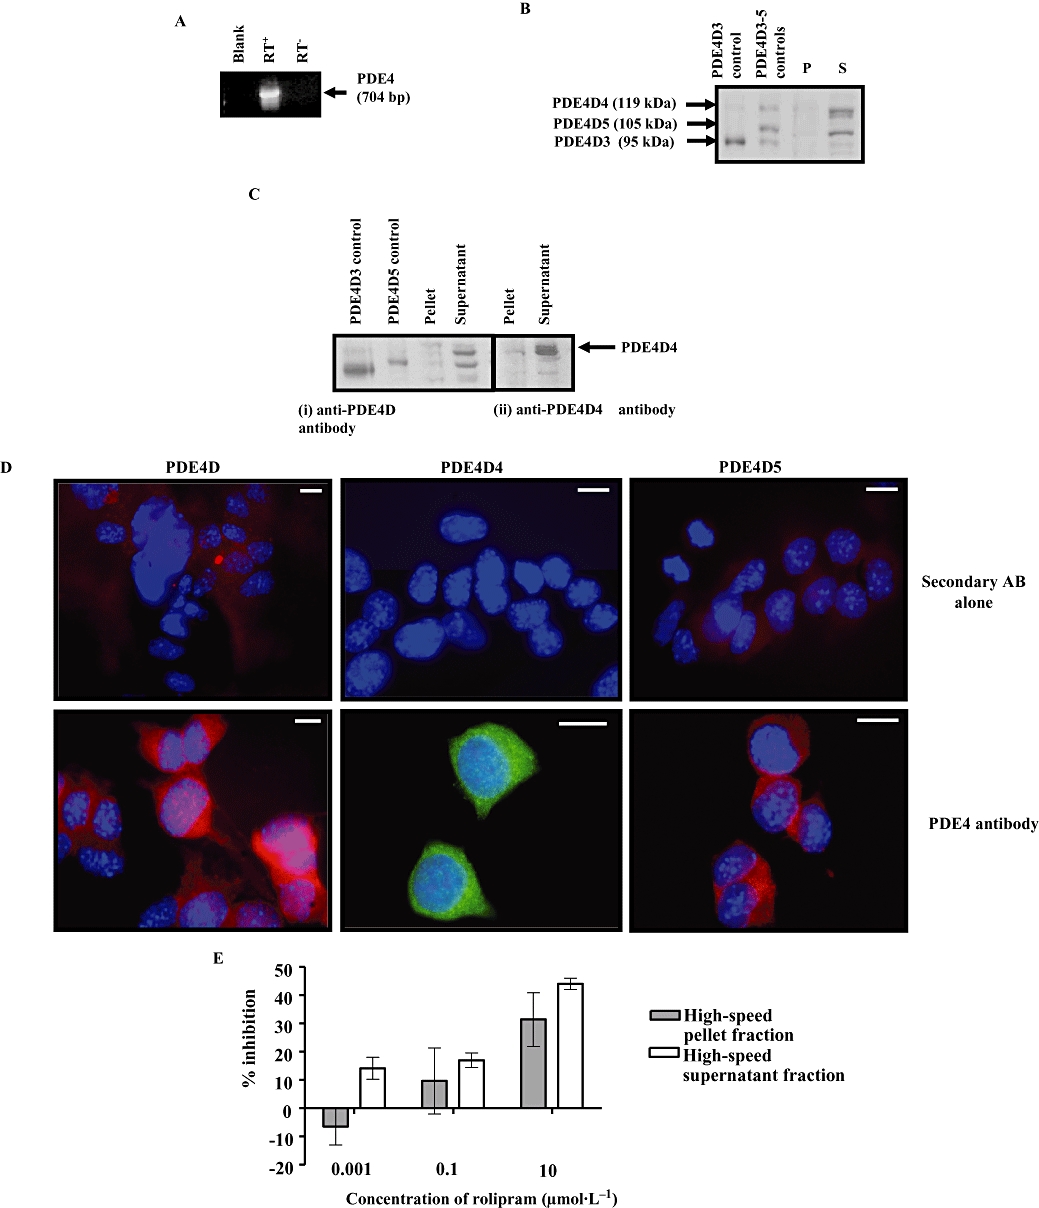
Phosphodiesterase (PDE)4 isoforms in GLUTag cells. (A) RT-PCR was used to amplify PDE4 mRNA transcript. A negative control with omission of reverse transcriptase was included (RT−). Blank is the negative control for PCR without cDNA. (B) Western blot analysis was performed on high-speed pellet (P) and supernatant (S) fractions of GLUTag cell with anti-PDE4D antibody. The positive control for PDE4D3–5 is from lysates of HEK cells overexpressing each isoform. (C) Western blot probed with anti-PDE4D antibody and then re-probed using anti-PDE4D4 antibody. A 119 kDa protein corresponding to PDE4D4 was detected; protein loading in each case was 10 µg per lane. (D) Immunofluorescence staining of GLUTag cells with indicated anti-PDE4 antibodies showing the subcellular localization of PDE4D, PDE4D4 and PDE4D5. GLUTag cells grown on coverslips were fixed, made permeable and immunostained with (lower panel) or without (upper panel) the indicated primary antibody. Scale bar = 10 µm. (E) The concentration-dependent inhibition of the cyclic AMP-PDE activity in GLUTag cell by rolipram. Each value is the mean ± SEM of triplicate observations from five separate cell preparations.
Rolipram elevates intracellular cAMP in GLUTag cells
Treatment of GLUTag cells with 10 µmol·L−1 rolipram, in the presence of glucose, significantly increased intracellular cAMP levels in GLUTag cells compared with controls (P < 0.05, Figure 3A). To obtain further evidence for the role of cAMP in mediating the effects of rolipram on GLP-1 release, we treated GLUTag cells with agents that elevate intracellular cAMP, such as forskolin, an adenylyl cyclase activator, and which we demonstrated here increased GLP-1 release in a concentration-dependent manner, to a maximum of 892.3 ± 78.6% versus control (P < 0.001) in the absence of nutrient (Figure 3B). Moreover, pre-incubation of GLUTag cells in the presence of the PKA inhibitor, H89 (1 µmol·L−1) for 24 h, significantly reduced basal and forskolin-stimulated GLP-1 synthesis/release, supporting a role for PKA (Figure 3C).
Figure 3.
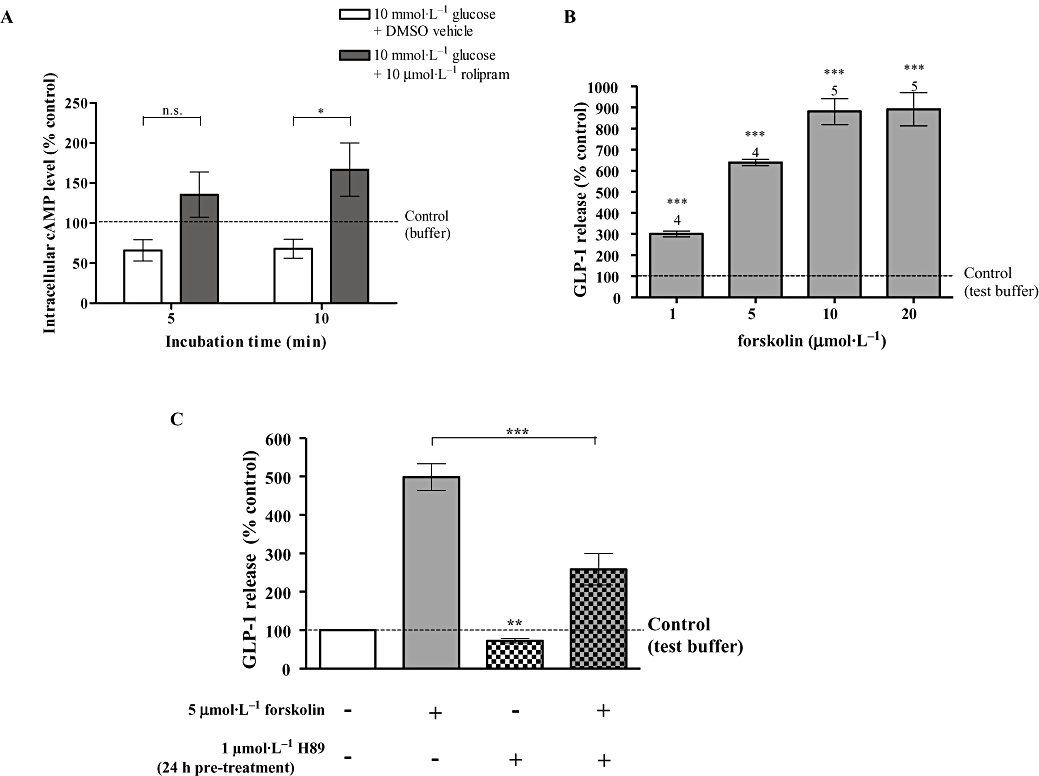
Role of intracellular cyclic AMP (cAMP) in regulating glucagon-like peptide-1 (GLP-1) release. (A) The effect of rolipram on intracellular cyclic AMP levels in GLUTag cells in the presence of 10 mmol·L−1 glucose. The data were obtained from six wells from at least two separate experiments and normalized to that measured in control cells incubated in test buffer alone. Statistical significance was assessed by two-way anova, followed by Bonferroni post-test: *P < 0.05, n.s.P > 0.05. (B) The effect of forskolin (5 min) on GLP-1 release. The number of wells, from at least two separate experiments, is indicated above column. Statistical significance was assessed relative to secretion in test buffer without the respective test reagents, using Student's one-sample t-test: ***P < 0.001, **P < 0.01, *P < 0.05, n.s.P > 0.05. (C) The effect of H89 (1 µmol·L−1, 24 h) on forskolin (5 µmol·L−1, 5 min)-stimulated GLP-1 release. The data were obtained from eight to nine wells from at least two separate experiments and are presented as the percentage relative to the secretion of untreated cells incubated in test buffer alone, measured in parallel in the same experiment and normalized by post-incubation cell count. Statistical significance was assessed with one-way anova, followed by Tukey's multiple comparison test if overall P < 0.05. Student's one-sample t-test was used to assess the statistical significance of H89 pre-treatment on basal GLP-1 secretion relative to that of untreated cells incubated in test buffer alone (indicated above column). ***P < 0.001, **P < 0.01, *P < 0.05, n.s.P > 0.05.
Stable transfection of catalytically inactive D556A-PDE4D5 mutant
Having established a potential role for PDE4 in regulating GLP-1 release using pharmacological inhibition of PDE4 activity with rolipram, we used a molecular biological approach to independently validate these findings. In this respect, we created a GLUTag cell clone stably overexpressing catalytically inactive PDE4D5 (D556A-PDE4D5) mutant.
The C1 geneticin-resistant transfected GLUTag cell clone demonstrated increased D556A PDE4D5 mRNA transcript versus WT cells, detected using RT-PCR with PDE4 forward and pcDNA3 reverse primer pairs amplified a product that contained the D556A mutation in recombinant PDE4D5 cDNA (Figure 4A), indicating the presence of D556A-PDE4D5 cDNA in C1 cells. The C1 clone demonstrated the largest increase in D556A-PDE4D5 transcript and was therefore selected for further study. Importantly, Western blot analysis with specific anti-PDE4D antibody demonstrated increased expression of a 105 kDa immunoreactive protein corresponding to the D556A PDE4D5 mutant in C1 compared with stable vector-transfected (VC) and WT cells (Figure 4B).
Figure 4.
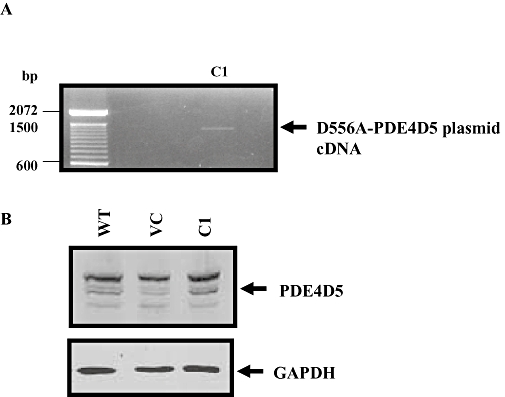
Overexpression of D556A-phosphodiesterase (PDE)4D5 mutant in clone C1. (A) Detection of D556A-PDE4D45 mutant cDNA using RT-PCR with PDE4 forward and pcDNA3 reverse primer pairs. (B) Western blot analysis of cell homogenates of wild type (WT), vector-transfected (VC) and C1 using anti-PDE4D and anti-GAPDH antibodies. The GAPDH-immunoreactive band indicated the relative amount of protein loading.
The C1 clone overexpressing D556A-PDE4D5 mutant demonstrated a marked elevation in basal GLP-1 release versus WT GLUTag cells (pmol per 106 cells 2 h−1: WT 0.114 ± 0.016; C1 0.427 ± 0.028, P < 0.0001) (Figure 5). The percentage increase in GLP-1 release following glucose and forskolin stimulation in C1 was similar to that observed in WT (Figure 5). No significant difference was observed in total cAMP PDE activity of WT, VC and C1 [total cAMP PDE activity (pmol·min−1·mg−1): WT 125.3 ± 4.4; VC 114.9 ± 18.0; C1 137.5 ± 3.1, one-way anova: P > 0.05]. Moreover, the rolipram-sensitive PDE activity in C1 was also found to be not significantly different from the rolipram-sensitive activity in WT and VC [inhibition by rolipram (%): WT 31.83 ± 3.84; VC 28.10 ± 7.61; C1 38.89 ± 1.65, one-way anova: P > 0.05].
Figure 5.
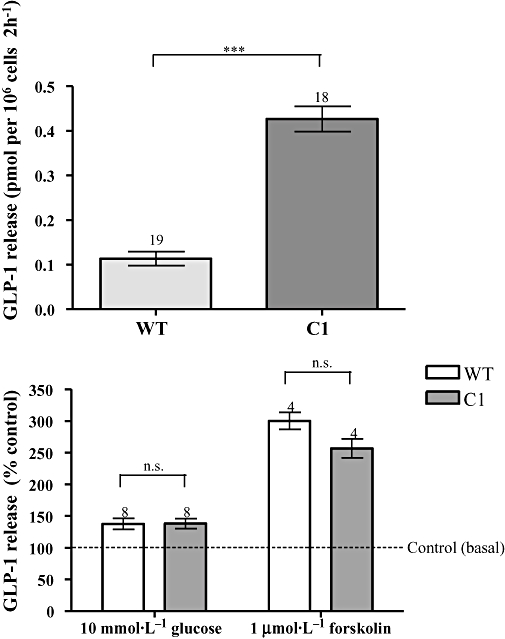
Glucagon-like peptide-1 (GLP-1) release and cyclic AMP-phosphodiesterase (PDE) activity in clone C1. Upper panel – the increased basal GLP-1 release from C1 versus wild type (WT). The data were obtained from 18 to 19 wells from more than two experiments. Statistical significance was assessed with Student's t-test, **P < 0.001. Also shown (lower panel) is the % increase in GLP-1 release in C1 and WT in response to 10 mmol·L−1 glucose or 1 µmol·L−1 forskolin for 2 h. The number of wells, from at least two separate experiments, is indicated above column. Each value is expressed as % of respective control (basal secretion) in the same experiment. Statistical significance between C1 and WT in the % increase in GLP-1 secretion resulting from glucose and forskolin stimulation was assessed by Student's t-test, n.s.P > 0.05.
Role of cAMP in regulating GLP-1 release from C1 GLUTag cells
The basal intracellular cAMP level of C1 was found to be significantly higher than that of WT, whereas no significant difference was observed between VC and WT [cAMP content (fmol per 104 cells): WT 101.1 ± 16.1; VC 99.0 ± 20.7; C1 173.6 ± 25.6]. Similarly, the intracellular cAMP level of C1 was found to be significantly higher than that of WT in the presence 10 mmol·L−1 glucose, whereas no significant difference was observed between VC and WT [cAMP content (fmol per 104 cells): WT 93.6 ± 15.4; VC 117.3 ± 14.2; C1 199.8 ± 29.2]. Elevating the glucose concentration did not significantly modify cAMP levels either in the WT cells or in C1.
In order to further examine the contribution of cAMP to the effects of the D556A-PDE4D5 mutant, using the PKA inhibitor H89, we obtained evidence that PKA has a role in mediating the effects of the D556A-PDE4D5 in C1. Both basal and glucose-stimulated GLP-1 release were significantly suppressed by treatment of C1 cells with the H89 (10 µmol·L−1) for 2 h. This contrasts with WT cells, where basal GLP-1 release was insensitive to H89, but where glucose-induced GLP-1 release was reduced. In addition to having an effect on GLP-1 release, the 24 h pre-incubation with H89 (10 µmol·L−1) might also modulate longer-term synthesis of GLP-1 as it markedly suppressed both basal and glucose-induced GLP-1 release in C1 and WT cells under these conditions (Figure 6).
Figure 6.

The effect of H89 on basal and glucose-stimulated glucagon-like peptide-1 (GLP-1) release from wild-type (WT) and C1 GLUTag cells. WT and C1 cells were incubated in test buffer with or without 10 µmol·L−1 H89 in the presence or absence of 10 mmol·L−1 glucose during the 2 h secretion study. For H89 pre-treated cells, cells were incubated for 24 h in cell culture medium with 10 µmol·L−1 H89 before the secretion study. The data were obtained from four to eight wells from at least two separate experiments and are presented as the percentage relative to the secretion of untreated cells incubated in test buffer alone [basal GLP-1 secretion (pmol per 106 cells 2 h−1: WT 0.17 ± 0.02; C1 0.34 ± 0.02], measured in parallel in the same experiment and normalized by post-incubation cell count. Statistical significance was assessed with one-way anova, followed by Tukey's multiple comparison test if overall P < 0.05. Student's one-sample t-test was used to assess the statistical significance of H89 treatment on basal GLP-1 secretion relative to that of untreated cells incubated in test buffer alone (indicated above column): ***P < 0.001, **P < 0.01, *P < 0.05, n.s.P > 0.05.
Other PDEs in GLUTag cells
We also evaluated whether other PDEs might regulate GLP-1 release. For this purpose, we used the non-selective PDE inhibitor, IBMX. IBMX (200 µmol·L−1) inhibited cAMP PDE activity by 75% in both high-speed pellet and supernatant fractions of WT GLUTag cells at 200 µmol·L−1 (supernatant 78.1 ± 8.5%, pellet 72.4 ± 5.0%) (Figure 7A). IBMX did not modify GLP-1 release in the absence of glucose (data not shown), but it increased glucose-induced GLP-1 release in a concentration-dependent manner (Figure 7B). The high abundance of PDE3B in primary L cells provided a strong reason to investigate whether PDE3 is expressed in GLUTag cells. Indeed, using RT-PCR with gene-specific primers we were able to detect PDE3B mRNA transcript and relatively minor expression of PDE3A (Figure 7C). Immunofluorescence staining with anti-PDE3B antibody was suggestive of a vesicular localization of PDE3B (Figure 7D). Moreover, Org 9935, a highly selective PDE3 inhibitor (Shafiee-Nick et al., 1995), inhibited cAMP PDE activity in the high-speed pellet fraction by ∼15% at 10 µmol·L−1 (Figure 7E), consistent with the presence of PDE3B, which is membrane-bound. Treatment of GLUTag cells with Org 9935 also induced a small but significant increase in GLP-1 release (Figure 7F).
Figure 7.
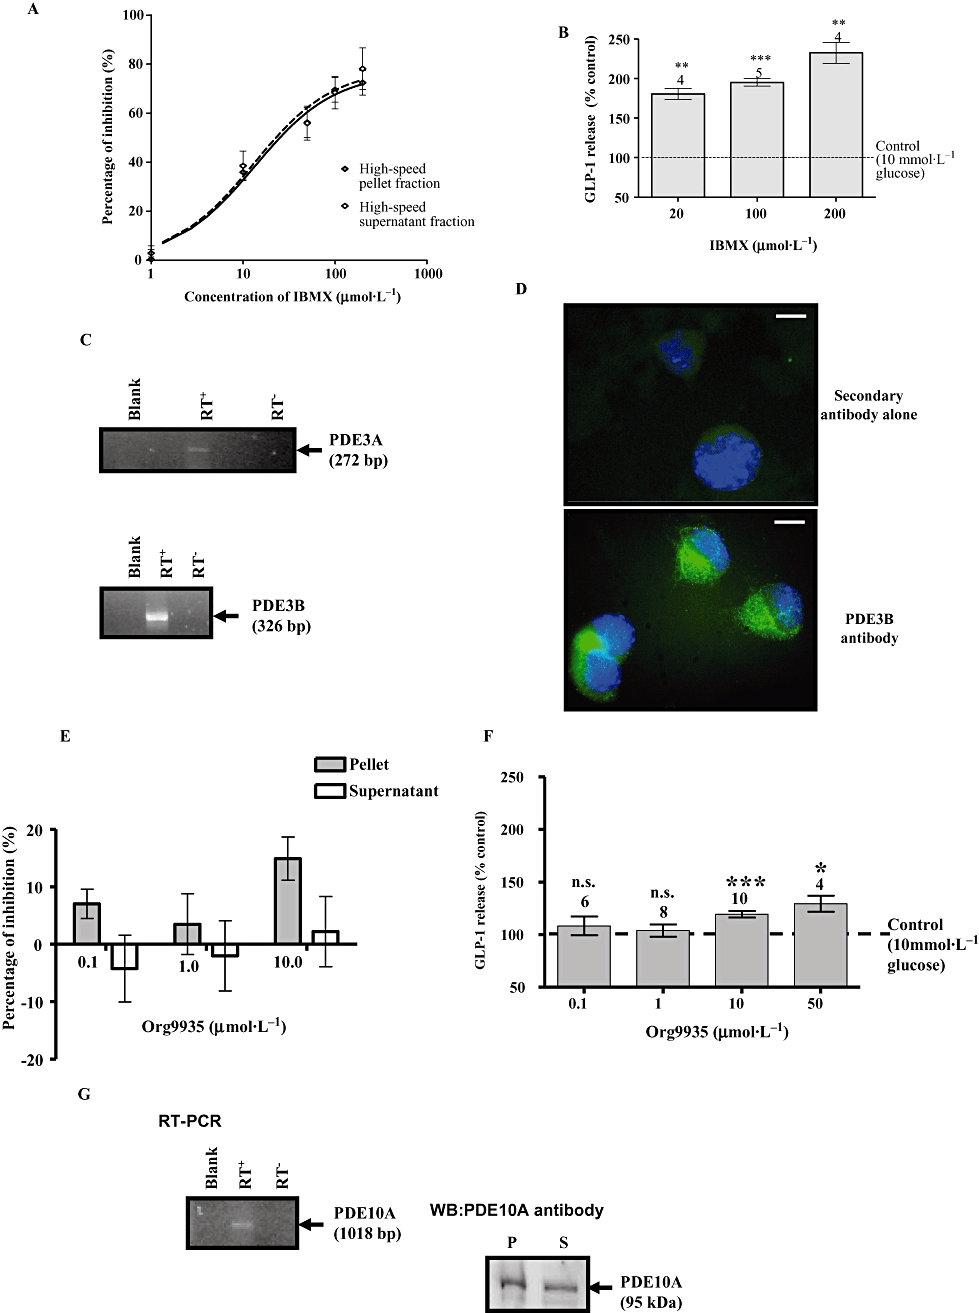
Phosphodiesterase (PDE) isoform expression in GLUTag cells. (A) The effect of 3-isobutyl-1-methylxanthine (IBMX) on the cyclic AMP (cAMP)-PDE activity in GLUTag cell. In the absence of IBMX, the PDE activity was 43.49 ± 12.15 pmol·min−1·mg−1 in the high-speed pellet fraction and 36.42 ± 10.07 pmol·min−1·mg−1 in the high-speed supernatant fraction. Each % inhibition is the mean ± SEM of triplicate observations from three separate cell preparations. (B) The effect of IBMX on GLP-1 release. GLUTag cells were incubated in 20–200 µmol·L−1 IBMX in the presence of 10 mmol·L−1 glucose. The number of wells, from at least two separate experiments, is indicated above each column. Statistical significance was assessed relative to secretion in the presence of 10 mmol·L−1 glucose without IBMX, using Student's one-sample t-test: ***P < 0.001, **P < 0.01, *P < 0.05, n.s.P > 0.05. (C) RT-PCR analysis showing expression of PDE3A and PDE3B mRNA transcript. (D) Immunofluorescence staining of GLUTag cells showing the subcellular localization of PDE3B. The cells were visualized by epifluorescence microscopy at 100× magnification. Scale bar = 10 µm. (E) The effect of Org 9935 on cAMP PDE activity in the high-speed pellet and supernatant fractions of GLUTag cells. In the absence of Org 9935, the PDE activity was 53.5 ± 8.5 pmol·min−1·mg−1 in the high-speed pellet fraction and 45.4 ± 7.5 pmol·min−1·mg−1 in the high-speed supernatant fraction. Each value is the mean ± SEM of triplicate observations from 10 separate cell preparations. (F) The effect of Org9935 on glucose-induced GLP-1 release from GLUTag cells. (G) RT-PCR and Western blot analysis showing the expression of PDE10A. For Western blot, protein loading was 10 µg per lane.
Finally, we found that GLUTag cells also express PDE10A (Figure 7G) and which is consistent with the presence of mRNA transcript for these PDEs in L cells. Indeed, Western blot analysis with anti-PDE10A antibody immunostained a protein with an Mr = 95 kDa, in both the high-speed pellet and supernatant fraction of GLUTag cells (Figure 7G).
Discussion
The major finding of this study is that the administration of the PDE4 selective inhibitor, rolipram to fed rats increases plasma GLP-1 levels, although transiently, by approximately twofold compared with control rats. This suggests an important role for PDE4 in regulating GLP-1 homeostasis, and might provide impetus for the use of PDE4 inhibitors in the treatment of type 2 diabetes. A role for PDE4 in regulating GLP-1 secretion was supported by a number of independent in vitro methodological approaches using GLUTag cells, an intestinal L cell model. Indeed, treatment of GLUTag cells with rolipram increased glucose-induced but not basal GLP-1 release by ∼70% versus control. The action of rolipram appears to be mediated via PDE4 inhibition. This was based on several lines of evidence. First, PDE4D4 and PDE4D5 are expressed in GLUTag cells. Furthermore, significant PDE activity (∼40%) was inhibited by rolipram in both the high-speed supernatant and pellet fraction. Second, creation of a GLUTag cell clone (C1) stably overexpressing catalytically inactive D556A-PDE4D5 mutant exhibited increased intracellular cAMP levels and increased basal and glucose-induced GLP-1 release compared with control cells. It has been previously demonstrated by us that catalytically inactive PDE4 isoforms can exert a dominant negative function by displacing the cognate, endogenous PDE4 isoform from signalling complexes in the cell where it is tethered. This has been shown in some detail for the catalytically inactive D556A-PDE4D5 mutant interacting with the RACK and β-arrestin signalling scaffold complexes (Baillie et al., 2003; Bolger et al., 2006) and with other PDE4 species interacting with the PKA-sequestering AKAPs (McCahill et al., 2005). Here then we used the D556A-PDE4D5 mutant to determine if it would serve to disrupt intracellular cAMP regulation of GLP-1 synthesis/release. We considered this approach to be more specific than global knock down of PDE4D5 with respect to modulating a possible compartmentalized pool of cAMP linked with regulation of GLP-1 release. This approach was further consolidated by the fact that the overexpression of the D556A-PDE4D5 mutant had no significant effect on total or rolipram-sensitive cAMP PDE activities, thereby ruling out the possibility that increased GLP-1 release was due to an indirect effect of D556A-PDE4D5 on the expression of endogenous PDEs. A role for intracellular cAMP/PKA in enhancing GLP-1 release in response to overexpression of D556A-PDE4D5 mutant was demonstrated by the finding that the treatment of cells with the PKA inhibitor H89 for 2 h reduced both basal and glucose-induced GLP-1 release by 37–39% in C1 GLUTag cells. The similar magnitude of the inhibitory effect of H89 in basal compared with glucose-treated states suggests that cAMP/PKA-dependent pathways might be convergent rather than sequential with glucose-dependent pathways regulating GLP-1 synthesis and release in C1 cells.
PDE4D5 is known to interact preferentially with the signal scaffolding proteins, RACK1 (Yarwood et al., 1999) and beta-arrestin (Bolger et al., 2003) and therefore might be a major PDE4 variant contributing to cAMP signal compartmentalization. The observed increase in intracellular cAMP in the C1 clone is interesting because it suggests that the D556A-PDE4D5 mutant might displace endogenous PDE4D from an undefined protein complex and that the displaced endogenous PDE4D is somehow precluded from fully accessing cAMP. As mentioned above, cells stably overexpressing D556A-PDE4D5 exhibit increased basal and glucose-induced GLP-1 release; this contrasts with the effect of rolipram, which modulates only glucose-induced GLP-1 release. A possible explanation for this difference is that intracellular cAMP levels are chronically increased in C1 compared with WT cells treated with rolipram, which evokes a transient increase in intracellular cAMP following a 10 min stimulation (data not shown) and therefore, sustained intracellular cAMP in C1 cells may have an additional effect on GLP-1 synthesis and release. This possibility is further supported to some extent by the finding that the treatment of cells with the PKA inhibitor H89 for 2 h reduced basal GLP-1 release in C1, but had no effect on basal GLP-1 release in WT cells. In addition, pro-glucagon gene expression is known to be both PKA-dependent (Drucker et al., 1994) and Epac-dependent (Lotfi et al., 2006). However, recent work suggests that while cAMP effects on GLP-1 secretion are indeed mediated by PKA, its effects on GLP-1 synthesis are mediated through Epac-dependent mechanisms (Islam et al., 2009).
The enhancement of GLP-1 release by IBMX is approximately twofold higher than the maximal effect elicited by rolipram, suggesting that other PDEs might be involved in regulating GLP-1 release. In this regard, GLUTag cells also express PDE3A/B and PDE10A. PDE3B is the predominant PDE in regulating glucose-induced insulin secretion, but its relevance to GLP-1 release is unclear. Its apparent membrane localization, as indicated by immunofluorescence staining, is consistent with the previously demonstrated localization of PDE3B to particulate vesicular fractions in a variety of cells (Liu and Maurice, 1998), including islet β-cells and clonal insulin-secreting cells, in which it is localized to insulin granules and the plasma membrane (Walz et al., 2007). Here we show that inhibition of PDE3B with Org 9935 only produced a modest increase in glucose-induced GLP-1 release. Moreover, Degerman et al., (2004) showed that inhibition of PDE3 by orally given milrinone did not lead to increased GLP-1 level in mice. In view of these observations, the contribution of PDE3 activity to regulation of GLP-1 secretion appears less significant than for PDE4D. The presence of PDE10A in L cells and GLUTag cells is of significant interest given that PDE10A inhibitors are also insulin secretagogues (Cantin et al., 2007) and the role of PDE10A in regulating GLP-1 secretion therefore warrants further investigation.
Several cAMP-coupled GPCRs are known to be physiologically relevant to GLP-1 secretion. The GIP-stimulated GLP-1 secretion appears to involve PKA activation, as evident from the inhibition of GIP effect by H8 (Damholt et al., 1998). PACAP (Simpson et al., 2007) and the GPR119 (also termed glucose-dependent insulinotropic receptor or GDIR) agonist AR231453 (Chu et al., 2008) have been shown to stimulate cAMP accumulation and GLP-1 secretion from GLUTag cells. Future research will focus on whether PDE4D isoforms are involved in differential regulation of intracellular cAMP formed from different GPCR agonists.
Given the role of PDE4D in regulating GLP-1 secretion, PDE4D might, therefore, be considered a potential target for the treatment of type 2 diabetes. Selective inhibition of PDE4D, perhaps in combination with a DPPIV inhibitor to increase plasma GLP-1 half-life, might potentially be used to increase endogenous GLP-1. The therapeutic potential of currently available PDE4 inhibitors is limited because of their dose-limiting side effects of nausea and emesis (Huang et al., 2001). However, the high potency of rolipram in augmenting glucose-stimulated GLP-1 release, as observed in the in vitro studies, and the locality of the therapeutic target in the intestinal L cells suggest the possibility of using a low dose of orally administered PDE4 inhibitor to achieve localized inhibition of PDE4 activity in the intestinal L cells, minimizing the central emetic side effects. A further consideration is the expression of PDE4 in other cell types, apart from the intestinal L cells, along the gastrointestinal tract, suggesting possible adverse effects resulting from inhibition of PDE4.
Glossary
Abbreviations:
- GLP-1
glucagon-like peptide-1
- IBMX
3-isobutylmethylxanthine
- PACAP
pituitary adenylate cyclase-activating polypeptide
- PBGD
porphobilinogen deaminase
- PDE
phosphodiesterase
- PKA
protein kinase A
Conflict of interest
The authors state no conflict of interest.
References
- Ahmad M, Abdel-Wahab Y, Tate R, Flatt P, Pyne N, Furman B. Effect of type-selective inhibitors on cyclic nucleotide phosphodiesterase activity and insulin secretion in the clonal insulin secreting cell line BRIN-BD11. Br J Pharmacol. 2000;129:1228–1234. doi: 10.1038/sj.bjp.0703165. [DOI] [PMC free article] [PubMed] [Google Scholar]
- Baillie G, Sood A, McPhee I, Gall I, Perry S, Lefkowitz R, et al. beta-Arrestin-mediated PDE4 cAMP phosphodiesterase recruitment regulates beta-adrenoceptor switching from Gs to Gi. Proc Natl Acad Sci USA. 2003;100:940–945. doi: 10.1073/pnas.262787199. [DOI] [PMC free article] [PubMed] [Google Scholar] [Retracted]
- Beavo JA, Brunton LL. Cyclic nucleotide research – still expanding after half a century. Nat Rev Mol Cell Biol. 2002;3:710–718. doi: 10.1038/nrm911. [DOI] [PubMed] [Google Scholar]
- Bolger G, Erdogan S, Jones R, Loughney K, Scotland G, Hoffmann R, et al. Characterization of five different proteins produced by alternatively spliced mRNAs from the human cAMP-specific phosphodiesterase PDE4D gene. Biochem J. 1997;328(2):539–548. doi: 10.1042/bj3280539. Pt. [DOI] [PMC free article] [PubMed] [Google Scholar]
- Bolger G, McCahill A, Huston E, Cheung Y, McSorley T, Baillie G, et al. The unique amino-terminal region of the PDE4D5 cAMP phosphodiesterase isoform confers preferential interaction with beta-arrestins. J Biol Chem. 2003;278:49230–49238. doi: 10.1074/jbc.M303772200. [DOI] [PubMed] [Google Scholar]
- Bolger GB, Baillie GS, Li X, Lynch MJ, Herzyk P, Mohamed A, et al. Scanning peptide array analyses identify overlapping binding sites for the signalling scaffold proteins, beta-arrestin and RACK1, in cAMP-specific phosphodiesterase PDE4D5. Biochem J. 2006;398:23–36. doi: 10.1042/BJ20060423. [DOI] [PMC free article] [PubMed] [Google Scholar]
- Brubaker PL, Schloos J, Drucker DJ. Regulation of glucagon-like peptide-1 synthesis and secretion in the GLUTag enteroendocrine cell line. Endocrinology. 1998;139:4108–4114. doi: 10.1210/endo.139.10.6228. [DOI] [PubMed] [Google Scholar]
- Cantin L, Magnuson S, Gunn D, Barucci N, Breuhaus M, Bullock W, et al. PDE-10A inhibitors as insulin secretagogues. Bioorg Med Chem Lett. 2007;17:2869–2873. doi: 10.1016/j.bmcl.2007.02.061. [DOI] [PubMed] [Google Scholar]
- Chu Z, Carroll C, Alfonso J, Gutierrez V, He H, Lucman A, et al. A role for intestinal endocrine cell-expressed g protein-coupled receptor 119 in glycemic control by enhancing glucagon-like Peptide-1 and glucose-dependent insulinotropic Peptide release. Endocrinology. 2008;149:2038–2047. doi: 10.1210/en.2007-0966. [DOI] [PubMed] [Google Scholar]
- Conti M, Beavo JJ. Biochemistry and physiology of cyclic nucleotide phosphodiesterases: essential components in cyclic nucleotide signaling. Annu Rev Biochem. 2007;76:481–451. doi: 10.1146/annurev.biochem.76.060305.150444. [DOI] [PubMed] [Google Scholar]
- Conti M, Richter W, Mehats C, Livera G, Park JY, Jin C. Cyclic AMP-specific PDE4 phosphodiesterases as critical components of cyclic AMP signaling. J Biol Chem. 2003;278:5493–5496. doi: 10.1074/jbc.R200029200. [DOI] [PubMed] [Google Scholar]
- Damholt A, Buchan A, Kofod H. Glucagon-like-peptide-1 secretion from canine L-cells is increased by glucose-dependent-insulinotropic peptide but unaffected by glucose. Endocrinology. 1998;139:2085–2091. doi: 10.1210/endo.139.4.5921. [DOI] [PubMed] [Google Scholar]
- Degerman E, Manganiello V, Holst JJ, Ahrén B. Milrinone efficiently potentiates insulin secretion induced by orally but not intravenously administered glucose in C57BL6J mice. Eur J Pharmacol. 2004;498:319–323. doi: 10.1016/j.ejphar.2004.07.096. [DOI] [PubMed] [Google Scholar]
- Drucker DJ, Jin T, Asa SL, Young TA, Brubaker PL. Activation of proglucagon gene transcription by protein kinase-A in a novel mouse enteroendocrine cell line. Mol Endocrinol. 1994;8:1646–1655. doi: 10.1210/mend.8.12.7535893. [DOI] [PubMed] [Google Scholar]
- Egan J, Meneilly G, Habener J, Elahi D. Glucagon-like peptide-1 augments insulin-mediated glucose uptake in the obese state. J Clin Endocrinol Metab. 2002;87:3768–3773. doi: 10.1210/jcem.87.8.8743. [DOI] [PubMed] [Google Scholar]
- Flint A, Raben A, Astrup A, Holst JJ. Glucagon-like peptide 1 promotes satiety and suppresses energy intake in humans. J Clin Invest. 1998;101:515–520. doi: 10.1172/JCI990. [DOI] [PMC free article] [PubMed] [Google Scholar]
- Furman B, Pyne N. Modulation of cyclic nucleotides and cyclic nucleotide phosphodiesterases in pancreatic islet beta-cells and intestinal L-cells as targets for treating diabetes mellitus. Curr Opin Investig Drugs. 2006;7:898–905. [PubMed] [Google Scholar]
- Gribble FM, Williams L, Simpson AK, Reimann F. A novel glucose-sensing mechanism contributing to glucagon-like peptide-1 secretion from the GLUTag cell line. Diabetes. 2003;52:1147–1154. doi: 10.2337/diabetes.52.5.1147. [DOI] [PubMed] [Google Scholar]
- Härndahl L, Jing X, Ivarsson R, Degerman E, Ahrén B, Manganiello V, et al. Important role of phosphodiesterase 3B for the stimulatory action of cAMP on pancreatic beta-cell exocytosis and release of insulin. J Biol Chem. 2002;277:37446–37455. doi: 10.1074/jbc.M205401200. [DOI] [PubMed] [Google Scholar]
- Härndahl L, Wierup N, Enerbäck S, Mulder H, Manganiello V, Sundler F, et al. Beta-cell-targeted overexpression of phosphodiesterase 3B in mice causes impaired insulin secretion, glucose intolerance, and deranged islet morphology. J Biol Chem. 2004;279:15214–15222. doi: 10.1074/jbc.M308952200. [DOI] [PubMed] [Google Scholar]
- Holz GG, Habener JF. Signal transduction crosstalk in the endocrine system: pancreatic beta-cells and the glucose competence concept. Trends Biochem Sci. 1992;17:388–393. doi: 10.1016/0968-0004(92)90006-u. [DOI] [PMC free article] [PubMed] [Google Scholar]
- Houslay MD, Adams DR. PDE4 cAMP phosphodiesterases: modular enzymes that orchestrate signalling cross-talk, desensitization and compartmentalization. Biochem J. 2003;370:1–18. doi: 10.1042/BJ20021698. [DOI] [PMC free article] [PubMed] [Google Scholar]
- Houslay MD, Baillie GS, Maurice DH. cAMP-Specific phosphodiesterase-4 enzymes in the cardiovascular system: a molecular toolbox for generating compartmentalized cAMP signaling. Circ Res. 2007;100:950–966. doi: 10.1161/01.RES.0000261934.56938.38. [DOI] [PubMed] [Google Scholar]
- Huang Z, Ducharme Y, Macdonald D, Robichaud A. The next generation of PDE4 inhibitors. Curr Opin Chem Biol. 2001;5:432–438. doi: 10.1016/s1367-5931(00)00224-6. [DOI] [PubMed] [Google Scholar]
- Irizarry RA, Bolstad BM, Collin F, Cope LM, Hobbs B, Speed TP. Summaries of Affymetrix GeneChip probe level data. Nucleic Acids Res. 2003;31:e15. doi: 10.1093/nar/gng015. [DOI] [PMC free article] [PubMed] [Google Scholar]
- Islam D, Zhang N, Wang P, Li H, Brubaker PL, Gaisano H, et al. Epac is involved in cAMP-stimulated proglucagon expression and hormone production, but not hormone secretion in pancreatic alpha and intestinal L cell lines. Am J Physiol Endocrinol Metab. 2009;296:E174–E181. doi: 10.1152/ajpendo.90419.2008. [DOI] [PubMed] [Google Scholar]
- Koyanagi M, Suga H, Hoshiyama D, Ono K, Iwabe N, Kuma K, et al. Ancient gene duplication and domain shuffling in the animal cyclic nucleotide phosphodiesterase family. FEBS Lett. 1998;436:323–328. doi: 10.1016/s0014-5793(98)01150-8. [DOI] [PubMed] [Google Scholar]
- Liu H, Maurice DH. Expression of cyclic GMP-inhibited phosphodiesterases 3A and 3B (PDE3A and PDE3B) in rat tissues: differential subcellular localization and regulated expression by cyclic. AMP Br J Pharmacol. 1998;125:1501–1510. doi: 10.1038/sj.bjp.0702227. [DOI] [PMC free article] [PubMed] [Google Scholar]
- Lotfi S, Li Z, Sun J, Zuo Y, Lam P, Kang Y, et al. Role of the exchange protein directly activated by cyclic adenosine 5′-monophosphate (Epac) pathway in regulating proglucagon gene expression in intestinal endocrine L cells. Endocrinology. 2006;147:3727–3736. doi: 10.1210/en.2006-0056. [DOI] [PubMed] [Google Scholar]
- Lugnier C. Cyclic nucleotide phosphodiesterase (PDE) superfamily: a new target for the development of specific therapeutic agents. Pharmacol Ther. 2006;109:366–398. doi: 10.1016/j.pharmthera.2005.07.003. [DOI] [PubMed] [Google Scholar]
- Lynch MJ, Baillie GS, Mohamed A, Li X, Maisonneuve C, Klussmann E, et al. RNA silencing identifies PDE4D5 as the functionally relevant cAMP phosphodiesterase interacting with beta arrestin to control the protein kinase A/AKAP79-mediated switching of the beta2-adrenergic receptor to activation of ERK in HEK293B2 cells. J Biol Chem. 2005;280:33178–33189. doi: 10.1074/jbc.M414316200. [DOI] [PubMed] [Google Scholar]
- McCahill A, McSorely T, Huston E, Hill EV, Lynch MJ, Gall I, et al. In resting COS1 cells a dominant negative approach shows that specific, anchored PDE4 cAMP phosphodiesterase isoforms gate the activation, by basal cyclic AMP production, of AKAP-tethered protein kinase A type II located in the centrosomal region. Cell Signal. 2005;17:1158–1173. doi: 10.1016/j.cellsig.2005.04.003. [DOI] [PubMed] [Google Scholar]
- Nauck MA, Niedereichholz U, Ettler R, Holst JJ, Orskov C, Ritzel R, et al. Glucagon-like peptide 1 inhibition of gastric emptying outweighs its insulinotropic effects in healthy humans. Am J Physiol. 1997;273:E981–E988. doi: 10.1152/ajpendo.1997.273.5.E981. [DOI] [PubMed] [Google Scholar]
- Overton HA, Fyfe MC, Reynet C. GPR119, a novel G protein-coupled receptor target for the treatment of type 2 diabetes and obesity. Br J Pharmacol. 2008;153(Suppl. 1):S76–S81. doi: 10.1038/sj.bjp.0707529. [DOI] [PMC free article] [PubMed] [Google Scholar]
- Pyne N, Furman B. Cyclic nucleotide phosphodiesterases in pancreatic islets. Diabetologia. 2003;46:1179–1189. doi: 10.1007/s00125-003-1176-7. [DOI] [PubMed] [Google Scholar]
- Reimann F, Gribble FM. Glucose-sensing in glucagon-like peptide-1-secreting cells. Diabetes. 2002;51:2757–2763. doi: 10.2337/diabetes.51.9.2757. [DOI] [PubMed] [Google Scholar]
- Reimann F, Ward PS, Gribble FM. Signalling mechanisms underlying the release of glucagon-like peptide 1. Diabetes. 2006;55:S78–S85. [Google Scholar]
- Reimann F, Habib AM, Tolhurst G, Parker HE, Rogers GJ, Gribble FM. Glucose sensing in L cells: a primary cell study. Cell Metab. 2008;8:532–539. doi: 10.1016/j.cmet.2008.11.002. [DOI] [PMC free article] [PubMed] [Google Scholar]
- Reimer R, Darimont C, Gremlich S, Nicolas-Métral V, Rüegg U, Macé K. A human cellular model for studying the regulation of glucagon-like peptide-1 secretion. Endocrinology. 2001;142:4522–4528. doi: 10.1210/endo.142.10.8415. [DOI] [PubMed] [Google Scholar]
- Semple G, Fioravanti B, Pereira G, Calderon I, Uy J, Choi K, et al. Discovery of the first potent and orally efficacious agonist of the orphan G-protein coupled receptor 119. J Med Chem. 2008;51:5172–5175. doi: 10.1021/jm8006867. [DOI] [PubMed] [Google Scholar]
- Shafiee-Nick R, Pyne NJ, Furman B. Effects of type-selective phosphodiesterase inhibitors on glucose-induced insulin secretion and islet phosphodiesterase activity. Br J Pharmacol. 1995;115:1486–1492. doi: 10.1111/j.1476-5381.1995.tb16641.x. [DOI] [PMC free article] [PubMed] [Google Scholar]
- Simpson A, Ward P, Wong K, Collord G, Habib A, Reimann F, et al. Cyclic AMP triggers glucagon-like peptide-1 secretion from the GLUTag enteroendocrine cell line. Diabetologia. 2007;50:2181–2189. doi: 10.1007/s00125-007-0750-9. [DOI] [PMC free article] [PubMed] [Google Scholar]
- Thompson WJ, Appleman MM. Multiple cyclic nucleotide phosphodiesterase activities from rat brain. Biochemistry. 1971;10:311–316. [PubMed] [Google Scholar]
- Walz H, Wierup N, Vikman J, Manganiello V, Degerman E, Eliasson L, et al. Beta-cell PDE3B regulates Ca2+-stimulated exocytosis of insulin. Cell Signal. 2007;19:1505–1513. doi: 10.1016/j.cellsig.2007.01.030. [DOI] [PubMed] [Google Scholar]
- Yarwood S, Steele M, Scotland G, Houslay M, Bolger G. The RACK1 signaling scaffold protein selectively interacts with the cAMP-specific phosphodiesterase PDE4D5 isoform. J Biol Chem. 1999;274:14909–14917. doi: 10.1074/jbc.274.21.14909. [DOI] [PubMed] [Google Scholar]
- Zhao A, Zhao H, Teague J, Fujimoto W, Beavo J. Attenuation of insulin secretion by insulin-like growth factor 1 is mediated through activation of phosphodiesterase 3B. Proc Natl Acad Sci USA. 1997;94:3223–3228. doi: 10.1073/pnas.94.7.3223. [DOI] [PMC free article] [PubMed] [Google Scholar]