

Abstract
Reproducible Objective Quantification Scheme (ROQS) is a novel method for regional white matter measurements of diffusion tensor imaging (DTI) parameters that overcomes the limitations of previous approaches for analyzing large cohorts of subjects reliably. ROQS is a semi-automated technique that exploits the fiber orientation information from the diffusion tensor in conjunction with a binary masking and chain-linking algorithm to segment anatomically distinct white matter tracts for subsequent quantitative analysis of DTI parameters such as fractional anisotropy and apparent diffusion coefficient. When applied to 3 Tesla whole-brain DTI of normal adult volunteers, ROQS is shown to segment the corpus callosum much faster than manual region of interest (ROI) delineation, and with better reproducibility and accuracy.
Introduction
Diffusion tensor magnetic resonance imaging (DTI) has expanded the boundaries of diagnostic imaging by examining the diffusion of water in brain tissue (Basser et al, 1994; Pierpaoli et al, 1996). Recently, studies have shown DTI can be used to provide diagnosis of disease conditions in cerebral ischemia, acute stroke, and multiple sclerosis (Virta et al, 1999; Mukherjee et al, 2000; Werring et al, 1999). In white matter, water diffuses more readily along the orientation of axonal fibers than across the fibers, due to hindrance from structural elements such as the myelin sheath. The apparent diffusion coefficient (Dav) is a rotationally invariant measure of the magnitude of diffusion. The degree of directionality of diffusion is termed anisotropy, and can be measured as the variation in the eigenvalues of the diffusion tensor (Basser et al, 1994). An important observation is that these anisotropy measures can be obtained without diagonalization of the diffusion tensor to calculate the eigenvalues, but via scaled invariants (Ulug et al, 1999). Fractional anisotropy (FA) is sensitive to changes in white matter integrity (Watts et al, 2003). FA loss and Dav rise have been demonstrated in a number of traumatic brain injury (TBI) studies (Huisman et al 2004; Lee, et al, 2003; Huisman et al 2003; Arfanakis, 2002). It is reasonable to assume that these quantitative characteristics are indicative of white matter damage in a variety of pathologies.
The quantification of DTI for investigating white matter abnormalities is generally approached using one of two methods: voxel-based analysis (VBA) where spatially normalized data sets are compared at a voxel by voxel scale or region of interest (ROI) analysis in which a specified region is measured directly. In cases where it is impractical to predict anatomical domains of damage a priori, researchers tend to use a voxel-based approach to characterize statistical differences between groups (Eriksson et al., 2001; Rugg-Gunn et al., 2001). VBA involves spatial normalization of brain images to a stereotactic 3D space (Friston 1995; Mazziotta 1995; Thompson, 1997; Grenander, 1998). In order to produce a more normalized distribution of image data, a smoothing function is typically applied to the images (Ashburner and Friston, 2000; Good et al., 2001; Watkins et al., 2001). Statistical differences between groups are then made on a voxel by voxel basis to determine variations in tissue composition.
While a voxel based strategy has the advantage of evaluating the entire brain in a model-free manner, and is therefore suitable for the identification of unexpected areas of white matter pathology, there are several limitations. A central disadvantage of this approach is that differences in gross anatomical morphology among subjects may influence spatial normalization and thus artificially inflate measurement differences. Moreover, many normalization algorithms use smoothing functions which introduce “blur” into the image, and violates the original uniformity of voxel size present in the original images, thus creating noise in the measurement (Jones et al, 2005). In other words, smoothing algorithms can alter the voxel size present in the original image due to low-pass filters. It has been shown that the size of the smoothing kernel can dramatically affect the analysis of the data (Jones et al, 2005). Researchers have suggested the possibility that VBA has reduced and inconsistent sensitivity in specific regions of the brain, especially those with greater anatomical variability (Quarantelli et al., 2002; Tisserand et al., 2002, Ciccarelli et al, 2003).
Most researchers use ROI analysis when it is possible to hypothesize specific areas of the brain that are implicated in disease. ROI analysis normally requires manual tracing of readily identifiable regions. Current methods for obtaining these boundaries are principally manual and subjective. This includes hand drawn ROI analysis where investigators draw polygons using a mouse over one of many potential 2 dimensional MR images. Manual tracing of white matter structures in the brain is very time consuming and requires considerable expertise to accurately identify structure boundaries. For ROI analysis, researchers identify brain regions and compare FA and Dav between research subjects and normal controls (Peled et al, 1998; Kubicki et al, 2002; Mukherjee et al, 2001). Selection bias and variability in the process of selecting images and drawing ROIs introduces significant barriers to both research methodology and clinical assessment.
Investigators have researched and created automated segmentation algorithms of the corpus callosum applied to non-DTI MR images. For example, Lee et. al. (2000) proposed an algorithm to automatically find the corpus callosum from a midsagittal MRI using high intensity gray level distributions and a window region growing algorithm as opposed to conventional contour matching. While this algorithm is fully automated, the segmentation sometimes is inaccurate either by not finding the corpus callosum at all, not including part of the corpus callosum, or including other structures in the segmentation like the fornix. Lundervold et. al. (1999) proposed a technique to segment midsagittal sections using multispectral 3D MRI recordings. The algorithm entails using intensity values and a corpus callosum template to segment the corpus callosum from a midsagittal slice. It was demonstrated successfully on 10 brains.
Three-dimensional segmentation algorithms of the corpus callosum using non-DTI MR images have also been proposed. For example, Bueno et. al. (2001) describes his semi-automatic segmentation algorithm as an immersion simulation modeled by a 3D-region adjacency graph. The algorithm entails using contrasted regions from morphological reconstruction constrained by the 3D-region adjacency graph to identify 3D regions. Then, the algorithm locates the contours of the region using a watershed transform. The algorithm is described as satisfactory and suggests that it be used with complementary techniques based on deformable models to optimize operation.
Conventional clinical analysis does not include a standardized quantitative protocol that can be applied to a variety of conditions. The proposed development of a Reproducible Objective Quantification Scheme (ROQS) is essential to analyze large cohorts of subjects reliably, and to provide statistical benchmarks for assessing individual results as pathological. There is a manifest need for a rapid automated or semi-automated method of white matter quantification for both individual and group analysis, but no generally accepted solution to this problem. In this report, we develop and apply a novel approach called ROQS to select a midline sagittal corpus callosum ROI that addresses several of the limitations of previous approaches.
Because ROI analysis is the current gold standard for quantitative MRI analysis, ROQS is designed to be a ROI approach, but using a semi-automatic algorithm to address several shortcomings of manual ROI delineation. Additionally, as noted previously, a major limitation of VBA is the need for spatially normalized data sets. ROQS is designed to be an ROI approach that can operate on both non-normalized and normalized data sets. ROQS exploits the fiber orientation information calculated from the diffusion tensor to define the boundary of anatomically distinct white matter tracts in a semi-automated fashion. After the user chooses a seed pixel within the structure, the algorithm uses the properties of this pixel to determine the appropriate boundary. Once the boundary of the white matter tract is determined, values of FA and Dav from pixels within the boundary are automatically processed for analysis. This makes ROQS extremely fast in comparison to manual ROI delineation. Furthermore, the semi-automated ROQS technique is more reproducible and reliable than hand-drawn ROIs. Reproducibility is demonstrated by comparing multiple raters trying to delineate the boundary of the corpus callosum using manual tracing and ROQS. Reliability is demonstrated not only by the inter- and intra-rater variability, but also by the properties of pixels chosen by ROQS in comparison to hand drawn tracings.
Methods
MRI protocols and participants
All methods described in this paper were developed on DTI images produced on a 3T MR scanner (GE Healthcare, Milwaukee, WI). The diffusion tensor was calculated using a single shot EPI sequence composed of 26 directions at b=1000 s/mm2, 6 image volumes with b = 0 s/mm2, 68 axial slices (2mm thickness) with 128×128 resolution, and a field of view of 220mm resulting in a pixel size of ~1.71875mm. Additionally, a T1 weighted SPGR image was obtained with 256×256 mm resolution, a FOV of 240 mm, at 1.5mm slice thickness. All brain volumes were prescribed to align to the anterior commissure and posterior commissure, axially. A board-certified neuroradiologist provided a clinical assessment of each healthy adult volunteer’s brain MRI (n=5) to verify that there was no pathology. Exclusion criteria included all contra-indicators for MRI, drug or alcohol abuse, prior head injury, and any history of neurological or psychiatric disorder. Raters of the ROQS technique and hand drawn ROIs were of varying skill levels and knowledge of brain anatomy and neuroscience, ranging from recent college graduates with little neuroscience experience to graduate students in neuroscience familiar with brain anatomy.
White matter segmentation
ROQS is a semi-automated process that requires 4 steps to segment white matter structures. This includes: (1) manual identification of anatomical structure and seed placement, (2) determination of thresholds and selection criteria, (3) creating a binary mask, and (4) calculating the boundary of the structure. The ROQS interface and algorithm is written by one of the authors on Interactive Data Language 6.0 (Research System Inc.).
Manual anatomic identification and seed placement
The first step in ROQS for segmenting a structure is manually assigning a seed pixel within the boundary of the structure. This technique is tested by selecting a pixel in the corpus callosum from a midline sagittal color coded anisotropy map.
Determination of thresholds and selection criteria
Based on a priori knowledge of brain anatomy and white matter tract organization, many white matter structures of the brain have their axis of greatest diffusivity oriented predominantly along one of the three cardinal directions (i.e. superior-inferior, anterior-posterior, or left-right). Furthermore, the boundaries of these white matter structures are either gray matter, cerebral spinal fluid, or other white matter structures that have their axis of greatest diffusivity oriented in a different direction. With this in mind, the first calculation of the ROQS algorithm is to determine the x, y, and z components of the principal eigenvector of the seed pixel, where the principal eigenvector denotes the direction of maximal diffusivity. The first selection criterion is to restrict the selection to pixels with the same maximum component (x, y, or z) of the principal eigenvector as the seed pixel. Second, a magnification array (Equation 1) is calculated.
| Equation 1 |
Where α = 0.3, β = 0.3, γ=0.5
Because white matter structures have high anisotropy, we can “magnify” potential pixels that have high anisotropy. The constants, α, β, and γ, were determined by testing various combinations of values selected in an ad hoc fashion and tested by selecting multiple structures in 25 normal healthy adult brains with the objective to minimize the variability of the ROQS ROI when selecting different seed pixels within a structure. One can multiply this array by the components from the primary eigenvector and assign primary colors (red, green, and blue) to each component to produce a color-coded anisotropy map weighted by the constants chosen. Varying the constants allows one to adjust the weighting of high and low anisotropy pixels and helps reduce noise in the image. This function is then applied to each component of the principal eigenvector of the entire image and resultant pixel values greater than one are set to one. The value of the maximum component (x, y, or z) is labeled Cmax. Finally, pixels are restricted to those with Cmax greater than the Cmax of the seed pixel minus 0.2. This threshold dependent on the seed, as opposed to a constant value, is used to adjust for variations in MR scanners and variations in diffusion properties in various areas of the brain. A value of 0.2 is chosen because diffusion properties within major white matter tracts are slightly heterogeneous. The appropriate threshold is determined by plotting a histogram of the Cmax values of white matter structure. The difference of the Cmax value at the peak and the average Cmax value of the boundary pixels is the appropriate threshold.
Creation of a binary mask
Given the selection criteria stated above, the third step in ROQS is to create a binary mask such that pixels that fit the previous criteria are assigned a value of one and all other pixels are assigned a value of zero.
Determining boundary of structure
The final step in ROQS is to determine the boundary of the structure. A vector is drawn from seed pixel to a pixel with a value of zero. The pixel (with a value of 1) immediately preceding the zero-valued pixel is a boundary pixel. A chain-algorithm is then applied to determine and connect all boundary pixels, which are those with a value of 1, but have an adjacent zero-valued pixel. A chain-algorithm links adjacent boundary pixels together by first finding all the boundary pixels and following the boundary around in one direction, pixel by pixel, until it returns to the starting pixel (Wu and Horng, 2004). All pixels within the boundary, regardless if they have a value of 1 or 0, are then chosen as the region of interest.
Assessment of Inter-operator and Intra-operator reliability
Five raters of varying skill levels and knowledge of brain anatomy and neuroscience were given instructions on how to locate the corpus callosum and then asked first to use a mouse to manually draw a region of interest on 5 brains, twice; interleaved such that consecutive brain were not the same. All raters drew the ROI on a color-coded anisotropy map of a midline sagital image. Then they were taught how to use the ROQS program and asked to segment the corpus callosum on the same 5 brains (twice) using the ROQS method. All raters were operating under the belief that they were given 10 different brains to reduce any bias, as indicated by a post-rating interview. Because raters simply had to select seed pixels within the corpus callosum which they clearly identified, there should not have been any practice effect favoring ROQS. The coordinates of the ROI, average FA for the ROI, and the time to complete the exercise for both methods were recorded. Coefficient of variation (CV) of the FA for all the ROIs for each method was calculated to quantify inter-operator and intra-operator reliability.
Assessment of Accuracy of segmentation
ROQS is designed to create the same boundary that a user aims to manually draw around an ROI, but without human error. To this end, an experienced operator manually drew an ROI around the corpus callosum 5 times then selected the same corpus callosum using ROQS. The final hand drawn ROI was composed of pixels that were selected every time during the 5 manual traces. Using these regions, we separate 3 types of pixels: 1) those pixels selected using manual tracing, but not by ROQS; 2) those that were selected by ROQS, but not by manual tracing; 3) those that were selected by both ROQS and manual tracing. A T1 weighted SPGR image was co-registered to the dimensions of the DTI images using Statistcal Parametric Mapping software (SPM 2). We demonstrate accuracy of the segmentation by showing that pixels selected by ROQS but not by manual tracing have similar diffusion properties and SPGR signal intensities to those selected by both ROQS and manual tracing; whereas those pixels selected by manual tracing but not by ROQS tend to fall outside the range of pixels selected by both methods.
Results
The results of the inter-operator reliability trials are given in Table 1. These results show that the ROQS technique provides improved reproducibility over hand drawn ROIs. CV of inter-operator reliability for manual tracing ranged from 4.02%–8.03% over 10 trials, while CV for ROQS ranged from 0.68%–1.41%, thereby demonstrating the substantially better precision (p<0.01, Wilcoxon rank sum test) of ROQS. Figure 1 illustrates the variability of hand drawn tracing versus the precision of ROQS. For each rater, FA measurements were always less in hand drawn tracing than with ROQS. This consistent result can be explained by the tendency of raters to overestimate the ROI by including CSF within the boundary. This tendency is discussed in greater detail in the following section.
Table 1.
Inter-rater reliability: FA of ROI from Hand Drawn and ROQS
Average fractional anisotropy from the region of interest determined by hand drawn (HD) and ROQS methods. ROQS has decreased variability among raters compared to manual tracing.
| Brain 1a | ||||||||
|---|---|---|---|---|---|---|---|---|
| rater 1 | rater 2 | rater 3 | rater 4 | rater 5 | Mean | SD | CV | |
| HD | 0.589 | 0.654 | 0.620 | 0.648 | 0.583 | 0.619 | 0.033 | 5.253 |
| ROQS | 0.661 | 0.657 | 0.660 | 0.671 | 0.657 | 0.661 | 0.006 | 0.902 |
| Brain 1b | ||||||||
| HD | 0.534 | 0.591 | 0.589 | 0.603 | 0.617 | 0.587 | 0.032 | 5.411 |
| ROQS | 0.651 | 0.670 | 0.654 | 0.663 | 0.659 | 0.659 | 0.007 | 1.098 |
| Brain 2a | ||||||||
| HD | 0.623 | 0.674 | 0.617 | 0.616 | 0.659 | 0.638 | 0.027 | 4.215 |
| ROQS | 0.668 | 0.683 | 0.689 | 0.678 | 0.677 | 0.679 | 0.008 | 1.144 |
| Brain 2b | ||||||||
| HD | 0.598 | 0.657 | 0.627 | 0.595 | 0.619 | 0.619 | 0.025 | 4.021 |
| ROQS | 0.667 | 0.674 | 0.688 | 0.670 | 0.675 | 0.675 | 0.008 | 1.177 |
| Brain 3a | ||||||||
| HD | 0.560 | 0.621 | 0.567 | 0.653 | 0.584 | 0.597 | 0.039 | 6.597 |
| ROQS | 0.681 | 0.683 | 0.674 | 0.683 | 0.686 | 0.681 | 0.005 | 0.684 |
| Brain 3b | ||||||||
| HD | 0.591 | 0.582 | 0.582 | 0.655 | 0.658 | 0.614 | 0.039 | 6.379 |
| ROQS | 0.683 | 0.690 | 0.681 | 0.675 | 0.675 | 0.681 | 0.006 | 0.905 |
| Brain 4a | ||||||||
| HD | 0.621 | 0.583 | 0.634 | 0.684 | 0.652 | 0.634 | 0.037 | 5.889 |
| ROQS | 0.695 | 0.711 | 0.695 | 0.700 | 0.709 | 0.702 | 0.008 | 1.091 |
| Brain 4b | ||||||||
| HD | 0.634 | 0.669 | 0.592 | 0.673 | 0.623 | 0.638 | 0.034 | 5.306 |
| ROQS | 0.701 | 0.696 | 0.684 | 0.687 | 0.689 | 0.691 | 0.007 | 1.024 |
| Brain 5a | ||||||||
| HD | 0.610 | 0.603 | 0.575 | 0.694 | 0.677 | 0.632 | 0.051 | 8.080 |
| ROQS | 0.688 | 0.698 | 0.694 | 0.703 | 0.691 | 0.695 | 0.006 | 0.852 |
| Brain 5b | ||||||||
| HD | 0.617 | 0.630 | 0.585 | 0.672 | 0.656 | 0.632 | 0.034 | 5.374 |
| ROQS | 0.692 | 0.707 | 0.681 | 0.698 | 0.691 | 0.694 | 0.010 | 1.403 |
Figure 1.
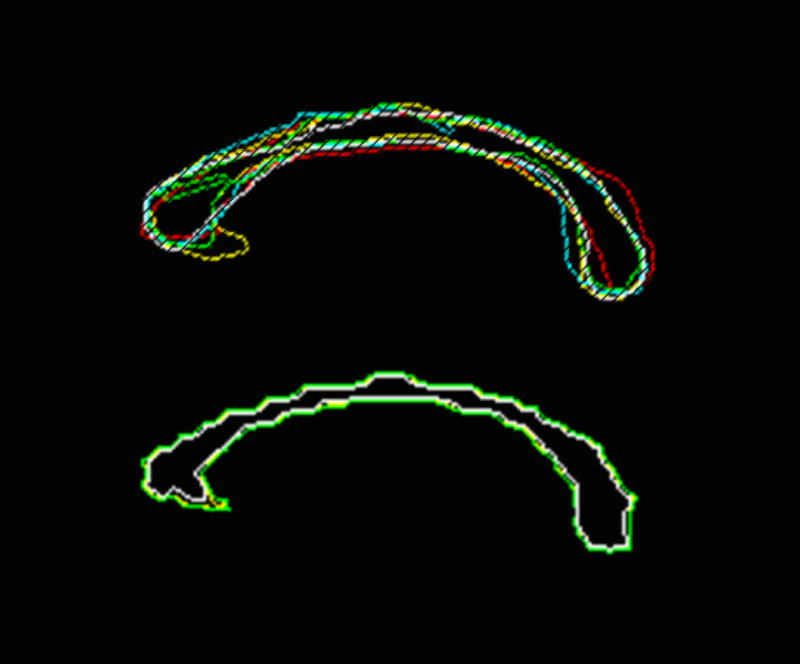
(a) Sagittal corpus callosum region of interest by 5 raters using a conventional hand-drawn technique by outlining the structure with a mouse. Significantly reduced inter-operator variability occurs when using (b) ROQS for the same ROI. In this case, the user simply has to select one or more seed pixels within the desired structure.
Intra-operator reliability was evaluated using two methods. The first intra-operator reliability test compared the number of differing pixels over two measurements for manual tracing versus ROQS. As seen in Figure 2, there is a substantial increase in test-retest reliability using ROQS rather than manual tracing. One rater was able to choose the same exact ROI with ROQS twice, which is virtually impossible with manual tracing. This experiment clearly indicates that manual tracing is less reproducible than ROQS. The second intra-reliability test compared the average FA of hand drawn ROI versus the ROQS ROI. CV of manual tracing ranged from 0.17% to 9.8% with an average variability of 3.55%, while ROQS variability ranged from 0.0% to 2.01% with an average of 0.80% (Table 2). The CV indicates that ROQS is significantly more reliable than manual tracing (p<0.01, Wilcoxon signed rank test).
Figure 2.
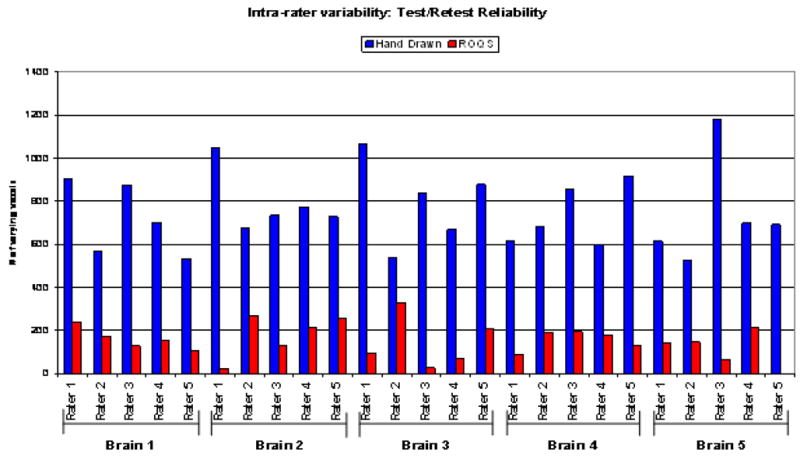
The numbers of pixels that vary between repeat measurements of the corpus callosum are show in blue for manual tracing and in red for ROQS. Data was collected by 5 raters with varying skill levels and knowledge of neuroscience. Fewer varying pixels using ROQS compared to manual tracing demonstrates the precision of the technique.
Table 2.
Intra-rater reliability: Coefficient of variation of FA measurement
Coefficient of variation of repeated measurement of the FA from the region of interest determined by hand drawn (HD) and ROQS methods across five raters measuring five brains twice.
| Brain 1 | |||||
|---|---|---|---|---|---|
| rater 1 | rater 2 | rater 3 | rater 4 | rater 5 | |
| HD | 6.938 | 7.140 | 3.563 | 5.110 | 4.010 |
| ROQS | 1.013 | 1.409 | 0.620 | 0.919 | 0.187 |
| Brain 2 | |||||
| HD | 2.895 | 1.844 | 1.163 | 2.446 | 4.464 |
| ROQS | 0.070 | 0.946 | 0.109 | 0.869 | 0.141 |
| Brain 3 | |||||
| HD | 3.930 | 4.590 | 1.865 | 0.177 | 8.422 |
| ROQS | 0.206 | 0.708 | 0.731 | 0.857 | 1.110 |
| Brain 4 | |||||
| HD | 1.534 | 9.808 | 4.841 | 1.082 | 3.193 |
| ROQS | 0.615 | 1.530 | 1.161 | 1.332 | 2.015 |
| Brain 5 | |||||
| HD | 0.839 | 3.111 | 1.219 | 2.302 | 2.172 |
| ROQS | 0.428 | 0.985 | 1.339 | 0.578 | 0.000 |
Accuracy of the segmentation was evaluated by comparing pixels that were chosen exclusively by manual tracing and exclusively by ROQS to those pixels selected by both methods (See Figure 3). Histograms of the FA for each of these groups are displayed in Figure 4. Results demonstrate that pixels chosen by ROQS, but not manual tracing, are in the same range of FA values and SPGR signal intensities as those pixels agreed upon by both methods, whereas 46% of pixels chosen exclusively by manual tracing lie outside the range of FA values selected by both methods. Similarly, 31% of pixels chosen exclusively by manual tracing lie outside the range of SPGR signal intensities selected by both methods. Mean and variance of FA values from the ROQS ROI also match more closely to the pixels agreed upon by both methods (Table 3).
Figure 3.
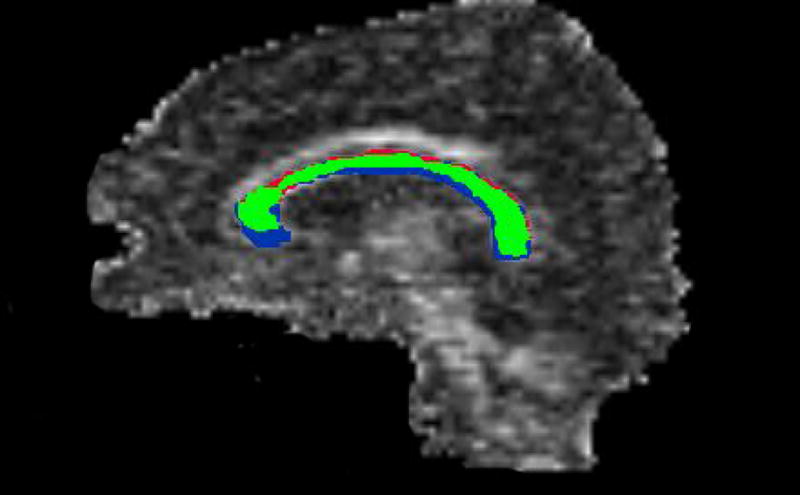
On this midline sagittal FA image of the corpus callosum, the pixels that were chosen by both ROQS and manual tracing are shown in green. The pixels chosen by ROQS but not manual tracing are depicted as red. The pixels chosen by manual tracing but not ROQS are blue. Red pixels have similar FA to the green pixels, whereas 46% of the blue pixels are below the minimum FA of the green region. This indicates that manual tracing selects unwanted pixels that are not part of the desired structure.
Figure 4.
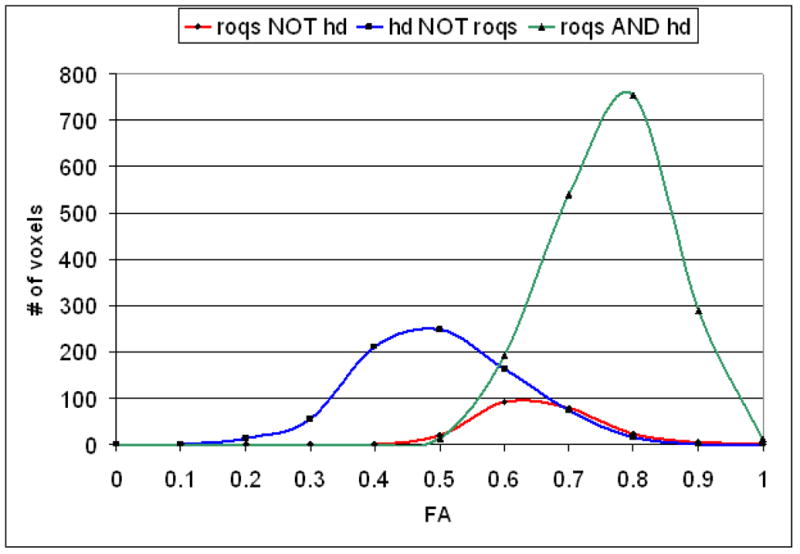
Histogram of FA from the types of pixels: 1) In green are pixels chosen by both hand drawn (HD) and ROQS methods; 2) In red are pixels chosen by ROQS, but not by hand drawn tracing; 3) In blue are pixels chosen by hand drawn tracing, but not by ROQS. All pixels chosen by exclusively by ROQS share similar FA as those chosen by both methods. 46% of the pixels chosen exclusively by hand drawn tracing are outside the range of FA found in the pixels chosen by both methods. Histogram of SPGR signal intensities follow the same pattern (data not shown). 31% of pixels chosen exclusively by hand drawn tracing are outside the range of SPGR signal intensities found in the pixels chosen exclusively by both methods.
Table 3.
Mean and variance of the FA from ROQS and hand drawn (HD) regions. Shown are pixels chosen by ROQS and HD tracing; pixels chosen by ROQS, but not HD tracing; pixels chosen by HD tracing, but not ROQS; all the pixels chosen by ROQS; all the pixels chosen by HD tracing. Pixels chosen by ROQS have a smaller variance and an average FA similar to the FA of the region agreed upon by both methods. In comparison, HD tracing has smaller average FA and larger variance.
| Mean | Variance | |
|---|---|---|
| ROQS/HD intersection | 0.714 | 0.00750 |
| ROQS NOT HD | 0.603 | 0.00613 |
| HD NOT ROQS | 0.450 | 0.0140 |
| Entire ROQS ROI | 0.702 | .00852 |
| Entire Hand Drawn ROI | 0.634 | 0.0241 |
ROQS provides more rapid ROI delineation. Speed comparisons show an 80% decrease in time for creating an ROI using ROQS compared to manual tracing.
Discussion
ROQS presents tools to accurately select ROIs based on anatomically identifiable structures. By focusing on easily identifiable structures as seed points, and algorithmically determining the boundary of this structure, this method reduces several sources of measurement error. Central to ROQS is a segmentation/tracing program that creates boundaries for white matter structures that can be used as an ROI. The ROQS program uses the principal eigenvector from DTI to distinguish white matter from gray matter and CSF in order to segment various white matter structures. This is unlike diffusion tensor fiber tracking which often uses anisotropy as a threshold value. The ROQS segmentation algorithm uses the principal eigenvector instead of anisotropy for a number of reasons. First, unlike anisotropy, the principal direction of diffusion can differentiate adjacent white matter tracts with different fiber orientations. Secondly, one of the measured quantities from these analyses is anisotropy. Using anisotropy as both a criterion for segmentation and a quantity for analysis is circular. ROQS does, however, employ a magnification function that adjusts the weighting of pixels based on the FA value. When used with the algorithm, the function preferentially selects higher FA valued pixels. The magnification function acts essentially the same way as a windowing function.
ROQS is a fast, robust, and reliable technique for performing ROI analysis on DTI datasets. Compared to hand-drawn ROIs, ROQS has remarkably low inter-rater and intra-rater variability. Furthermore, unlike voxel-based analysis, this method does not require spatial normalization of tensor data, thereby, maintaining the original equivalence across voxel dimensions present in the original data, and also avoids confounding differences in the size and shape of an individual and a template brain. ROQS, however, can operate on both non-normalized and normalized data sets. The use of normalized data sets should not alter the performance of ROQS. Moreover, while this technique is demonstrated on 3T whole brain DTI, it can operate on other field strength MR scanners.
One of the most interesting results when comparing ROQS to hand drawn ROIs is that the FA measurement is on average higher with ROQS. This can be explained on the basis of the human error that occurs with manual tracing. In an effort to encompass the entire structure, with hand drawn ROIs one often errs in selecting pixels that are outside the structure. The FA of these erroneous pixels, often cerebrospinal fluid or gray matter, is close to zero. These errors cause underestimation of the true FA for the white matter structure. The tendency to overestimate a boundary with manual tracing has been documented in other cases (Ashton et al, 2003).
ROQS, on the other hand, will not select cerebrospinal fluid or gray matter as boundary pixels as long as the user selects a seed within a white matter structure. For most cases, this is a strength of ROQS, but, in some cases, it can also become a limitation. If a lesion or abnormality is on a boundary of a white matter structure, depending on the tissue properties, ROQS may dismiss these pixels in the ROI because it has a sufficiently low Cmax. This may pose a problem in investigating a lesion that occurs on the boundary of a structure. A possible solution would be to add an additional seed pixel inside the lesion so that ROQS includes the lesion as part of the ROI. Dismissing a lesion may prove beneficial for studies that intend to examine only normal appearing white matter. On the other hand, if a lesion or abnormality occurs within a white matter structure, ROQS will include it in the ROI because it selects all pixels within the calculated boundary as part of n the ROI. In any event, this objective selection process may be an advantage to assess change over multiple time periods by comparing ROI size.
Accuracy of segmentation is difficult to quantitatively assess because there is no gold standard available for comparison. For accuracy assessment, we separated pixels that were selected 100% of the time during 5 manual traces. This ROI represents those pixels that are most likely to be selected by a manual trace. We then took the intersection of the ROQS ROI with the hand drawn ROI. These pixels are those that both methods agree should be part of the structure. On comparing these pixels to the hand drawn ROI and the ROQS ROI, we can see that the ROQS ROI is more conservative than the hand drawn ROI. While fewer pixels are chosen, the properties of these pixels share the same statistical properties of the pixels agreed upon by both methods. As stated previously, the manual trace may be larger because of the tendency for users to overestimate the boundary in order to encompass the entire structure. The manual trace contains several pixels that have low FA and low SPGR signal intensities that fall outside of the FA and SPGR signal intensity range of the pixels agreed upon by both methods. Pixels with low FA and low SPGR signal intensities chosen by manual tracing are likely to be CSF or gray matter and were chosen because of human error.
ROQS is designed to create the same boundary that a user aims to manually draw around a ROI. Because ROQS is semi-automated, the user has the ability to quickly sample and/or combine a number of different seed pixels until the boundary calculated that is the same ROI the user would have drawn manually. Because the time between selecting a seed pixel and the calculation of the boundary is nearly instantaneous, a number of potential seed pixels can be sampled while maintaining speed and ease of use. The segmentation procedure for the corpus callosum described in this report can be applied to several other structures such as the internal capsule, arcuate fasciculus, the cerebral peduncle, cingulum bundle, centrum semiovale, optic radiations, the superior and middle cerebellar peduncles, pontine crossing tract, and many others (Figure 5). ROI analysis can be completed in a reasonable amount of time consisting of simply the identification of structures which can be guided by a DTI white matter atlas (Wakana et al, 2004). The effective use of ROQS for the segmentation and analysis of other structures was demonstrated in a child population as well (Niogi and McCandliss, 2006).
Figure 5.
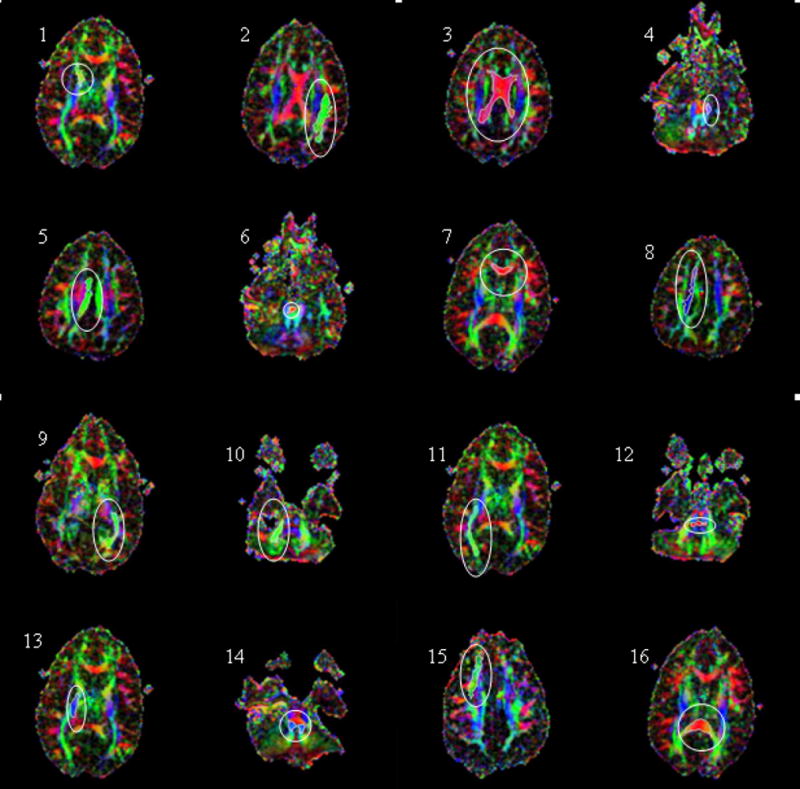
ROQS segmentation of various structures in the brain displayed on axial directionally encoded color FA images. The ability of ROQS to trace a variety of structures demonstrates its robustness. ROIs shown in white within each white ellipse are 1) Anterior limb of internal capsule; 2) Arcuate Fasciculus; 3) Body of the Corpus Callosum; 4) Cerebral Peduncle; 5) Cingulum; 6) Decussation of Superior Cerebellar Peduncle; 7) Genu of Corpus Callosum; 8) High Centrum Semiovale; 9) Optic Radiations; 10) Middle Cerebellar Peduncle; 11) Inferior Longitudinal Fasciculus; 12) Pontine Crossing Tract; 13) Posterior Limb of Internal Capsule; 14) Superior Cerebellar Peduncle; 15) Superior Longitudinal Fasciculus; 16) Splenium of Corpus Callosum
The algorithm is designed to terminate segmentation when the principal direction of diffusion changes to an orthogonal direction because the boundary of many structures is adjacent orthogonal white matter structures. In structures with high curvature areas, ROQS segmentation will terminate prematurely. At this junction, users are to assign multiple seed pixels in each region such that the final ROI is a composite of the regions selected by each seed pixel. Furthermore, ROQS can be extended to 3 dimensions for 3D segmentation of white matter structures. Oftentimes, a structure appears on more than one slice so it is necessary to select multiple single plane ROIs in order to select the entire structure. This can be done by placing seed pixels in each slice or by allowing the fourth step of ROQS, the boundary defining chain algorithm, to continue in three dimensions. Figure 6 demonstrates this extension of ROQS.
Figure 6.
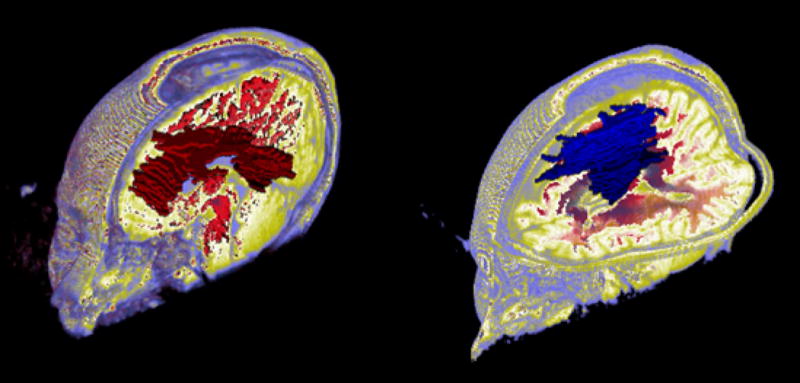
3D ROQS segmentation. On the left is a 3D ROQS segmentation of the corpus callosum. On the right is a 3D ROQS segmentation of white matter that has diffusion in the superior-inferior direction which includes the corticospinal tract.
Alternative techniques using fiber orientation for DTI analysis have been proposed. Macroscopic Orientation Component Analysis (MOCA, Wakana et al, 2005) uses orientation information to study axonal organization macroscopically and quantitatively. Unlike ROQS, MOCA may be effective for global whole brain analysis, but is not able to account for anatomic differences at the regional level. To study regional differences, the authors suggest either manual ROI delineation or Talairach-based parcellation. An important distinction is that while MOCA uses orientation information for DTI analysis, ROQS uses orientation information for DTI segmentation then FA and Dav values for analysis. Recently, white matter structures have also been identified using directional correlation-based region growing algorithms (DCRG, Lin et al, 2005). DCRG algorithms use the inner product of the major eigenvector of adjacent pixels, the directional correlation, to investigate the similarity of fiber tract direction in white matter tracts. While ROQS checks all pixels if they have the necessary properties before using a chain algorithm to determine the boundary, region growing approaches such as DCRG check pixels adjacent to the seed to verify if the pixel should be part of the region. If the pixel has the necessary properties it becomes a new seed, and the process repeats until adjacent pixels to the seed do not have the required properties. A major concern of region growing algorithms is that they fail to select an entire structure in the presence of a lesion because the pixel properties of the lesion are sufficiently different to stop the algorithm from proceeding. ROQS, in contrast, will select the entire structure as long as the lesion is inside the boundary of the structure. With DTI analysis of white matter structures, the goal often is to include the entire structure including a possible lesion for comparison to a normal control. Furthermore, region growing algorithms are an iterative process, and thus are usually computer intensive unlike ROQS which determines the boundary nearly instantaneously after the seed pixel is chosen.
DTI can be used to provide assessment of white matter tract integrity for a number of clinical disorders and conditions. When using ROI analysis, typically a subject’s FA from a structure is compared to a population of normal controls. In cases such as traumatic brain injury or multiple sclerosis, often times many regions need to be examined. Manual ROI tracings can be laborious and tedious. ROQS offers an alternative that may be faster and with less variability.
Errors in the ROQS approach can be due to the intrinsic limitations of DTI. These are noise effects, magnetic susceptibility effects, and partial volume averaging effects. The advent of parallel imaging in conjunction with higher field strength magnets and better gradients ameliorate a number of these limitations. ROQS may have even greater potential when used in conjunction with these technical advances for many scientific and clinical applications of DTI. It is also important to note that patient positioning in the scanner may have an effect on ROQS. ROQS was tested to operate on scans prescribed to align the anterior commisure and posterior commisure. Large deviations from this orientation can influence the x, y, and z components of the eigenvector so that the corpus callosum is no longer oriented primarily in the right-left direction. In such a case, ROQS will still be able to segment the corpus callosum, but multiple seed pixels may need to be assigned. Alternatively, one can apply ROQS on a reoriented data set.
In conclusion, ROQS can be exploited to segment 2D structures for subsequent ROI analysis. Data presented in this report demonstrates that ROQS can segment the corpus callosum much faster than manual (ROI) delineation, and with better reproducibility. ROQS offers an alternative to identifying white matter structures by avoiding possible errors introduced by an operator during manual ROI delineation.
Acknowledgments
This work was supported by a National Science Foundation grant to B.D.M. (REC-0337715), which partially supported S.N., and also by the James S. McDonnell Foundation through a collaborative grant to the Brain Trauma Foundation which funded the scans reported. We would like to thank Dr. Zimmerman and Dr. Johnson for providing clinical assessment of the MRI.
Footnotes
Publisher's Disclaimer: This is a PDF file of an unedited manuscript that has been accepted for publication. As a service to our customers we are providing this early version of the manuscript. The manuscript will undergo copyediting, typesetting, and review of the resulting proof before it is published in its final citable form. Please note that during the production process errors may be discovered which could affect the content, and all legal disclaimers that apply to the journal pertain.
References
- Arfanakis K, Haughton VM, Carew JD, Baxter PR, Dempsey RJ, Meyerand ME. Diffusion Tensor MR Imaging in Diffuse Axonal Injury. AJNR Am J Neuroradiology. 2002;23:794–802. [PMC free article] [PubMed] [Google Scholar]
- Ashburner J, Friston KJ. Voxel-based morphometry—the methods. Neuroimage. 2000;11 (6 Pt 1):805–821. doi: 10.1006/nimg.2000.0582. [DOI] [PubMed] [Google Scholar]
- Ashton EA, Takahashi C, Berg MJ, Goodman A, Totterman S, Ekholm S. Accuracy and Reproducibility of Manual and Semiautomated Quantification of MS Lesions by MRI. JMRI. 2003;17:300–308. doi: 10.1002/jmri.10258. [DOI] [PubMed] [Google Scholar]
- Basser PJ, Mattiello J, LeBihan D. MR diffusion tensor spectroscopy and imaging. Biophys J. 1994;66(1):259–267. doi: 10.1016/S0006-3495(94)80775-1. [DOI] [PMC free article] [PubMed] [Google Scholar]
- Beaulieu C, Plewes C, Paulson LA, Roy D, Snook L, Concha L, Phillips L. Imaging brain connectivity in children with diverse reading ability. NeuroImage. 2005;25(4):1266–1271. doi: 10.1016/j.neuroimage.2004.12.053. [DOI] [PubMed] [Google Scholar]
- Bueno G, Musse O, Heitz F, Armspach JP. Three-dimensional segmentation of anatomical structures in MR images on large data bases. Magnetic Resonance Imaging. 2001;19:73–88. doi: 10.1016/s0730-725x(00)00226-5. [DOI] [PubMed] [Google Scholar]
- Ciccarelli O, Toosy AT, Parker GJM, Wheeler-Kingshott CAM, Barker GJ, Miller DH, Thompson AJ. Diffusion tractography based group mapping of major white-matter pathways in the human brain. NeuroImage. 2003;19:1545–1555. doi: 10.1016/s1053-8119(03)00190-3. [DOI] [PubMed] [Google Scholar]
- Dade LA, Gao FQ, Kovacevic N, Roy P, Rockel C, O’Toole CM, Lobaugh NJ, Feinstein A, Levine B, Black SE. Semiautomatic brain region extraction: a method of parcellating brain regions from structural magnetic resonance images. NeuroImage. 2004;22:1492–1502. doi: 10.1016/j.neuroimage.2004.03.023. [DOI] [PubMed] [Google Scholar]
- Eriksson SHm rug-Gunn FJ, Symms MR, Barker GJ, Duncan JS. Diffusion tensor imaging in patients with epilepsy and malformations of cortical development. Brain. 2001;124(Pt3):617–626. doi: 10.1093/brain/124.3.617. [DOI] [PubMed] [Google Scholar]
- Friston KF. Commentary and opinion: II. Statistcal parametric mapping: ontology and current issues. J Cereb Blood Flow Metab. 1995;15(3):361–370. doi: 10.1038/jcbfm.1995.45. [DOI] [PubMed] [Google Scholar]
- Good CD, Johnsrude I, Ashburner J, Henson RN, Friston KJ, Frackowiak RS. Cerebral asymmetry and the effects of sex and handedness on brain structure: a voxel-based morphometric analysis of 465 normal adult human brains. NeuroImage. 2001;14(3):685–700. doi: 10.1006/nimg.2001.0857. [DOI] [PubMed] [Google Scholar]
- Grenander U, Miller M. Computational anatomy: an emerging discipline. Q Appl Math. 1998;56(4):617–694. [Google Scholar]
- Huisman TA, Schwamm LH, Schaefer PW, Koroshetz WJ, Shetty-Alva N, Ozsunar Y, Wu O, Sorensen AG. Diffusion tensor imaging as potential biomarker of white matter injury in diffuse axonal injury. AJNR Am J Neuroradiol. 2004;25(3):370–376. [PMC free article] [PubMed] [Google Scholar]
- Huisman TA, Sorensen AG, Hergan K, Gonzalez RG, Schaefer PW. Diffusion-weighted imaging for the evaluation of diffuse axonal injury in closed head injury. J Comput Assist Tomogr. 2003;27(1):5–11. doi: 10.1097/00004728-200301000-00002. [DOI] [PubMed] [Google Scholar]
- Jones DK, Symms MR, Cercignani M, Howard RJ. The effect of filter size on VBM analyses of DT-MRI data. Neuroimage. 2005 Jun;26(2):546–54. doi: 10.1016/j.neuroimage.2005.02.013. [DOI] [PubMed] [Google Scholar]
- Kubicki M, Westin CF, Maier SE, Frumin M, Nestor PG, Salisbury DF, Kikinis R, Jolesz FA, McCarley RW, Shenton ME. Uncinate fasciculus findings in schizophrenia: a magnetic resonance diffusion tensor imaging study. Am J Psychiatry. 2002;159(5):813–820. doi: 10.1176/appi.ajp.159.5.813. [DOI] [PMC free article] [PubMed] [Google Scholar]
- Lee C, Huh S, Ketter TA, Unser M. Automated Segmentation of the Corpus Callosum in Midsagittal Brain Magnetic Resonance Images. Optical Engineering. 2000;39(4):924–935. [Google Scholar]
- Lee ZI, Byun WM, Jang SH, Ahn SH, Moon HK, Chang Y. Diffusion tensor magnetic resonance imaging of microstructural abnormalities in children with brain injury. Am J Phys Med Rehabil. 2003;82(7):556–559. doi: 10.1097/01.PHM.0000073830.15643.6A. [DOI] [PubMed] [Google Scholar]
- Lundervold A, Taxt T, Duta N, Jain AK. Model-Guided Segmentation of Corpus Callosum in MR Images. Proceedings of IEEE on CPVR. 1999:231–237. [Google Scholar]
- Mazziotta JC, Toga AW, Evans A, Fox P, Lancaster J. A probabilistic atlas of the human brain: theory and rationale for its development. The International Consortium for Brain Mapping (ICBM) Neuroimage. 1995;2(2):89–101. doi: 10.1006/nimg.1995.1012. [DOI] [PubMed] [Google Scholar]
- Mukherjee P, Bahn MM, McKinstry RC, Shimony JS, Cull TS, Akbudak E, Snyder AZ, Conturo TE. Differences between gray matter and white matter water diffusion in stroke: diffusion-tensor MR imaging in 12 patients. Radiology. 2000;215(1):211–20. doi: 10.1148/radiology.215.1.r00ap29211. [DOI] [PubMed] [Google Scholar]
- Mukherjee P, Miller JH, Shimony JS, Conturo TE, Lee BC, Almli CR, McKinstry RC. Normal brain maturation during childhood: developmental trends characterized with diffusion-tensor MR imaging. Radiology. 2001;221(2):349–358. doi: 10.1148/radiol.2212001702. [DOI] [PubMed] [Google Scholar]
- Niogi SN, McCandliss BD. Left lateralized white matter microstruture accounts for individual differences in reading ability and disability. Neuropsychologia. 2006;44(11):2178–88. doi: 10.1016/j.neuropsychologia.2006.01.011. [DOI] [PubMed] [Google Scholar]
- Park HJ, Kubicki M, Shenton ME, Guimond A, McCarley RW, Maier SE, Kikinis R, Jolesz FA, Westin CF. Spatial normalization of diffusion tensor MRI using multiple channels. NeuroImage. 2003;20:1995–2009. doi: 10.1016/j.neuroimage.2003.08.008. [DOI] [PMC free article] [PubMed] [Google Scholar]
- Peled S, Gudbjartsson H, Westin CF, Kikinis R, Jolesz FA. Magnetic resonance imaging shows orientation and asymmetry of white matter fiber tracts. Brain Res. 1998;780(1):27–33. doi: 10.1016/s0006-8993(97)00635-5. [DOI] [PubMed] [Google Scholar]
- Pierpaoli C, Jezzard P, Basser PJ, Barnett A, Di Chiro G. Diffusion tensor MR imaging of the human brain. Radiology. 1996;201(3):637–648. doi: 10.1148/radiology.201.3.8939209. [DOI] [PubMed] [Google Scholar]
- Quarantelli M, Larobina M, Volpe U, Amati G, Tedeschi E, Ciarmiello A, Brunetti A, Galderisi S, Alfano B. Stereotaxy-Based Regional Brain Volumetry Applied to Segmented MRI: Validation and Results in Deficit and Nondeficit Schizophrenia. NeuroImage. 2002;17:373–384. doi: 10.1006/nimg.2002.1157. [DOI] [PubMed] [Google Scholar]
- Rugg-Gunn FJ, Eriksson SH, Symms MR, Barker GJ, Duncan JS. Diffusion tensor imaging of cryptogenic and acquired partial epilepsies. Brain. 2001;124(Pt3):627–636. doi: 10.1093/brain/124.3.627. [DOI] [PubMed] [Google Scholar]
- Thompson PM, Toga AW. Detectino, visualization and animation of abnormal anatomic structure with a deformable probabilistic brain atlas based on random vector field transformations. Med Image Anal. 1997;1(4):271–294. doi: 10.1016/s1361-8415(97)85002-5. [DOI] [PubMed] [Google Scholar]
- Tisserand DJ, Pruessner JC, Arigita EJS, van Boxtel MPJ, Evans AC, Jolles J, Uylings HBM. Regional Frontal Cortical Volumes Decrease Differentially in Aging: An MRI Study to Compare Volumetric Approaches and Voxel-Based Morphometry. NeuroImage. 2002;17:657–669. [PubMed] [Google Scholar]
- Ulug A, van Zijl PC. Orientation-independent diffusion imaging without tensor diaonalization: anisotropy definitions based on physical attributes of the diffusion ellipsoid. J Magn Reson Imaging. 1999;9(6):804–813. doi: 10.1002/(sici)1522-2586(199906)9:6<804::aid-jmri7>3.0.co;2-b. [DOI] [PubMed] [Google Scholar]
- Virta A, Barnett A, Pierpaoli C. Visualizing and characterizing white matter fiber structure and architecture in the human pyramidal tract using diffusion tensor MRI. Magn Reson Imaging. 1999;17:1121–1133. doi: 10.1016/s0730-725x(99)00048-x. [DOI] [PubMed] [Google Scholar]
- Wakana S, Jiang H, Nagae-Poetscher LM, van Zijl P, Mori S. Fiber Tract-based Atlas of Human White Matter Anatomy. Radiology. 2004;230(1):77–87. doi: 10.1148/radiol.2301021640. [DOI] [PubMed] [Google Scholar]
- Wakana S, Nagae-Poetscher LM, Jiang H, van Zijl P, Golay X, Mori S. Macroscopic Orientation Component Analysis of Brain White Matter and Thalamus Based on Diffusion Tensor Imaging. Magnetic Resonance in Medicine. 2005;53:649–657. doi: 10.1002/mrm.20386. [DOI] [PubMed] [Google Scholar]
- Watkins KE, Paus T, Lerch JP, Zijdenbos A, Collins DL, Neelin P, Taylor J, Worsley KJ, Evans AC. Structural asymmetries in the human brain: a voxel-based statistical analysis of 142 MRI scans. Cereb Cortex. 2001;11:868–877. doi: 10.1093/cercor/11.9.868. [DOI] [PubMed] [Google Scholar]
- Watts R, Liston C, Niogi S, Ulug A. Fiber Tracking Using Magnetic Resonance Diffusion Tensor Imaging and its Applications to Human Brain Development. Dev Disabil Res. 2003;9:168–177. doi: 10.1002/mrdd.10077. [DOI] [PubMed] [Google Scholar]
- Werring DJ, Clark CA, Barker GJ, Thompson AJ, Miller DH. Diffusion tensor imaging of lesions and normal-appearing white matter in multiple sclerosis. Neurology. 1999;52:1626–1632. doi: 10.1212/wnl.52.8.1626. [DOI] [PubMed] [Google Scholar]
- Wu CH, Horng SJ. Run-length chain coding and scalable computation of a shape’s moments using reconfigurable optical buses. IEEE Trans Syst Man Cybern B Cybern. 2004;34(2):845–855. doi: 10.1109/tsmcb.2003.817102. [DOI] [PubMed] [Google Scholar]