

Abstract
The structural characterization of small integral membrane proteins pose a significant challenge for structural biology because of the multitude of molecular interactions between the protein and its heterogeneous environment. Here, the three-dimensional backbone structure of Rv1761c from Mycobacterium tuberculosis has been characterized using solution NMR spectroscopy and dodecylphosphocholine (DPC) micelles as a membrane mimetic environment. This 127 residue single transmembrane helix protein has a significant (10 kDa) C-terminal extramembranous domain. Five hundred and ninety distance, backbone dihedral, and orientational restraints were employed resulting in a 1.16 Å rmsd backbone structure with a transmembrane domain defined at 0.40 Å. The structure determination approach utilized residual dipolar coupling orientation data from partially aligned samples, long-range paramagnetic relaxation enhancement derived distances, and dihedral restraints from chemical shift indices to determine the global fold. This structural model of Rv1761c displays some influences by the membrane mimetic illustrating that the structure of these membrane proteins is dictated by a combination of the amino acid sequence and the protein's environment. These results demonstrate both the efficacy of the structural approach and the necessity to consider the biophysical properties of membrane mimetics when interpreting structural data of integral membrane proteins and, in particular, small integral membrane proteins.
Keywords: integral membrane protein, solution NMR, detergent micelle, residual dipolar couplings, paramagnetic relaxation enhancement, Mycobacterium tuberculosis
Introduction
Small integral membrane proteins represent a major challenge for structural biology because their stability is highly dependent upon their interactions with native membranes. This class also represents a considerable fraction of the membrane proteins encoded in known genomes. For example, in the Mycobacterium tuberculosis genome more than 50% of the 1160 putative membrane proteins have just one or two transmembrane helices; 15% of the putative membrane proteins have a molecular weight less than 20 kDa, and 36% have a molecular weight less than 30 kDa.1 Both solution and solid-state NMR have made some progress with this important and sizeable class of proteins,2 and just recently, the small four-helix bundle transmembrane domain of M2 proton channel from influenza A virus has been structurally characterized by X-ray crystallography,3 by solution NMR4 and previously by solid-state NMR.5 Here, we describe the characterization by solution NMR of the M. tuberculosis membrane protein Rv1761c, a protein with a single transmembrane helix and a 10 kDa C-terminal domain.
Structural characterizations of integral membrane proteins by any of the structural technologies face many challenges at all stages from expression through data collection. Although X-ray crystallography has provided the majority of current membrane protein structures in the Protein Data Bank, most of these structures are large oligomers with a high ratio of molecular volume to hydrophobic surface area. The large molecular volume provides considerable stability for the protein structure, even in a membrane mimetic environment such that there is considerable likelihood that the native structure can be maintained. The requirement for well-ordered three-dimensional crystals has resulted in selecting membrane proteins or engineered membrane proteins capable of forming electrostatic contacts between unit cells, a necessity for crystallization. These factors discriminate against the structural characterization of small membrane proteins that have a low ratio of molecular volume to hydrophobic surface area, which explains why structural characterizations from this subclass of proteins are so rare.
Recent advances in expression,1,6–10 solution NMR sample preparation,11–16 and new approaches for obtaining structural restraints17–20 for membrane proteins have provided an excellent starting point for structural studies of α-helical membrane proteins. Because long-range 1H—1H Nuclear Overhauser Effect (NOE) restraints are frequently absent or very limited, solution NMR structural characterization is presently limited to the characterization of the polypeptide backbone and relatively few side chains. In addition, the lack of NOEs in membrane protein data has led to a search for alternative structure restraints from residual dipolar couplings (RDC) and paramagnetic relaxation enhancements (PRE) to provide additional restraints for the structural determinations.18,19,21–25 Few membrane protein structures have been solved without the use of NOE data and only recently structures have been solved utilizing both RDC and PRE data as a complement to NOEs (J.H. Bushweller and C.R. Sanders, personal communication).26,27 Solution NMR structures have been determined for several proteins with either one transmembrane helix: fd coat protein,28 Band 3 TM1 and TM2,29 glycophorin A,30 M2 TM of the nicotinic acetylcholine receptor,31 M2 protein TM from the Influenza A proton channel,4 sarcolipin,32 phospholamban,33 α and β subunits of light harvesting complex I,34 PufX35 and KCNE126; and with two TM helices: subunit C of the F1F0 ATP synthase,36 MerF,37 and TM2 and TM3 of GlyR.38 In addition, a four-helix bundle, DsbB, has just recently been published.27 None of these proteins have significant tertiary structure in their extramembranous domain with the possible exception of KCNE1, which has a 45 residue N-terminus containing two helices separated by a short loop.
The protein structurally characterized in this report, Rv1761c, is a membrane protein encoded by the M. tuberculosis genome. Rv1761c is functionally annotated under the broad category of cell wall and cell processes. Like many mycobacterial proteins, the absence of homology for Rv1761c to proteins in other genomes makes further initial functional classification difficult. In fact, many of these proteins with few homologs outside of mycobacteria are purported to carry out functions specific to mycobacteria, one of several criteria for identifying high quality drug targets. Partly due to the distinctive nature of mycobacteria, there are only two structural characterizations of mycobacterial membrane proteins in the literature: MscL39 and MspA.40 Rv1761c has a single putative transmembrane helix near the amino-terminus [residues 15–37 by TMHMM v. 2.041]. Residues 19–22 are Gly19-Pro20-Gly21-Gly22 and residues 32–35 are Gly32-Leu33-Pro34-Gly35, both are capable of supporting helix kinks. In addition, Lys28 is positioned close to the center of the predicted helix. The amino-terminus is highly charged with two aspartic acid residues, a glutamic acid and two arginine residues. The carboxyl-terminus contains 20% charged residues including four histidines; however, there is also a considerable population of hydrophobic residues providing the potential for amphipathic helices that may reside in the interfacial region of native membranes.
Results
Rv1761c topology and spin label placement
Topological information for Rv1761c was extracted from initial solution NMR data. A plot of the Cα chemical shift index in Figure 1(A) indicates two distinct helical regions (TM1a and TM1b) for the putative transmembrane (TM) helix and four additional helical regions (H3, H4, H5, and H6) in the extramembrane (EM) domain. The length and close spacing of the two TM helical regions suggests that the Rv1761c TM helix is kinked. The Cα chemical shift index data also indicates a predominantly helical EM domain except for a 25 residue segment following the TM helix. These helical regions are also clearly evident in the RDC data acquired in a 5.5% polyacrylamide gel [Fig. 1(B)] and in a negatively charged 5% 20-A polyacrylamide gel [Fig. 1(C)]. The dipolar wave analysis in Figure 1(B,C) demonstrates that the TM helix is best fit by two separate dipolar waves indicating a considerable angle between the two helical axes. This is consistent with the break in the helix suggested by the chemical shift index data. Dipolar waves are also observed in the EM domain for each helical segment. Sandwiched between the TM helix and helical regions of the EM domain is a loop. The flexibility of the loop can be probed by 1H—15N heteronuclear NOEs [Fig. 1(D)], providing a measure of local backbone motions. A decrease in heteronuclear NOEs indicates increased motion in two regions spanned by residues 34–44 and 54–57. In comparison, the heteronuclear NOEs for residues 45–53 are similar to those observed for the helices indicating similar local backbone motions for these regions.
Figure 1.

The topology of Rv1761c can be inferred from initial solution NMR data. The Cα chemical shift index (A), residual dipolar couplings in 5.5% (B), and 5% 20-A (C), polyacrylamide gel alignment media and 1H/15N-NOE intensities (D) indicate the presence of a kinked TM helix (TM1a, TM1b) and four extramembrane (EM) helices (H3, H4, H5, and H6). The Rv1761c amino acid sequence (E) is also shown. The positions of the TM domain and helices H3, H4, H5, and H6 are shown through the fitting of dipolar waves to both sets of RDC data. The fitting of the TM domain to two separate waves indicates a kink between segments TM1a and TM1b. 1H/15N-NOE data from the linker region (residues 35–60) indicate varied flexibility; the turn between residues 45–53 undergoes motion similar to the transmembrane helix and Helices H5 and H6 while the loop regions (residues 35–44 and 54–57) before and after the turn display increased dynamics. Residue numbering corresponds to wild-type Rv1761c. Data for the 24 residue amino-terminal fusion tag are not shown.
The topological and local backbone motion information was used to define sets of helical hydrogen bonds used in the structural characterization (Table I) and to determine optimal placements for spin labels throughout Rv1761c. Ideally, spin labels would be spaced evenly throughout the protein in regions with similar local backbone motions. Placing spin labels in areas of increased backbone motion would require the use of individual rotational correlation times in place of the global rotational correlation time used here and in previous work.19,22 Furthermore, due to the r−6 dependence of PRE distances, increased motion at the spin label site would result in heavier weighting of shorter distances, potentially leading to a distorted structure if such PRE distances were used from dynamic sites. This potential problem could be resolved by using a complex ensemble refinement approach to account for increased spin label motion.42 However, previous studies have shown that by avoiding placement of spin labels in regions with increased local backbone motions, reliable structures can be calculated under the assumption that the electron-nuclear correlation time is approximately equal to the global rotational correlation time.19,22
Table I.
Structural Statistics for the 30 Lowest Energy Backbone Structures of Rv1761c
| Rv1761c | |
|---|---|
| NMR distance and dihedral constraints | |
| Distance constraints | |
| Total paramagnetic relaxation enhancement distances | 162 |
| F30C-mtsl | 53 |
| S48C-mtsl | 75 |
| S102C-mtsl | 34 |
| Total NOE | 0 |
| Hydrogen bondsa | 36 |
| Total dihedral angle restraints | 210 |
| φ | 105 |
| ψ | 105 |
| Total 1H-15N residual dipolar couplings | 218 |
| 5.5% polyacrylamide gel (neutral)b | 113 |
| 5% 20-A polyacrylamide gel (charged)c | 105 |
| Structure statistics | |
| Violations (mean and s.d.) | |
| Distance constraints (Å) | 0.311 ± 0.025 |
| Dihedral angle constraints (°) | 2.613 ± 0.454 |
| Max. dihedral angle violation (°) | 5.38 ± 0.411 |
| Max. distance constraint violation (Å) | 1.40 ± 0.125 |
| Validation Results | |
| 1H-15N residual dipolar couplings | |
| 5.5% polyacrylamide gel Rwork/Rfree | 9.97/20.91 |
| 5% 20-A polyacrylamide gel Rwork/Rfree | 14.98/27.61 |
| Paramagnetic relaxation enhancement distances | |
| Q-factor | 11.19 |
| Deviations from idealized geometry | |
| Bond lengths (Å) | 0.009 ± 0.001 |
| Bond angles (°) | 1.318 ± 0.129 |
| Impropers (°) | 1.590 ± 0.080 |
| Average pairwise r.m.s. deviationd (Å) | |
| Backbone | |
| All residues (1–127) | 1.156 ± 0.179 |
| Transmembrane domain (7–30) | 0.404 ± 0.110 |
| Helical regions (59–67, 73–86, 90–103, and 110–120) | 0.874 ± 0.165 |
i to i + 4 hydrogen bonds inferred from helical regions determined by dipolar wave analysis of 1H-15N residual dipolar couplings.
Experimental versus calculated residual dipolar coupling correlation factor = 0.999.
Experimental versus calculated residual dipolar coupling correlation factor = 0.997.
Pairwise r.m.s. deviation was calculated among 30 refined structures.
The positioning of spin labels, guided by the initial NMR data, for F30C, S48C, and S102C resulted in high quality spectra being obtained. The incorporation of spin labels at these sites introduced only small chemical shift perturbations limited to residues near the mutation sites indicating that the presence of the spin label did not significantly alter the protein structure. Chemical shift perturbations were small enough to allow for resonance assignment of spin labeled Rv1761c by comparison to spectra of wild-type Rv1761c. The positioning of spin labels allowed for placement of paramagnetic groups near the TM domain (F30C) and at two disparate positions within the EM domain (S48C and S102C). The 1H/15N-HSQC spectra in Figure 2(A,B) illustrate the high quality spectra that are observed for diamagnetic, dMTSL, labeled [Fig. 2(A)] and paramagnetic, MTSL, labeled [Fig. 2(B)] Rv1761c. Observable reductions in intensity due to PRE were observed for 53, 75, and 34 of the 118 resolved Rv1761c backbone amide resonances for spin labeled F30C-, S48C-, and S102C-Rv1761c, respectively. A plot of the normalized PRE intensity ratio versus residue number for F30C-Rv1761c is shown in Figure 2(C).
Figure 2.
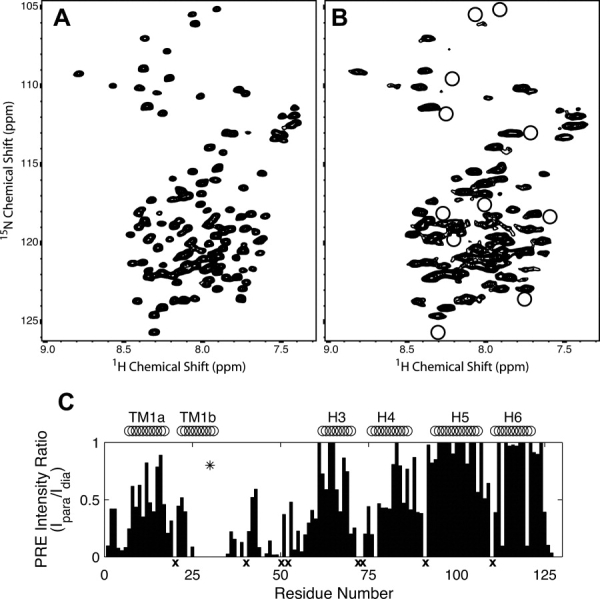
A comparison of 1H/15N-HSQC spectra of samples with diamagnetic and paramagnetic labels. Spectra acquired for diamagnetic dMTSL-labeled (A) and paramagnetic MTSL-labeled (B) F30C-Rv1761c illustrate resonance broadening due to paramagnetic relaxation enhancement (PRE). Residues in the paramagnetic sample (B) that were broadened so that they were no longer detectable are circled. An intensity plot shows the normalized PRE intensity ratio (Ipara/Idia) used to calculate PRE-derived distances used for Rv1761c structural calculations (C). The location of the spin label at F30C (asterisk) and locations of the TM helix and EM helices H3, H4, H5, and H6 are also shown. Residues for which no 1H/15N resonances were observed are marked with an x (C).
Rv1761c backbone structure in DPC micelles
Calculation of the Rv1761c backbone structure in DPC micelles utilized torsion angle restraints calculated with TALOS,43 orientational restraints from two RDC datasets with different alignment tensors [Fig. 1(B,C)] and distance restraints from PRE data. Although both torsion angle and RDC restraints provide valuable information, these restraints alone are not enough to converge a set of structures. The inclusion of long-range distance restraints from PRE data was necessary to produce the structures shown in Figure 3. Distance bounds for reliable PRE distances (i.e., those calculated from intensity ratios between 15 and 85%) of ±2 Å19 and ±4 Å22 have been proposed as suitable limits for structural calculations. Here, we have used distance bounds of ±3 Å for reliable PRE distances. The ±3 Å bounds correspond to ∼12–20% error in the calculated PRE distances.
Figure 3.
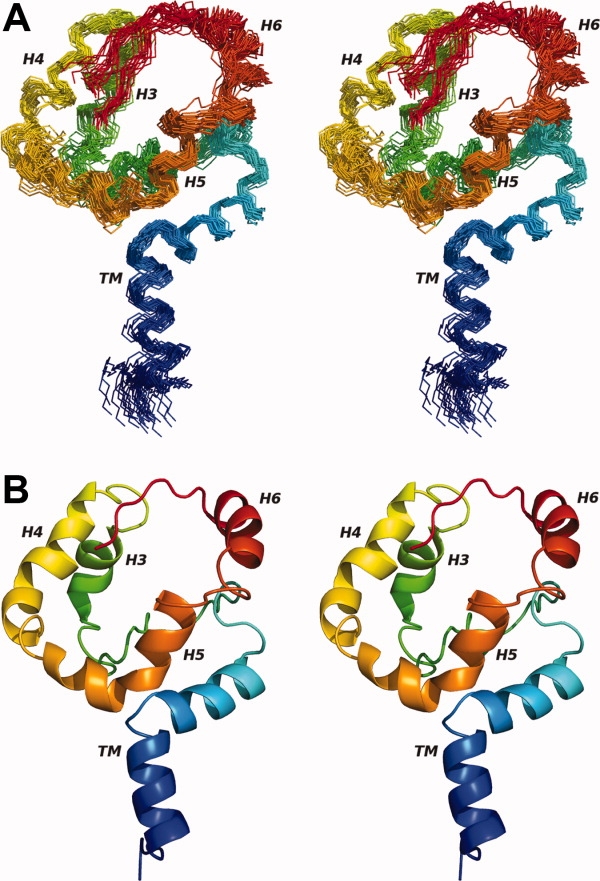
The 30 lowest energy backbone structures (A) are shown in a wide-eyed stereo diagram along with a ribbon diagram of the lowest energy structure (B). The ribbon representation clearly shows the kink of the TM helix and helical propensity of the EM domain. Both diagrams are colored from blue (amino terminus) to red (carboxyl terminus). Structures are aligned to the average backbone structure using all NH, Cα, and C′ atoms. Figure generated using PyMOL.44
Rv1761c (see Fig. 3) exhibits an “umbrella structure” in DPC micelles that is relatively well defined with an rmsd of 1.16 Å over all backbone NH, Cα, and C′ atoms for a family of 30 Rv1761c structures. The structures in Figure 3 exhibit a number of key features suggested by initial solution NMR data. The presence of a kinked transmembrane domain was suggested by the Cα chemical shift index and RDC data and is now confirmed by the set of structures, as are the four helices within the EM domain, consistent with the observations of dipolar waves.
The TM helix was tightly defined within the structural family at 0.40 Å rmsd for the backbone heavy atoms as shown in Figure 4. The small variation in structure indicated by both orientational and distance restraints and the large heteronuclear NOE intensities suggest that the TM domain is relatively rigid in a 70° kinked conformation. The kink occurs in a Gly-Pro-Gly-Gly sequence and is therefore not a particularly surprising observation. Glycine and proline residues not only support a uniform transmembrane helical structure45,46 but also induce kinks in these structures,47–50 which are known as “pro-kink” sites.51 Here, the presence of four sequential “pro-kink” residues results in a dramatic kink that involves two of these residues, Gly19 and Pro20, whereas the other two residues are helical (see Fig. 4). Charged residues occur on either end of the TM helix (Arg7, Arg10, and Lys28) where these groups are available to snorkel to the native membrane interfacial region.52–57
Figure 4.
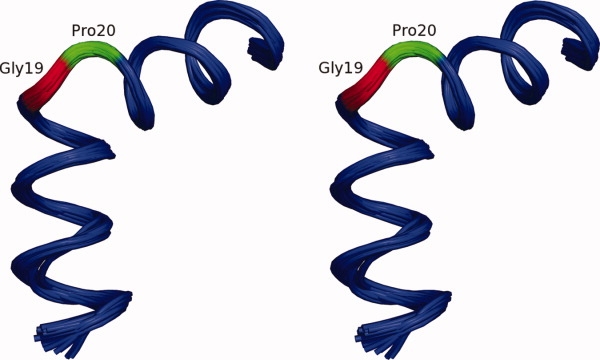
The kinked TM domain in stereo view was tightly defined within the structure family at a backbone rmsd of 0.40 Å. Despite the 70° kink at the Gly19-Pro20-Gly21-Gly22 sequence, the departure from helical structure is limited to residues Gly19 (red) and Pro20 (green). Structures are aligned to the average backbone structure using the NH, Cα, and C′ atoms for residues 7–30. Figure generated using PyMOL.44
Residues 59–67 (Helix 3), 73–86 (Helix 4), 90–103 (Helix 5), and 110–120 (Helix 6) delineate four helical segments. Helices 4 and 5 are amphipathic, each having a helical wheel where the charged residues are restricted to a 120° arc and the other polar residues are a few glycine residues. The entire stretch of amino acids from 74 to 103 could be described by a single helix with a large 90° kink in the middle just as well as by two separate helical segments (Helices 4 and 5). The break between Helix 4 and 5 appears to be dictated by Glu87, which would otherwise be in the middle of the hydrophobic surface of the helix. The U-shaped set of helices (Helices 4–6) (see Fig. 5) appears to be consistently oriented to interact with the interfacial region of the micelle and presumably that of the lipid bilayer. Helix 3 is hydrophilic and appears to interact primarily with the aqueous environment. Helix 6 appears to be anomalous in that it is amphipathic but its hydrophobic surface is not coplanar with that of Helices 4 and 5. The carboxy terminus and the lengthy loop between the transmembrane helix and Helix 3 appear to interact with the hydrophilic surfaces of Helices 3–5, as well as the aqueous environment.
Figure 5.

The EM domain of Rv1761c is characterized by a set of four helices (A, B). These four helices are organized such that H4 and H5 are co-planar and both H3 and H6 are behind the H4/H5 plane (A, B). The helical domain is shown as a ribbon model (A) and a backbone trace for the 30 lowest energy structures (B) colored in a rainbow (as in Fig. 3A, B). The 30 superimposed backbone structures (B) are aligned to the average backbone structure using NH, Cα, and C′ atoms from helices H3, H4, H5, and H6 (Residues 59–67, 73–86, 90–103, and 110–120). The U-shaped H4/H5 helical pair forms a hydrophobic surface (C) with the amphipathic Helix H6 situated just below the H4/H5 plane and the hydrophilic Helix H3 located well below the H4/H5 plane (D). For C, D positively charged residues are colored red (Arg, His, Lys), negatively charged residues are colored blue (Asp, Glu), nonpolar residues are colored grey (Ala, Gly, Ile, Leu, Met, Pro, Phe, Ser, Thr, Val) and polar uncharged residues are colored green (Asn, Cys, Gln, Trp, Tyr). Throughout this figure, the flexible carboxyl terminal region (residues 122–127) and the flexible linker region between the TM and H3 are not shown. Arrows and axes indicate the approximate rotations used to transform between the orientations depicted in A, C, and D. Figure generated using PyMOL.44.
Rv1761c structure validation
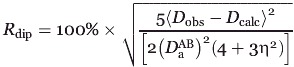
To examine the quality of the determined structures, validations of both RDC and PRE data were performed. All RDC data utilized in the structure calculation were subjected to validation by calculation of the dipolar coupling R-factor Rdip58 given by
 |
1 |
where D is the axial component of the alignment tensor, η is the rhombicity, Dobs is the experimentally observed RDC, and Dcalc is the RDC back-calculated from the Rv1761c structure by singular value decomposition using Xplor-NIH. The Rdip values for RDC data used in the structure calculation indicate good agreement between observed and back-calculated RDC data as Rdip(work) was 9.97% and 14.98% for the 5.5% and 5% 20-A polyacrylamide gel datasets, respectively. Complete cross validation for the RDC data was carried out by random partitioning into 10 pairs of working and test sets where 90% of the data was used as the working set to calculate the Rv1761c structure and 10% was used as the test set and thus excluded from structural calculations. Following simulated annealing for each pair of working and test sets, Rdip values were calculated for each set and averaged to yield Rdip(free) values of 20.91% and 27.61% for the 5.5% and 5% 20-A polyacrylamide gel datasets, respectively. The factor of two difference between Rdip(work) and Rdip(free) for both RDC datasets indicates that the RDC data played an important role in the Rv1761c structure determination. 58 The fit between observed and average calculated RDC data for both the 5.5% and 5% 20-A polyacrylamide datasets is shown in Figure 6(A,B). The correlation coefficients (r) were 0.999 and 0.997 for the 5.5% PAG and 5% 20-A PAG RDC datasets, respectively.
Figure 6.
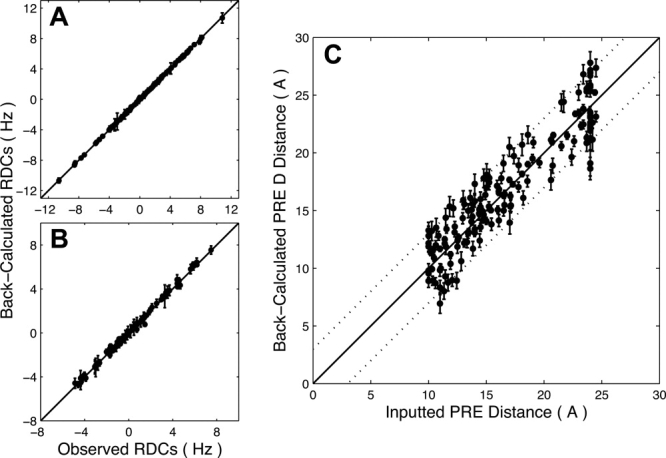
Good correlations are seen for observed and back-calculated RDC and PRE data. Correlation coefficients were r = 0.999 for 5.5% (A) and r = 0.997 for 5% 20-A (B) polyacrylamide gel RDC data. Observed RDC data points are the experimental values used for the structure calculation. Back-calculated RDC data points represent the average value of each RDC determined by SVD using Xplor-NIH for the 30 calculated structures. Error bars represent the rmsd for each back-calculated dipolar coupling over the family of 30 structures (error bars for some 5.5% neutral PAG and 5% 20-A PAG data points are smaller than the symbols shown). Average PRE distances calculated from the structure family (back-calculated) agree well with the PRE distance data used for the structural calculations (C). The correlation coefficient for PRE distance data was r = 0.926. Dotted lines indicate ±3 Å error bounds for the PRE distance data. PRE distance error bars represent the rmsd for each back-calculated PRE distance over the family of 30 structures.
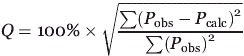
PRE distance data cross validation was completed using a similar scheme, but first, the ±3 Å error range is similar to that used by previous PRE studies and compensates for potential errors in the approximation of the rotational correlation time τc, and in determination of the relaxation rate enhancement through the intensity ratio method.59 Attempts to lower the PRE distance bounds to ±2 Å, the bounds used for the structure calculation of OmpA19 resulted in number of distance violations greater than 0.5 Å indicating that ±2 Å bounds were inappropriate for the Rv1761c data. For the cross validation, the PRE distances were randomly partitioned into 10 pairs of working and test sets and structures were calculated for each pair. A quality factor, Q, was calculated for each pair of working and test sets as
 |
2 |
where Pobs is the PRE distance inputted into the structure calculation and Pcalc is the PRE distance back-calculated from the Rv1761c structure. Equation (2) is a modified version of the PRE Q-factor used in previous studies42,60 and reflects the use of PRE distances in place of relaxation rate enhancements for structure calculation.19,22 Good agreement was observed between PRE distances entered into the structural calculations and those back-calculated from the structure family as the average Q-factor over all 10 working and test set pairs (cross validated Qave) was 11.19%. This agreement is illustrated in Figure 6(C) as the average back-calculated and observed PRE distances exhibit good correlation (r = 0.926). Furthermore, the even distribution about the line of perfect agreement indicates that the distances are not affected by systematic error or a strong bias due to r−6 averaging.
Discussion
Small integral membrane proteins have been particularly challenging for structural biologists. These proteins are difficult to characterize because of the relatively weak intra-protein interactions compared with those between the protein and its environment and because these proteins commonly have multiple distinct functional states. Consequently, small membrane proteins are particularly sensitive to the composition of this environment. Indeed, changes in the native environment may induce conformational transitions between functional states for some membrane proteins. Detergents are almost exclusively used for crystallographic and solution NMR sample preparation for membrane proteins. For transmembrane peptides and for large proteins, especially those with ligands in the transmembrane domain, there have been many success stories in using detergents. However, for proteins with one or two transmembrane helices that are not oligomeric and for which there is a significant extramembranous domain the influence of detergents on the protein structure can be substantial. In fact, detergents have at least two characteristics for extramembranous domains that may influence the protein's fold. First, the shape of the micelle is very plastic and significantly curved micellar surfaces may be present in detergent/protein complexes. Consequently, the hydrophobic slab associated with lipid bilayers and native membranes is significantly distorted in a detergent environment. Secondly, detergents have a much higher monomer concentration (even above the critical micelle concentration) than lipids in the presence of lipid bilayers. Therefore, there is a significant concentration of monomeric detergent in the aqueous environment of the extramembranous domain that could influence the protein's conformation.
Unlike lipid bilayers, which have two surfaces, the detergent micelle is characterized by a single surface exposed to the aqueous environment. Consequently, there is no defined separation of surfaces for micelles and no requirement for a transmembrane helix to span a defined hydrophobic dimension or path. This permits the transmembrane helix to be more extensively exposed to the interfacial region and the bilayer's more hydrophilic environment. The increased water concentration, the hydrophilic nature of the interfacial region, and the presence of a single surface helps to explain the 70° kink in the transmembrane helix characterized here. Although the native conformations for this protein may have a kinked helix, it is unlikely to make such a large kink angle, as this would prevent the helix from spanning the membrane and it would expose the carbonyl oxygens at the kink site to the low dielectric of the membrane interstices.61,62 Such exposure of the backbone carbonyl oxygens in the middle of a transmembrane helix to the hydrophobic environment in the membrane hydrocarbon core would be energetically unfavorable.63,64 In other words, the membrane interior favors helical secondary structures that satisfy the hydrogen bonding potential of the backbone.46,65,66 The structure characterized here, however, confirms that this transmembrane helix has the potential to form a kink in its Gly-Pro-Gly-Gly sequence and suggests that this may be an important structural switch related to the functional states of this protein.
The extramembrane domains of small integral membrane proteins may or may not interact with the micelle and native membrane surface. Here, considerable evidence is presented that at least Helices 4 and 5 and possibly Helix 6 interact with the micelle interfacial region and presumably with the bilayer interface in native membranes. Although the hydrophobic membrane interstices provide an environment that stabilizes uniform α-helices the very high dielectric constant (>200)67 of the bilayer interface may have the opposite influence. This is not to say that the micelle interface does not aid in the formation of helices,63,65 but increased competition for hydrogen bonds promotes hydrogen bond exchange68,69 and potentially allows for a variety of helical structures (J.R. Long, personal communication). Consequently, the uniformity of helical structures may be reduced in this interfacial environment, whether it be in a micelle or bilayer. Previous studies have also observed micelle induced helical distortions of amphipathic helices.26,70–72 Here, bends and gaps in Helices 4 and 5 are observed that result in a relatively compact structure with a considerable interface to the micelle and hence bilayer surface. It is possible that the conformation of Helix 6 may have been influenced by these factors as well. Helix 6 is likely to be part of the complex that binds to the interfacial region, but because the hydrophobic helical surface is not coplanar with those of Helices 4 and 5, the interaction with Helix 6 is not certain.
In addition to local environmental influences, the transmembrane and extramembranous domains do not appear to have an appropriate relative orientation. It might be anticipated that the transmembrane helix and the approximate Helix 4/Helix 5 plane should be approximately orthogonal. However, for a variety of reasons already discussed it is not surprising that this is not observed. Finally, we should point out that the regions of the protein with significantly increased local dynamics are not well constrained. Because the majority of the extramembranous domain forms a well-defined structure, we suspect that the dynamics observed in the linker and C-terminal segment are also features of the protein in its native environment. The use of RDCs and PREs as primary restraints limits structural interpretation when considerable dynamics are present. Of course, this is also a problem with other structural technologies; however, for the structural data observed from these dynamic regions, it is important to avoid over-interpreting these results without quantifying the dynamics first.
Although several imperfections induced by the micelles have been described, there are numerous significant structural insights obtained from this study of Rv1761c, a member of a membrane protein subclass that is particularly challenging and yet common in cellular membranes. Indeed, this appears to be the first full-length protein in this subclass to be structurally characterized without the aid of NOE restraints. The protein is shown to have a single transmembrane helix that is kinked at a Gly-Pro site providing a potential structural switch for the protein's unknown function. The extramembrane domain is associated with the micellar and presumably the bilayer surface as opposed to being a fully water soluble domain. Much of this domain is helical with minimal dynamics, but there is a substantial and dynamic loop, as well as a hydrophilic helix between the transmembrane helix and the surface bound helix (Helices 4 and 5) complex. This structural model of full-length Rv1761c from Mycobacterium tuberculosis displays some influences by the membrane mimetic, illustrating that the structure of these membrane proteins is dictated by a combination of the amino acid sequence and the protein's environment. These results demonstrate both the efficacy of the structural approach employed here and the necessity to consider the biophysical properties of all membrane mimetics when interpreting structural data of integral membrane proteins and, in particular, small integral membrane proteins.
Materials and Methods
Protein expression and purification
Rv1761c was cloned into an in-house developed ligation independent cloning vector based upon the pMCSG7 vector.10,73 The vector construct allowed for expression of an Rv1761c fusion protein consisting of all 127 native Rv1761c residues and an amino terminal 24 residue, TEV protease cleavable His6 tag. Protein was expressed in Escherichia coli BL21(DE3)-CodonPlus RP host cells using a four-to-one concentrating method74 allowing for reduced isotope consumption while producing up to 100 mg protein per liter of minimal media.15 Protein was isolated and purified using Ni2+ affinity chromatography via a reconstitution method as previously described.15
NMR sample preparation
Rv1761c NMR samples contained 1 mM Rv1761c, 20 mM sodium acetate, pH 4, and 150 mM dodecylphosphocholine (DPC, Anatrace). All NMR experiments were acquired using full-length (noncleaved) Rv1761c fusion protein. Direct spectral comparisons of TEV cleaved versus noncleaved samples revealed no discernible chemical shift perturbations. Weakly aligned samples for acquiring RDC data utilized polyacrylamide gels and were prepared as previously described.75 Neutral gels contained 5.5% polyacrylamide while negatively charged gels incorporated 5% acrylamide solution containing 20% 2-acrylamido-2-methyl-1-propanesulfonic acid (AMPS, Sigma-Aldrich). To follow proposed nomenclature for charged gels,76 the negatively charged gel is referred to as 5% 20-A polyacrylamide gel. To incorporate NMR samples into polyacrylamide gels, a 400 μL Rv1761c sample was added to the dried gel, and then the Shigemi NMR tube plunger was inserted and adjusted to a final sample height of 1.9 cm. Polyacrylamide gel samples were equilibrated for 48 h before NMR data acquisition.
Thiol-reactive spin labels were incorporated via SDSL77,78 using standard protocols19,79,80 with either paramagnetic MTSL [(1-oxyl-2,2,5,5-tetramethyl-d-3-pyrroline-3-methyl) methanethiosulfonate] (Toronto Research Chemicals) or diamagnetic dMTSL [(1-acetoxy-2,2,5,5-tetramethyl-d-3-pyrroline-3-methyl) methanethiosulfonate]. Samples were split into two equal fractions and labeled with MTSL and dMTSL, respectively. Spin label was added to each fraction at a 10 molar excess using 200 mM MTSL or dMTSL stock solutions in acetonitrile and incubated at 25°C for 4 h. An additional aliquot of MTSL or dMTSL was added at 10 molar excess followed by incubation overnight at 25°C. Samples were passed over a PD-10 desalting column (GE Healthcare) to remove unreacted spin labels. Final protein concentrations of MTSL- or dMTSL-labeled Rv1761c NMR samples were determined by a bicinchoninic acid (BCA) protein assay for accurate resonance intensity comparisons. Protein concentrations for typical spin labeled Rv1761c samples for PRE data acquistion were kept low, near 0.25 mM, to limit intermolecular PRE effects.
NMR data acquisition
Triple resonance three-dimensional NMR experiments were acquired for uniformly 15N/13C-labeled Rv1761c at 323 K using a Bruker DRX 600 MHz spectrometer equipped with a Cryoprobe. Complete backbone chemical shift assignments for 1HN, 15NH, 13Cα, 13Cβ, and 13C′ atoms were made using 1H/13C/15N-HNCA,-HNCO, -HN(CO)CA, -CBCA(CO)NH, and -HNCACB experiments. Residual dipolar coupling data was acquired using sensitivity enhanced HSQC-IPAP experiments81 for isotropic and weakly aligned 5.5% and 5% 20-A polyacrylamide gel Rv1761c samples. Dipolar wave analyses for both 5.5% and 5% 20-A polyacrylamide gel RDC datasets were performed as previously described.17,23 RDC datasets were acquired on a Bruker DRX 600 MHz spectrometer equipped with a cryoprobe. PRE data was acquired via comparisons of intensity ratios for diamagnetic and paramagnetic samples using fast 1H/15N-HSQC experiments.82 PRE datasets were acquired on a Varian Inova 600 MHz spectrometer. All NMR datasets were processed with in-house scripts using NMRPipe83 and visualized with Sparky.84 Backbone resonance assignments have resulted in assignment of 98% of 1HN, 15NH, and 13Cα resonances, 82% of 13Cβ resonances and 90% of 13C′ resonances for non-proline residues. Chemical shift assignments were made for two or more backbone atoms for all residues except Arg52, His72, and Met73 for which no resonances were observed. Backbone chemical shift assignments, predicted torsion angles, residual dipolar couplings and paramagnetic relaxation enhancement derived distances have been deposited in the BioMagResBank (BMRB) with accession number 15774.
NMR structure calculation
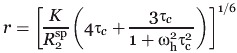
Structural calculations were performed using Xplor-NIH version 2.18 with the experimental restraints summarized in Table I. Hydrogen bonds were inferred for the six Rv1761c helices determined from Cα chemical shift index data and RDC dipolar wave analyses. Hydrogen bonds between pairs of residues were incorporated as a set of two distance restraints of 1.9 and 2.9 Å for the HN···O and NH···O distances, respectively. Backbone dihedral angle restraints included in structural calculations were predicted from assigned 15N, 13Cα, 13Cβ, and 13C′ chemical shifts using TALOS.43 Because experimental data for side chains were not incorporated into the structural calculations, all side chains were allowed complete torsional freedom. RDC restraints incorporated into the structural calculations included 113 dipolar couplings from weak alignment in a compressed 5.5% polyacrylamide gel and 105 dipolar couplings from weak alignment in a compressed negatively charged 5% 20-A polyacrylamide gel. Initial values for the axial, Da, and rhombic, η, components of the RDC alignment tensors were calculated with the extended histogram method.85 Optimized values for Da and η for each alignment tensor were obtained through a grid search procedure in Xplor-NIH implemented during structure refinement.86 A total of 162 PRE derived distance restraints from MTSL spin labels at positions F30C, S48C, and S102C were calculated using 1H/15N-HSQC paramagnetic versus diamagnetic intensity ratios and the modified Solomon-Bloembergen equation.22
 |
3 |
Equation (3) allows for the distance r between the spin label unpaired electron and the nuclear spin (amide proton) to be determined where R
 is the transverse relaxation rate enhancement due to the spin label; K is a combination of physical constants, is 1.23 × 10⁻³² cm6 s−2; ωh is the Larmor frequency of the amide proton (nuclear spin); and τc is the correlation time for the unpaired electron-nuclear spin interaction. The electron-nuclear spin interaction correlation time was approximated as the global rotational correlation time of Rv1761c in DPC micelles calculated as 19.5 ns using the Stokes-Einstein equation assuming a ca. 33 kDa protein-detergent micelle complex. It should be noted that simple calculations with the Solomon-Bloembergen equation for varied τc values indicate that large errors in τc are well tolerated and differences of ±10 ns result in ∼±1 Å error in calculated distance.22
R was calculated from the ratio of resonance intensities for paramagnetic MTSL labeled samples and diamagnetic dMTSL labeled samples as previously described.19,22,59,87 Raw peak intensities were normalized against resonances that exhibited no significant change in intensity between paramagnetic and diamagnetic spectra and confirmed by calculated structures to be >26 Å from the spin label. PRE distances for resonances that exhibited PRE intensity ratios between 15 and 85% were implemented with a ± 3 Å upper and lower bounds in structural calculations.19 PRE distances for resonances with intensity ratios below 15% were included with an upper distance limit of 15 Å.
An initial structure was generated via simulated annealing utilizing PRE, RDC, and dihedral restraints starting from an extended structure with favorable covalent geometry. Initial temperatures for refinement stages began at 3000 K with slow cooling in 12.5 K steps. The final structure family represents the 30 lowest energy accepted structures (out of 200 calculated) with favorable covalent geometries and RDC violations less than 1.5 Hz. Analysis of accepted structures by PROCHECK-NMR88 found 72% of residues located in the most favored region of the Ramachandran map, whereas 21, 5, and 3% were located in the additionally allowed, generously allowed and disallowed regions, respectively. Structural statistics for the final family of structures are listed in Table I. Atomic coordinates and restraint files for the 30 lowest energy structures have been deposited in the Protein Data Bank (PDB code 2K3M).
Acknowledgments
R.C. Page was supported by American Heart Association predoctoral fellowship 0615223B. J.D. Moore was supported by National Institutes of Health predoctoral fellowship F31NS054494. The research utilized the Biomedical Technology Resource for NMR Molecular Imaging of Proteins supported by NIH grant P41 EB002031. A portion of the NMR spectroscopy was performed at the National High Magnetic Field Laboratory supported by NSF Division of Materials Research cooperative agreement DMR-0654118 and the State of Florida.
References
- 1.Korepanova A, Gao FP, Hua Y, Qin H, Nakamoto RK, Cross TA. Cloning and expression of multiple integral membrane proteins from Mycobacterium tuberculosis in Escherichia coli. Protein Sci. 2005;14:148–158. doi: 10.1110/ps.041022305. [DOI] [PMC free article] [PubMed] [Google Scholar]
- 2.Gong XM, Franzin CM, Thai K, Yu J, Marassi FM. Nuclear magnetic resonance structural studies of membrane proteins in micelles and bilayers. Methods Mol Biol. 2007;400:515–529. doi: 10.1007/978-1-59745-519-0_35. [DOI] [PMC free article] [PubMed] [Google Scholar]
- 3.Stouffer AL, Acharya R, Salom D, Levine AS, Di Costanzo L, Soto CS, Tereshko V, Nanda V, Stayrook S, Degrado WF. Structural basis for the function and inhibition of an influenza virus proton channel. Nature. 2008;451:596–599. doi: 10.1038/nature06528. [DOI] [PMC free article] [PubMed] [Google Scholar]
- 4.Schnell JR, Chou JJ. Structure and mechanism of the M2 proton channel of influenza A virus. Nature. 2008;451:591–595. doi: 10.1038/nature06531. [DOI] [PMC free article] [PubMed] [Google Scholar]
- 5.Nishimura K, Kim S, Zhang L, Cross TA. The closed state of a H+ channel helical bundle combining precise orientational and distance restraints from solid state NMR. Biochemistry. 2002;41:13170–13177. doi: 10.1021/bi0262799. [DOI] [PubMed] [Google Scholar]
- 6.Weiss HM, Grisshammer R. Purification and characterization of the human adenosine A(2a) receptor functionally expressed in Escherichia coli. Eur J Biochem. 2002;269:82–92. doi: 10.1046/j.0014-2956.2002.02618.x. [DOI] [PubMed] [Google Scholar]
- 7.Chen Y, Song J, Sui SF, Wang DN. DnaK and DnaJ facilitated the folding process and reduced inclusion body formation of magnesium transporter CorA overexpressed in Escherichia coli. Protein Expr Purif. 2003;32:221–231. doi: 10.1016/S1046-5928(03)00233-X. [DOI] [PubMed] [Google Scholar]
- 8.Eshaghi S, Hedren M, Nasser MI, Hammarberg T, Thornell A, Nordlund P. An efficient strategy for high-throughpute expression screening of recombinant integral membrane proteins. Protein Sci. 2005;14:676–683. doi: 10.1110/ps.041127005. [DOI] [PMC free article] [PubMed] [Google Scholar]
- 9.Psakis G, Nitschkowski S, Holz C, Kress D, Maestre-Reyna M, Polaczek J, Illing G, Essen LO. Expression screening of integral membrane proteins from Helicobacter pylori 26695. Protein Sci. 2007;16:2667–2676. doi: 10.1110/ps.073104707. [DOI] [PMC free article] [PubMed] [Google Scholar]
- 10.Qin H, Hu J, Hua Y, Challa SV, Cross TA, Gao FP. Construction of a series of vectors for high throughput cloning and expression screening of membrane proteins from Mycobacterium tuberculosis. BMC Biotechnol. 2008;8:51. doi: 10.1186/1472-6750-8-51. [DOI] [PMC free article] [PubMed] [Google Scholar]
- 11.Vinogradova O, Sönnichsen FD, Sanders CR. On choosing a detergent for solution NMR studies of membrane proteins. J Biomol NMR. 1998;11:381–386. doi: 10.1023/a:1008289624496. [DOI] [PubMed] [Google Scholar]
- 12.Krueger-Koplin RD, Sorgen PL, Krueger-Koplin ST, Rivera-Torres IO, Cahill SM, Hicks DB, Grinius L, Krulwich TA, Girvin ME. An evaluation of detergents for NMR structural studies of membrane proteins. J Biomol NMR. 2004;28:43–57. doi: 10.1023/B:JNMR.0000012875.80898.8f. [DOI] [PubMed] [Google Scholar]
- 13.Tian C, Karra MD, Ellis CD, Jacob J, Oxenoid K, Sonnichsen F, Sanders CR. Membrane protein preparation for TROSY NMR screening. Methods Enzymol. 2005;394:321–334. doi: 10.1016/S0076-6879(05)94012-3. [DOI] [PubMed] [Google Scholar]
- 14.Columbus L, Lipfert J, Klock H, Millett I, Doniach S, Lesley SA. Expression, purification, and characterization of Thermatoga maritima membrane proteins for structure determination. Protein Sci. 2006;15:961–975. doi: 10.1110/ps.051874706. [DOI] [PMC free article] [PubMed] [Google Scholar]
- 15.Page RC, Moore JD, Nguyen HB, Sharma M, Chase R, Gao FP, Mobley CK, Sanders CR, Ma L, Sönnichsen FD, Lee S, Howell SC, Opella SJ, Cross TA. Comprehensive evaluation of solution nuclear magnetic resonance spectroscopy sample preparation for helical integral membrane proteins. J Struct Funct Genomics. 2006;7:51–64. doi: 10.1007/s10969-006-9009-9. [DOI] [PubMed] [Google Scholar]
- 16.Poget SF, Girvin ME. Solution NMR of membrane proteins in bilayer mimics: small is beautiful, but sometimes bigger is better. Biochim Biophys Acta. 2007;1768:3098–3106. doi: 10.1016/j.bbamem.2007.09.006. [DOI] [PMC free article] [PubMed] [Google Scholar]
- 17.Mesleh MF, Lee S, Veglia G, Thiriot DS, Marassi FM, Opella SJ. Dipolar waves map the structure and topology of helices in membrane proteins. J Am Chem Soc. 2003;125:8928–8935. doi: 10.1021/ja034211q. [DOI] [PMC free article] [PubMed] [Google Scholar]
- 18.Cierpicki T, Liang B, Tamm LK, Bushweller JH. Increasing the accuracy of solution NMR structures of membrane proteins by application of residual dipolar couplings. High-resolution structure of outer membrane protein A. J Am Chem Soc. 2006;128:6947–6951. doi: 10.1021/ja0608343. [DOI] [PMC free article] [PubMed] [Google Scholar]
- 19.Liang B, Bushweller JH, Tamm LK. Site-directed parallel spin-labeling and paramagnetic relaxation enhancement in structure determination of membrane proteins by solution NMR spectroscopy. J Am Chem Soc. 2006;128:4389–4397. doi: 10.1021/ja0574825. [DOI] [PMC free article] [PubMed] [Google Scholar]
- 20.Sanders CR, Sönnichsen FD. Solution NMR of membrane proteins: practice and challenges. Magn Reson Chem. 2006;44:S24–S40. doi: 10.1002/mrc.1816. [DOI] [PubMed] [Google Scholar]
- 21.Girvin ME, Fillingame RH. Determination of local protein structure by spin label difference 2D NMR: the region neighboring Asp61 of subunit c of the F1F0 ATP synthase. Biochemistry. 1995;34:1635–1645. doi: 10.1021/bi00005a020. [DOI] [PubMed] [Google Scholar]
- 22.Battiste JL, Wagner G. Utilization of site-directed spin labeling and high-resolution heteronuclear nuclear magnetic resonance for global fold determination of large proteins with limited nucelar overhauser effect data. Biochemistry. 2000;39:5355–5365. doi: 10.1021/bi000060h. [DOI] [PubMed] [Google Scholar]
- 23.Mesleh MF, Veglia G, Desilva TM, Marassi FM, Opella SJ. Dipolar waves as NMR maps of protein structure. J Am Chem Soc. 2002;124:4206–4207. doi: 10.1021/ja0178665. [DOI] [PMC free article] [PubMed] [Google Scholar]
- 24.Prestegard JH, Mayer KL, Valafar H, Benison GC. Determination of protein backbone structures from residual dipolar couplings. Methods Enzymol. 2005;394:175–209. doi: 10.1016/S0076-6879(05)94007-X. [DOI] [PMC free article] [PubMed] [Google Scholar]
- 25.Tamm LK, Liang B. NMR of membrane proteins in solution. Prog Nucl Magn Reson Spectrosc. 2006;48:201–210. [Google Scholar]
- 26.Kang C, Tian C, Sönnichsen FD, Smith JA, Meiler J, George AL, Vanoye CG, Kim HJ, Sanders CR. Structure of KCNE1 and implications for how it modulates the KCNQ1 potassium channel. Biochemistry. 2008;47:7999–8006. doi: 10.1021/bi800875q. [DOI] [PMC free article] [PubMed] [Google Scholar]
- 27.Zhou Y, Cierpicki T, Jimenez RH, Lukasik SM, Ellena JF, Cafiso DS, Kadokura H, Beckwith J, Bushweller JH. NMR solution structure of the integral membrane enzyme DsbB: functional insights into DsbB-catalyzed disulfide bond formation. Mol Cell. 2008;31:896–908. doi: 10.1016/j.molcel.2008.08.028. [DOI] [PMC free article] [PubMed] [Google Scholar]
- 28.Almeida FC, Opella SJ. fd coat protein structure in membrane environments: structural dynamics of the loop between the hydrophobic trans-membrane helix and the amphipathic in-plane helix. J Mol Biol. 1997;270:481–495. doi: 10.1006/jmbi.1997.1114. [DOI] [PubMed] [Google Scholar]
- 29.Gargaro AR, Bloomberg GB, Dempsey CE, Murray M, Tanner MJ. The solution structures of the first and second transmembrane-spanning segments of band 3. Eur J Biochem. 1994;221:445–454. [PubMed] [Google Scholar]
- 30.MacKenzie KR, Prestegard JH, Engelman DM. A transmembrane helix dimer: structure and implications. Science. 1997;276:131–133. doi: 10.1126/science.276.5309.131. [DOI] [PubMed] [Google Scholar]
- 31.Opella SJ, Marassi FM, Gesell JJ, Valente AP, Kim Y, Oblatt-Montal M, Montal M. Structures of the M2 channel-lining segments from nicotinic acetylcholine and NMDA receptors by NMR spectroscopy. Nat Struct Biol. 1999;6:374–379. doi: 10.1038/7610. [DOI] [PMC free article] [PubMed] [Google Scholar]
- 32.Mascioni A, Karim C, Barany G, Thomas DD, Veglia G. Structure and orientation of sarcolipin in lipid environments. Biochemistry. 2002;41:475–482. doi: 10.1021/bi011243m. [DOI] [PubMed] [Google Scholar]
- 33.Zamoon J, Mascioni A, Thomas DD, Veglia G. NMR solution structure and topological orientation of monomeric phospholamban in dodecylphosphocholine micelles. Biophys J. 2003;85:2589–2598. doi: 10.1016/s0006-3495(03)74681-5. [DOI] [PMC free article] [PubMed] [Google Scholar]
- 34.Wang ZY, Gokan K, Kobayashi M, Nozawa T. Solution structures of the core light-harvesting alpha and beta polypeptides from Rhodospirillum rubrum: implications for the pigment-protein and protein-protein interactions. J Mol Biol. 2005;347:465–477. doi: 10.1016/j.jmb.2005.01.017. [DOI] [PubMed] [Google Scholar]
- 35.Wang ZY, Suzuki H, Kobayashi M, Nozawa T. Solution structure of the Rhodobcter sphaeroides PufX membrane proteimplications for the quinone exchange and protein-protein interactions. Biochemistry. 2007;46:3635–3642. doi: 10.1021/bi0618060. [DOI] [PubMed] [Google Scholar]
- 36.Girvin ME, Rastogi VK, Abildgaard F, Markley JL, Fillingame RH. Solution structure of the transmembrane H+-transporting subunit c of the F1F0 ATP synthase. Biochemistry. 1998;37:8817–8824. doi: 10.1021/bi980511m. [DOI] [PubMed] [Google Scholar]
- 37.Howell SC, Mesleh MF, Opella SJ. NMR structure determination of a membrane protein with two transmembrane helices in micelles: MerF of the bacterial mercury detoxification system. Biochemistry. 2005;44:5196–5206. doi: 10.1021/bi048095v. [DOI] [PubMed] [Google Scholar]
- 38.Ma D, Liu Z, Li L, Tang P, Xu Y. Structure and dynamics of the second and third transmembrane domains of human glycine receptor. Biochemistry. 2005;44:8790–8800. doi: 10.1021/bi050256n. [DOI] [PubMed] [Google Scholar]
- 39.Chang G, Spencer RH, Lee AT, Barclay MT, Rees DC. Structure of the MscL homolog from Mycobacterium tuberculosis: a gated mechanosensitive ion channel. Science. 1998;282:2220–2226. doi: 10.1126/science.282.5397.2220. [DOI] [PubMed] [Google Scholar]
- 40.Faller M, Niederweis M, Schulz GE. The structure of a mycobacterial outermembrane channel. Science. 2004;303:1189–1192. doi: 10.1126/science.1094114. [DOI] [PubMed] [Google Scholar]
- 41.Krogh A, Larsson B, von Heijne G, Sonnhammer EL. Predicting transmembrane protein topology with a hidden Markov model: application to complete genomes. J Mol Biol. 2001;305:567–580. doi: 10.1006/jmbi.2000.4315. [DOI] [PubMed] [Google Scholar]
- 42.Iwahara J, Schwieters CD, Clore GM. Ensemble approach for NMR structure refinement against (1)H paramagnetic relaxation enhancement data arising from a flexible paramagnetic group attached to a macromolecule. J Am Chem Soc. 2004;126:5879–5896. doi: 10.1021/ja031580d. [DOI] [PubMed] [Google Scholar]
- 43.Cornilescu G, Delaglio F, Bax A. Protein backbone angle restraints from searching a database for chemical shift and sequence homology. J Biomol NMR. 1999;13:289–302. doi: 10.1023/a:1008392405740. [DOI] [PubMed] [Google Scholar]
- 44.DeLano W. The PyMol molecular graphics system. Palo Alto, CA, USA: DeLano Scientific; 2002. [Google Scholar]
- 45.Wang J, Kim S, Kovacs F, Cross TA. Structure of the transmembrane region of the M2 protein H(+) channel. Protein Sci. 2001;10:2241–2250. doi: 10.1110/ps.17901. [DOI] [PMC free article] [PubMed] [Google Scholar]
- 46.Page RC, Kim S, Cross TA. Transmembrane helix uniformity examined by spectral mapping of torsion angles. Structure. 2008;16:787–797. doi: 10.1016/j.str.2008.02.018. [DOI] [PMC free article] [PubMed] [Google Scholar]
- 47.Monne M, Hermansson M, von Heijne G. A turn propensity scale for transmembrane helices. J Mol Biol. 1999;288:141–145. doi: 10.1006/jmbi.1999.2657. [DOI] [PubMed] [Google Scholar]
- 48.Cordes FS, Bright JN, Sansom MS. Proline-induced distortions of transmembrane helices. J Mol Biol. 2002;323:951–960. doi: 10.1016/s0022-2836(02)01006-9. [DOI] [PubMed] [Google Scholar]
- 49.Yohannan S, Faham S, Yang D, Whitelegge JP, Bowie JU. The evolution of transmembrane helix kinks and the structural diversity of G protein-coupled receptors. Proc Natl Acad Sci USA. 2004;101:959–963. doi: 10.1073/pnas.0306077101. [DOI] [PMC free article] [PubMed] [Google Scholar]
- 50.Hu J, Asbury T, Achuthan S, Li C, Bertram R, Quine JR, Fu R, Cross TA. Backbone structure of the amantadine-blocked trans-membrane domain M2 proton channel from influenza A virus. Biophys J. 2007;92:4335–4343. doi: 10.1529/biophysj.106.090183. [DOI] [PMC free article] [PubMed] [Google Scholar]
- 51.Page RC, Li C, Hu J, Gao FP, Cross TA. Lipid bilayers: an essential environment for the understanding of membrane proteins. Magn Reson Chem. 2007;45:S2–S11. doi: 10.1002/mrc.2077. [DOI] [PubMed] [Google Scholar]
- 52.Wimley WC, White SH. Experimentally determined hydrophobicity scale for proteins at membrane interfaces. Nat Struct Biol. 1996;3:842–848. doi: 10.1038/nsb1096-842. [DOI] [PubMed] [Google Scholar]
- 53.White SH, Wimley WC. Hydrophobic interactions of peptides with membrane interfaces. Biochim Biophys Acta. 1998;1376:339–352. doi: 10.1016/s0304-4157(98)00021-5. [DOI] [PubMed] [Google Scholar]
- 54.de Planque MR, Kruijtzer JA, Liskamp RM, Marsh D, Greathouse DV, Koeppe RE, II, de Kruijff B, Killian JA. Different membrane anchoring positions of tryptophan and lysine in synthetic transmembrane alpha-helical peptides. J Biol Chem. 1999;274:20839–20846. doi: 10.1074/jbc.274.30.20839. [DOI] [PubMed] [Google Scholar]
- 55.Strandberg E, Morein S, Rijkers DT, Liskamp RM, van der Wel PC, Killian JA. Lipid dependence of membrane anchoring properties and snorkeling behavior of aromatic and charged residues in transmembrane peptides. Biochemistry. 2002;41:7190–7198. doi: 10.1021/bi012047i. [DOI] [PubMed] [Google Scholar]
- 56.Strandberg E, Killian JA. Snorkeling of lysine side chains in transmembrane helices: how easy can it get? FEBS Lett. 2003;544:69–73. doi: 10.1016/s0014-5793(03)00475-7. [DOI] [PubMed] [Google Scholar]
- 57.Chamberlain AK, Lee Y, Kim S, Bowie JU. Snorkeling preferences foster an amino acid composition bias in transmembrane helices. J Mol Biol. 2004;339:471–479. doi: 10.1016/j.jmb.2004.03.072. [DOI] [PubMed] [Google Scholar]
- 58.Clore GM, Garret DS. R-factor, free R, and complete cross-validation for dipolar coupling refinement of NMR structures. J Am Chem Soc. 1999;121:9008–9012. [Google Scholar]
- 59.Gillespie JR, Shortle D. Characterization of long-range structure in the denatured state of staphylococcal nuclease. I. Paramagnetic relaxation enhancement by nitroxide spin labels. J Mol Biol. 1997;268:158–169. doi: 10.1006/jmbi.1997.0954. [DOI] [PubMed] [Google Scholar]
- 60.Tang C, Schwieters CD, Clore GM. Open-to-closed transition in apo maltose-binding protein observed by paramagnetic NMR. Nature. 2007;449:1078–1082. doi: 10.1038/nature06232. [DOI] [PubMed] [Google Scholar]
- 61.Baker EN, Hubbard RE. Hydrogen bonding in globular proteins. Prog Biophys Mol Biol. 1984;44:97–179. doi: 10.1016/0079-6107(84)90007-5. [DOI] [PubMed] [Google Scholar]
- 62.Barlow DJ, Thornton JM. Helix geometry in proteins. J Mol Biol. 1988;201:601–619. doi: 10.1016/0022-2836(88)90641-9. [DOI] [PubMed] [Google Scholar]
- 63.White SH, Wimley WC. Membrane protein folding and stability: physical principles. Annu Rev Biophys Biomol Struct. 1999;28:319–365. doi: 10.1146/annurev.biophys.28.1.319. [DOI] [PubMed] [Google Scholar]
- 64.Popot JL, Engelman DM. Helical membrane protein folding, stability, and evolution. Annu Rev Biochem. 2000;69:881–922. doi: 10.1146/annurev.biochem.69.1.881. [DOI] [PubMed] [Google Scholar]
- 65.Popot JL, Engelman DM. Membrane protein folding and oligomerization: the two-stage model. Biochemistry. 1990;29:4031–4037. doi: 10.1021/bi00469a001. [DOI] [PubMed] [Google Scholar]
- 66.Kim S, Cross TA. Uniformity, ideality, and hydrogen bonds in transmembrane α-helices. Biophys J. 2002;83:2084–2095. doi: 10.1016/S0006-3495(02)73969-6. [DOI] [PMC free article] [PubMed] [Google Scholar]
- 67.Nymeyer H, Zhou HX. A method to determine dielectric constants in nonhomogeneous systems: application to biological membranes. Biophys J. 2008;94:1185–1193. doi: 10.1529/biophysj.107.117770. [DOI] [PMC free article] [PubMed] [Google Scholar]
- 68.Xu F, Wang A, Vaughn JB, Cross TA. A catalytic role for protic solvents in conformational interconversion. J Am Chem Soc. 1996;118:9176–9177. [Google Scholar]
- 69.Xu F, Cross TA. Water: foldase activity in catalyzing polypeptide conformational rearrangements. Proc Natl Acad Sci USA. 1999;96:9057–9061. doi: 10.1073/pnas.96.16.9057. [DOI] [PMC free article] [PubMed] [Google Scholar]
- 70.Chou JJ, Kaufman JD, Stahl SJ, Wingfield PT, Bax A. Micelle-induced curvature in a water-insoluble HIV-1 envelope peptide revealed by NMR dipolar coupling measurement in stretched polyacrylamide gel. J Am Chem Soc. 2002;124:2450–2451. doi: 10.1021/ja017875d. [DOI] [PubMed] [Google Scholar]
- 71.Ulmer TS, Bax A, Cole NB, Nussbaum RL. Structure and dynamics of micelle-bound human alpha-synuclein. J Biol Chem. 2005;280:9595–9603. doi: 10.1074/jbc.M411805200. [DOI] [PubMed] [Google Scholar]
- 72.Tinoco LW, Gomes-Neto F, Valente AP, Almeida FC. Effect of micelle interface on the binding of anticoccidial PW2 peptide. J Biomol NMR. 2007;39:315–322. doi: 10.1007/s10858-007-9202-6. [DOI] [PubMed] [Google Scholar]
- 73.Stols L, Gu M, Dieckman L, Raffen R, Collart FR, Donnelly MI. A new vector for high-throughput, ligation-independent cloning encoding a tobacco etch virus protease cleavage site. Protein Expr Purif. 2002;25:8–15. doi: 10.1006/prep.2001.1603. [DOI] [PubMed] [Google Scholar]
- 74.Marley J, Lu M, Bracken C. A method for efficient isotopic labeling of recombinant proteins. J Biomol NMR. 2001;20:71–75. doi: 10.1023/a:1011254402785. [DOI] [PubMed] [Google Scholar]
- 75.Jones DH, Opella SJ. Weak alignment of membrane proteins in stressed polyacrylamide gels. J Magn Reson. 2004;171:258–269. doi: 10.1016/j.jmr.2004.08.022. [DOI] [PubMed] [Google Scholar]
- 76.Cierpicki T, Bushweller JH. Charged gels as an orienting media for measurement of residual dipolar couplings in soluble and integral membrane proteins. J Am Chem Soc. 2004;126:16259–16266. doi: 10.1021/ja046054g. [DOI] [PubMed] [Google Scholar]
- 77.Hubbell WL, Altenbach C. Investigation of structure and dynamics in membrane proteins using site-directed spin labeling. Curr Opin Struct Biol. 1994;4:566–573. [Google Scholar]
- 78.Hubbell WL, Mchaourab HS, Altenbach C, Lietzow MA. Watching proteins move using site-directed spin labeling. Structure. 1996;4:779–783. doi: 10.1016/s0969-2126(96)00085-8. [DOI] [PubMed] [Google Scholar]
- 79.Berliner LJ, Grunwald J, Hankovszky HO, Hideg K. A novel reversible thiol-specific spin label: papain active site labeling and inhibition. Anal Biochem. 1982;119:450–455. doi: 10.1016/0003-2697(82)90612-1. [DOI] [PubMed] [Google Scholar]
- 80.Trad CH, James W, Bhardwaj A, Butterfield DA. Selective labeling of membrane protein sulfhydryl grous with methanethiosulfonate spin label. J Biochem Biophys Methods. 1995;30:287–299. doi: 10.1016/0165-022x(95)00016-9. [DOI] [PubMed] [Google Scholar]
- 81.Ding K, Gronenborn AM. Sensitivity-enhanced 2D IPAP, TROSY-anti-TROSY, and E.COSY experiments: alternatives for measuring dipolar 15N-1HN couplings. J Magn Reson. 2003;163:208–214. doi: 10.1016/s1090-7807(03)00081-8. [DOI] [PubMed] [Google Scholar]
- 82.Mori S, Abeygunawardana C, Johnson MO, Vanzijl PCM. Improved sensitivity of HSQC spectra of exchanging protons at short interscan delays using a new fast HSQC (FHSQC) detection scheme that avoids water saturation. J Magn Reson B. 1995;108:94–98. doi: 10.1006/jmrb.1995.1109. [DOI] [PubMed] [Google Scholar]
- 83.Delaglio F, Grzesiek S, Vuister GW, Zhu G, Pfeifer J, Bax A. NMRPipe: a multidimensional spectral processing system based on UNIX pipes. J Biomol NMR. 1995;6:277–293. doi: 10.1007/BF00197809. [DOI] [PubMed] [Google Scholar]
- 84.Goddard TD, Kneller DG. SPARKY 3. San Francisco: University of California; 2006. [Google Scholar]
- 85.Clore GM, Gronenborn AM, Bax A. A robust method for determining the magnitude of the fully asymmetric alignment tensor of oriented macromolecules in the absence of structural information. J Magn Reson. 1998;133:216–221. doi: 10.1006/jmre.1998.1419. [DOI] [PubMed] [Google Scholar]
- 86.Clore GM, Gronenborn AM, Tjandra N. Direct structure refinement against residual dipolar couplings in the presence of rhombicity of unkown magnitude. J Magn Reson. 1998;131:159–162. doi: 10.1006/jmre.1997.1345. [DOI] [PubMed] [Google Scholar]
- 87.Jain NU, Venot A, Umemoto K, Leffler H, Prestegard JH. Distance mapping of protein-binding sites using spin-labeled oligosaccharide ligands. Protein Sci. 2001;10:2393–2400. doi: 10.1110/ps.17401. [DOI] [PMC free article] [PubMed] [Google Scholar]
- 88.Laskowski RA, Rullmannn JA, MacArthur MW, Kaptein R, Thornton JM. AQUA and PROCHECK-NMR: programs for checking the quality of protein structures solved by NMR. J Biomol NMR. 1996;8:477–486. doi: 10.1007/BF00228148. [DOI] [PubMed] [Google Scholar]