

Abstract
Investigation of protein unfolding kinetics of proteins in crude samples may provide many exciting opportunities to study protein energetics under unconventional conditions. As an effort to develop a method with this capability, we employed “pulse proteolysis” to investigate protein unfolding kinetics. Pulse proteolysis has been shown to be an effective and facile method to determine global stability of proteins by exploiting the difference in proteolytic susceptibilities between folded and unfolded proteins. Electrophoretic separation after proteolysis allows monitoring protein unfolding without protein purification. We employed pulse proteolysis to determine unfolding kinetics of E. coli maltose binding protein (MBP) and E. coli ribonuclease H (RNase H). The unfolding kinetic constants determined by pulse proteolysis are in good agreement with those determined by circular dichroism. We then determined an unfolding kinetic constant of overexpressed MBP in a cell lysate. An accurate unfolding kinetic constant was successfully determined with the unpurified MBP. Also, we investigated the effect of ligand binding on unfolding kinetics of MBP using pulse proteolysis. On the basis of a kinetic model for unfolding of MBP•maltose complex, we have determined the dissociation equilibrium constant (Kd) of the complex from unfolding kinetic constants, which is also in good agreement with known Kd values of the complex. These results clearly demonstrate the feasibility and the accuracy of pulse proteolysis as a quantitative probe to investigate protein unfolding kinetics.
Keywords: pulse proteolysis, unfolding kinetics, maltose binding protein, ribonuclease H, ligand binding, dissociation equilibrium constant, folding, stability
Introduction
Kinetics of protein folding and unfolding as well as global stability are essential information on the energetics of protein structure. The kinetic stability of a protein, which is commonly defined by its unfolding kinetics, has a critical role in providing the protein with longevity and robustness.1,2 Spectroscopic monitoring of conformational changes upon unfolding is the most preferred way to study unfolding kinetics of proteins. Typically, protein unfolding is initiated by chemical denaturants, and the change in conformations is observed by circular dichroism (CD) or fluorescence. These methods for unfolding studies require proteins to be pure. When a mixture of protein is present in a cuvette, spectroscopic probes report the sum of the signals from individual proteins. Although overexpression and purification have become routine laboratory procedures, a multitude of proteins in all different organisms are still challenging to overexpress or to purify. Membrane proteins are good examples of such. Therefore, it is desirable to have a structural probe that can be used to monitor the unfolding of a protein in a mixture of proteins or to monitor unfolding of multiple proteins simultaneously.
Proteolysis is an interesting alternative to overcome the limitation of the conventional spectroscopic methods. Like spectroscopic probes for protein conformation, proteolysis is quite effective in distinguishing unfolded conformations from folded conformations. A folded protein without any unstructured region is not a good substrate for proteases, because its amide bonds are protected by folded structure. However, when a protein is unfolded (locally or globally), proteases can digest exposed amide bonds efficiently.3–6 Therefore, proteolytic susceptibility of a protein is quite sensitive to change in its conformation. Pulse proteolysis is a method to determine fractions of folded protein under a given condition by exploiting this difference in proteolytic susceptibilities between folded and unfolded proteins.7,8 Typically, an excess amount of a protease (0.20 mg/mL) is added to a protein solution and incubated for 1 min. After quenching the proteolysis reaction, the amount of remaining protein is determined using SDS PAGE. When digestion of folded proteins by the pulse of proteolysis is negligible, the amount of remaining protein reflects the amount of folded protein in equilibrium. Pulse proteolysis has been shown to be a surprisingly simple way to determine thermodynamic stability of protein. By determining fractions of folded protein in equilibrium at varying concentrations of urea, the midpoints of protein unfolding transition (Cm) in urea were determined. The results were quite consistent with those determined by CD. Moreover, because of the use of SDS PAGE for quantification, unfolding of a protein of interest can be studied in the presence of other proteins. Cm values of overexpressed proteins could be determined in cell lysates without purifying the protein.
Here we report that pulse proteolysis is also an effective tool to study protein unfolding kinetics. As model cases, we have determined unfolding kinetic constants of E. coli maltose binding protein (MBP) and a cysteine-free variant of E. coli ribonuclease H (RNase H)9 in urea. The accuracy of the experimental data determined by pulse proteolysis is shown by comparing with the values determined by CD. To demonstrate the feasibility of pulse proteolysis as a tool to study unfolding kinetics of unpurified proteins, unfolding of MBP in a crude lysate was investigated by pulse proteolysis without purifying the protein. Also, the effect of maltose on unfolding kinetics of MBP was investigated by pulse proteolysis. The dissociation equilibrium constant of MBP-maltose complex was determined using the unfolding kinetics data from pulse proteolysis.
Results
Design of the experimental procedure
The flow chart in Figure 1 shows the procedure for determination of unfolding kinetic constants by using pulse proteolysis. Unfolding of a protein is initiated by adding urea to the protein to a desired concentration. The reaction is then dispensed into several aliquots. At designated time points, a protease is added to each aliquot to digest unfolded proteins in the reaction. After 1 min of incubation, the reaction is quenched and analyzed by SDS PAGE
Figure 1.
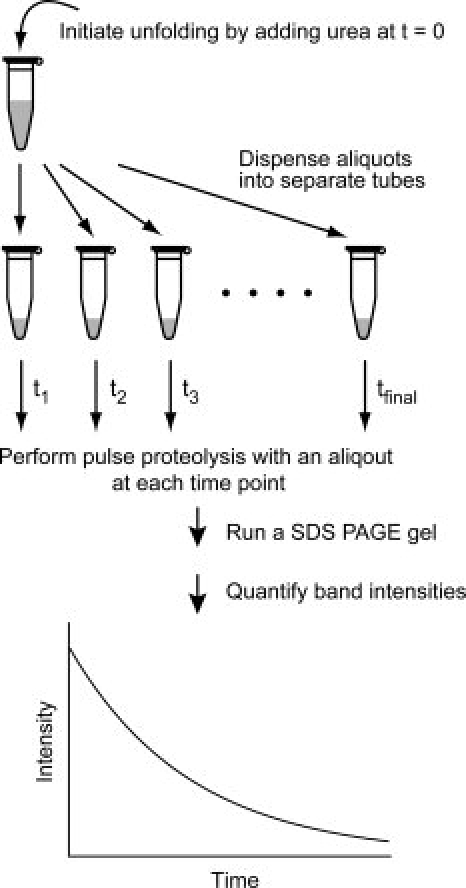
Unfolding kinetics by pulse proteolysis. After protein unfolding is initiated by adding urea, aliquots are dispended into tubes. At each time point, pulse proteolysis is performed by adding thermolysin into an aliquot and incubating for a minute. After proteolysis is quenched by EDTA, remaining intact proteins are quantified by SDS PAGE. Unfolding kinetic constants are determined by curve-fitting of the change of band intensities to an appropriate rate equation.
The amount of intact proteins after pulse proteolysis is determined by quantifying the band intensities on an SDS PAGE gel. The band intensity is then plotted against the incubation time, and an unfolding kinetic constant is determined by fitting the plot to an appropriate rate equation. The incubation time for unfolding is defined by the time point when proteolysis is quenched, not by the time point when proteolysis is initiated, because proteins unfold further during the 1-min proteolysis.
Determination of unfolding kinetic constants of MBP and RNase H by pulse proteolysis
To test the feasibility and reliability of pulse proteolysis as a tool to determine unfolding kinetics, we monitored unfolding of MBP as a model case. A representative result is shown in Figure 2(A). Unfolding of MBP was initiated by adding urea to the protein to the final concentration of 5.50M. At designated time points, thermolysin, a bacterial protease, was added to the final concentration of 0.20 mg/mL. After 1 min of incubation, the reaction was quenched by EDTA, and the amounts of the remaining intact MBP were monitored by SDS PAGE. The band intensities of intact MBP showed a gradual disappearance over time [Figure 2(A)]. At 16 min, only a faint band of MBP was detectable. The unfolding kinetic constant (ku) was determined to be 0.25 ± 0.01 min−1 with good statistical quality (r2 = 0.9989) by fitting the plot of band intensities versus time to a first-order rate equation [Figure 2(B)]. To confirm this result, we also determined an unfolding kinetic constant of MBP by CD under a similar condition (0.236 ± 0.001 min−1 at 5.47M urea), which is consistent with the ku value determined by pulse proteolysis.
Figure 2.
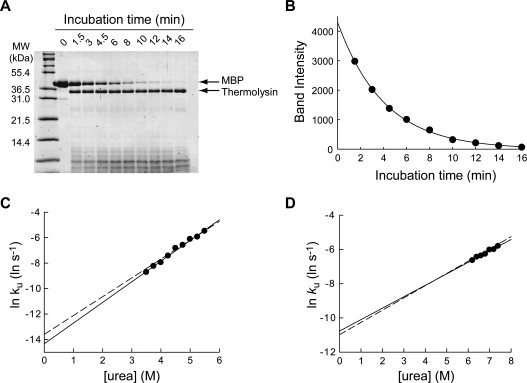
Determination of unfolding kinetic constants by pulse proteolysis. (A) Unfolding of MBP in 5.5M urea was monitored by pulse proteolysis. The bands corresponding to MBP and thermolysin are indicated by arrows. The amount of intact MBP decreases overtime as unfolded MBP is digested by pulse proteolysis. (B) The quantified band intensities from the gel in (A) are plotted against time. An unfolding kinetic constant (ku) of 0.25 ± 0.01 min−1 was determined by curve-fitting of the plot to a first-order rate equation (r2 = 0.9989). (C) Unfolding kinetic constants (ku) of MBP were determined with varying concentrations of urea. The plot of lnku versus [urea] shows the empirically known linear correlation. By fitting the plot to Eq. (7), the mu value and kunf(H2O) were determined to be 0.96 ± 0.04 kcal/(mol M) and (6.0 ± 1.6) × 10−7 s−1, respectively. For comparison, the linear regression line of unfolding kinetic constants of MBP determined by circular dichroism is shown (dashed line). (D) Unfolding kinetic constants (ku) of RNase H were determined with varying concentration of urea. By fitting the plot to Eq. (7), the mu and kunf(H2O) values were determined to be 0.40 ± 0.05 kcal/(mol M) and (2.1 ± 0.1) × 10−5 s−1, respectively. For comparison, the linear regression line of unfolding kinetic constants of RNase H determined by circular dichroism is shown (dashed line).
We further determined unfolding kinetic constants of MBP by pulse proteolysis in different concentrations of urea. The logarithms of the ku values were plotted against urea concentration [Figure 2(C)]. As empirically known, the logarithms of unfolding kinetic constants showed a linear correlation with urea concentration.10 We also determined the unfolding kinetic constants of MBP by CD in different concentrations of urea [Figure 2(C)]. The unfolding kinetic constants determined by pulse proteolysis are consistent with the values determined by CD. By fitting the plot to Eq. (7), the mu value and kunf(H2O) were determined to be 0.96 ± 0.04 kcal/(mol M) and (6.0 ± 1.6) × 10−7 s−1, respectively. These parameters are also in good agreement with those determined by CD (Table I)
Table I.
Unfolding Kinetic Parameters of MBP, MBP•Maltose Complex, and RNase H Determined by Pulse Proteolysis and Circular Dichroism in Urea
| Protein | Method | ku(H2O) (s−1) | mu (kcal/(mol M)) |
|---|---|---|---|
| MBP | Pulse proteolysis | (6.0 ± 1.6) × 10−7 | 0.96 ± 0.04 |
| CD | (12.4 ± 1.1) × 10−7 | 0.87 ± 0.01 | |
| MBP + 100 μM maltose | Pulse proteolysis | (9.4 ± 3.2) × 10−9 | 1.01 ± 0.03 |
| RNase H | Pulse proteolysis | (2.1 ± 0.1) × 10−5 | 0.40 ± 0.03 |
| CDa | (1.69 ± 0.04) × 10−5 | 0.42 ± 0.03 |
From Ref.11.
We also investigated unfolding kinetics of RNase H by pulse proteolysis in different concentrations of urea. The logarithms of ku values from curve fitting again showed a linear correlation with urea concentration as expected [Fig. 2(D)]. From the plot of lnku versus [urea], the mu and kunf(H2O) values were determined to be 0.40 ± 0.03 kcal/(mol M) and (2.1 ± 0.1) × 10−5 s−1, respectively, which are in good agreement with those in literature determined by CD11 (Table I).
The activity of thermolysin is known to decrease as the urea concentration is increased.6,7 At higher concentration of urea, 0.20 mg/mL thermolysin may not have enough activity to digest unfolded proteins completely in a minute. Under the experimental conditions used here ([urea] < 7.2M), however, thermolysin retains enough activity for pulse proteolysis. The complete digestion of unfolded proteins was confirmed by the complete digestion of MBP and RNase H at later time points of unfolding experiments when proteins were mostly unfolded [Fig. 2(A,B)]1.
Determination of unfolding kinetic constants of MBP in a cell lysate
Pulse proteolysis allows us to study protein unfolding without purifying proteins. Because the amount of remaining proteins after pulse proteolysis is determined by SDS PAGE, overexpressed proteins can be studied without further purification. It has been demonstrated that Cm in urea can be determined reliably with overexpressed RNase H in a cell lysate.7 We tested to see if unfolding kinetics of MBP can be studied in a cell lysate without purification.
A lysate of E. coli cells overexpressing MBP was prepared and mixed with a buffer to final urea concentration of 5.50M. Then, pulse proteolysis was performed with the reaction at designated time points [ fig 3(A)]. The unfolding kinetic constant of MBP in the crude lysate was determined to be 0.23 ± 0.01 min−1, which is in good agreement with the unfolding kinetic constant determined with purified MBP (0.25 ± 0.01 min−1) [Fig. 3(B)]
Figure 3.
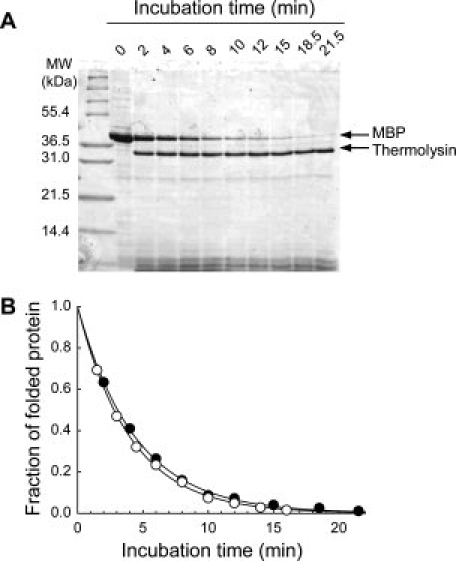
Determination of unfolding kinetic constants in a cell lysate by pulse proteolysis. (A) Unfolding of MBP in a cell lysate was monitored in 5.50M urea by pulse proteolysis. The lysate of E. coli overexpressing MBP was diluted with an unfolding buffer and digested by pulse proteolysis at the designated time points. (B) Comparison of unfolding of purified MBP (○) and MBP in a cell lysate (•). Unfolding kinetic constant of MBP in a cell lysate was determined to be 0.23 ± 0.01 min−1, which is quite consistent with the unfolding kinetics determined with purified MBP (0.25 ± 0.01 min−1).
Determination of unfolding kinetic constants of MBP•maltose complex by pulse proteolysis
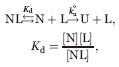
Association with ligands commonly slows down global unfolding of proteins.12–14 Unfolding of protein-ligand complex is modeled as:
 |
1 |
where Kd is the dissociation equilibrium constant of the complex (NL), and ku° is the unfolding kinetic constant of the apo-form of the protein (N). Here, we assume a pre-equilibrium case where ligand association is faster than unfolding. When [L] ≫ Kd, the apparent unfolding kinetic constant (ku) is expressed:
| 2 |
On the basis of this relationship, we investigated the effect of maltose binding on the unfolding kinetics of MBP with pulse proteolysis.
First, unfolding of MBP was monitored by pulse proteolysis at varying concentration of urea (6.0–7.2M) with 100 μM maltose. The concentration of MBP in the reaction was 12 μM. Because the concentration of maltose is much greater than Kd of the MBP•maltose complex (1.2 ± 0.2 μM),15 most of MBP is expected to exist in the complex form under this condition. MBP unfolded significantly slower with 100 μM maltose than in the absence of maltose. The amounts of remaining MBP on a SDS PAGE gel showed an apparent exponential decrease overtime (data not shown). However, the use of a first-order rate equation with a single kinetic constant may not be proper under this condition, because the concentration of free ligands changes upon unfolding of the complex. To consider this effect, we have derived a novel equation for unfolding of the MBP•maltose complex:
| 3 |
where Lt and Pt are the total ligand concentration and the total protein concentration, respectively, and ku is the unfolding kinetic constant of the complex at [L] = Lt (for derivation, see Supp. Info.). The curve-fitting of the unfolding data to Eq. (3) showed good statistical correlations (r2 > 0.99). From the plot of lnku versus [urea], the kinetic m-value and kunf(H2O) of MBP•maltose complex were determined to be 1.01 ± 0.03 kcal/(mol M) and (9.4 ± 3.2) × 10−9 s−1, respectively [Fig. 4(A) and Table I]. Maltose (100 μM) decreases kunf(H2O) 64-fold, compared with kunf(H2O) of free MBP. Interestingly, the mu value of MBP maltose•complex is quite similar to that of free MBP (0.96 ± 0.04 kcal/(mol M)).
Figure 4.
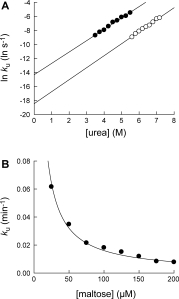
Determination of unfolding kinetic constants of MBP•maltose complex. (A) The effect of urea on unfolding kinetic constants of MBP•maltose complex (○). The kinetic m-value and kunf(H2O) of MBP•maltose complex were determined to be 1.01 ± 0.03 kcal/(mol M) and 9.4 × 10⁻⁹ s−1, respectively. Unfolding kinetic constants of MBP in the absence of maltose (•) is shown for comparison. (B) The effect of maltose concentration on unfolding kinetic constants of MBP•maltose complex in 6.0M urea. The maltose concentration is the total maltose concentration in the reaction. By fitting the curve to Eq. (2), the dissociation equilibrium constant (Kd) of the complex was determined to be 2.7 ± 0.3 μM.
We also determined ku of MBP in 6.0M urea with varying concentrations of maltose (25–200 μM) [Fig.4]. The determined ku values were inversely proportional to the total maltose concentration as predicted in Eq. (2). By fitting the plot to Eq. (2), Kd of the MBP•maltose complex was determined to be 2.7 ± 0.3 μM, which is slightly greater than the Kd values determined by fluorescence in the absence of urea (1.2 ± 0.2 μM).15 We previously demonstrated that pulse proteolysis can be used to determine Kd of a complex by measuring the change in global stability of the protein upon binding.7 We show here that Kd can also be determined with pulse proteolysis by monitoring the effect of ligand binding on unfolding kinetics.
Discussion
Pulse proteolysis as a probe for protein unfolding
Conventionally kinetics of protein folding and unfolding is studied by spectroscopic methods, such as CD or fluorescence. Pulse proteolysis is a facile alternative to these spectroscopic methods. Most of all, pulse proteolysis can be used to monitor protein unfolding in situ without purification. Overexpressed proteins in cell lysates usually make discernable bands on SDS PAGE gels. Therefore, by following the change in band intensities after pulse proteolysis, the fraction of folded proteins under given condition can be determined reliably in cell lysates. Previously, we have reported that Cm values can be determined by pulse proteolysis without purification.7 The result reported here clearly shows that the same approach with unpurified proteins is valid in determining unfolding kinetic constants. It is noteworthy that the use of pulse proteolysis with unpurified proteins is contingent upon sufficient expression levels of the protein of interest. If the protein does not make an intense band, quantification may be subject to the interference from background proteins. If antibodies are available, however, unfolding of even minor proteins in cell lysates can be monitored using Western blotting after pulse proteolysis (Kim and Park, unpublished result). Investigation of protein unfolding in cell lysates offers a unique opportunity to study the effects of other cellular proteins on the conformational energetics of a protein of interest, which may mimic in vivo conditions to some degree. Also, pulse proteolysis would be useful for investigating proteins whose expression and purification are challenging. Currently, we are attempting to employ pulse proteolysis in investigating unfolding of membrane proteins.
Pulse proteolysis is an excellent tool to study slow unfolding. When unfolding of a protein takes hours to several days, conventional spectroscopic methods are inconvenient to follow this slow unfolding. On the contrary, monitoring of slow unfolding by pulse proteolysis is quite feasible, because pulse proteolysis is performed in a discontinuous manner. Also, multiple samples can be analyzed simultaneously. However, pulse proteolysis is not practical when unfolding takes less than 1 min, because duration of pulse is 1 min. It is not feasible to reduce sampling intervals less than a minute due to the time scale of pulse proteolysis.
Pulse proteolysis monitors the change in proteolytic susceptibility of proteins upon unfolding. If a kinetic intermediate susceptible to proteolysis accumulates during unfolding, pulse proteolysis reports the kinetics of the transition from the resistant native form to the susceptible kinetic intermediates. This specificity of pulse proteolysis for the change in susceptibility may be useful in deciphering the nature of kinetic phases of proteins with a complex unfolding mechanism.
Proteolysis kinetics versus pulse proteolysis
It has been reported that protein unfolding kinetics can be determined by simply measuring the rate of proteolysis under certain conditions.5 This coupling between global unfolding and proteolysis can be explained by a simple kinetic scheme of proteolysis with two steps: an equilibrium step between a folded (and resistant) state and a cleavable state, and an irreversible proteolysis step from the cleavable states5,16:
| 4 |
where kop and kcl are forward (opening) and reverse (closing) kinetic constants for conformational change, and kint is the intrinsic kinetic constant for proteolysis of unstructured peptides. When kint ≫ kcl, the apparent proteolysis rate constant (kp) is simply determined by kop:
| 5 |
which corresponds to the EX1 regime of hydrogen/deuterium exchange (HX) reactions.17 Under this condition, the overall proteolysis rate is determined by kinetic accessibility (kop) of the cleavable conformation, which is independent of the protease concentration. If the cleavable state is actually a globally unfolded state, kinetics of proteolysis is identical to the kinetics of global unfolding.
Different from pulse proteolysis, however, this proteolysis kinetics method requires many conditions to be satisfied to guarantee the accuracy of the measurement. First, proteolysis should occur only through global unfolding. If proteolysis through subglobal or partial unfolding contributes significantly, unfolding rates will be overestimated. Figure 5 shows this effect of proteolysis through nonglobal unfolding. We assume a protein is digested through global unfolding with a kinetic constant of 0.01 min−1 and through partial unfolding with a kinetic constant of 0.05 min−1. Therefore, the overall proteolysis is dominated by partial unfolding (dotted line) and proteolysis kinetics does not report unfolding kinetics. On the contrary, the unfolding kinetic constant determined by pulse proteolysis is not affected by proteolysis through partial unfolding. The fractions of folded proteins determined by pulse proteolysis (dashed line) shows a slight decrease from the actual values (solid line) due to the digestion of folded proteins during 1 min of pulse. However, the same kinetic constant is obtained by curve-fitting because pulse proteolysis digests folded proteins at each time point by the same ratio. Therefore, even in case that folded proteins are digested through partial unfolding, pulse proteolysis reports accurate global unfolding kinetics.
Figure 5.
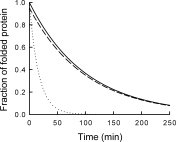
Unfolding kinetics by pulse proteolysis versus proteolysis kinetics. Errors in determining unfolding kinetics using proteolysis as a probe are demonstrated by simulation for the case that proteolysis also occurs through partial unfolding. In this simulation, protein unfolds with a kinetic constant of 0.01 min−1 but is also digested through partial unfolding with a kinetic constant of 0.05 min−1. The true unfolding kinetics is shown for comparison (solid line). When unfolding is monitored by proteolysis kinetics (dotted line), a significant error is introduced. On the contrary, pulse proteolysis does not introduce any error in the kinetic constant, even though the apparent amplitude is slightly smaller due to proteolysis of folded proteins during 1 min of pulse (dashed line).
Second, when proteases are inactivated by self digestion or inhibited slowly by some compounds in the reaction, protoeolysis kinetics may not report reliable unfolding kinetics. The protease activity in the reaction may decrease significantly during extended incubation so that the experimental condition would not guarantee EX1-type kinetics. However, because pulse proteolysis is performed only for a minute, slow inactivation of proteases does not affect the unfolding kinetics measurement. Therefore, pulse proteolysis is more versatile method for applications under various conditions.
Effect of ligand on unfolding kinetics
When a ligand binds to a protein, the complex formation may slow the unfolding of the protein.12–14 For a ligand to slow the unfolding of a protein, ligand binding must stabilize the ground state greater than the transition state so that the barrier to the transition state is actually increased. Considering that ligand binding to its binding site requires a well-ordered native structure of a protein which is likely to be perturbed in the transition state, slow unfolding upon ligand binding seems to be quite general. However, increases in folding rates by ligand binding are quite rare. The only well-documented cases are metal binding proteins, probably because metal binding is fast and does not require extensively preorganized binding sites.18 Therefore, we proposed a simple model to explain the effect of ligand binding on unfolding kinetics of MBP [Eq. (1)], where maltose dissociates from the complex before the rate-limiting transition state for unfolding. Also, to take into account the change in the free ligand concentration upon unfolding of the complex, we have derived a novel rate equation [Eq. (3)] based on the proposed kinetic model.
This kinetic model and the derived equation work well with the unfolding kinetics data of MBP determined by pulse proteolysis. The apparent unfolding kinetic constants show a clear inverse correlation with the concentration of maltose in the reaction as predicted by the model [Eq. (2)] [Fig.4(B)]. This inverse correlation between unfolding kinetics and ligand concentrations has been also demonstrated with muscle acylphosphatase14 and variant forms of barnase.12 Using Eq. (2), Kd of MBP•maltose complex in 6.0M urea was determined to be 2.7 ± 0.3 μM, which is slightly greater than reported Kd values of 1.2 ± 0.2 μM.15 The slight difference from the reported Kd values may result from the effect of urea on Kd, because the Kd value is determined with unfolding kinetic constants measured in 6.0M urea. Effects of urea on interactions between protein and small molecules are not well understood. It has been reported that the Kd value for the complex of ribonuclease A and cytosine 2′-monophosphate (2′-CMP) decreases by ∼3-fold when urea concentration is increased from 0 to 3.0M.19 The sensitivity of Kd on urea seems to be dependent on the solvation properties of ligands and proteins. In case of MBP•maltose complex, the effect of urea on Kd seems to be minimal. This minimal effect of urea on Kd of MBP•maltose complex is also apparent in the quite similar kinetic m-values for free MBP [0.96 ± 0.04 kcal/(mol M)] and MBP•maltose complex [1.01 ± 0.03 kcal/(mol M)].
Conclusions
We have demonstrated that pulse proteolysis is a versatile tool to study protein unfolding kinetics as well as equilibrium unfolding. Without using biophysical instruments, pulse proteolysis generates high quality unfolding data comparable to conventional methods. Investigation of the effect of ligand binding on MBP unfolding clearly demonstrates that pulse proteolysis is suitable for quantitative analyses of protein unfolding. Because the assay is discontinuous, pulse proteolysis is a facile tool to study proteins with slow unfolding kinetics. Moreover, pulse proteolysis allows monitoring unfolding of proteins in crude lysates. When Western blotting is combined with pulse proteolysis, required amounts of proteins for unfolding kinetics studies would be significantly reduced, which would eliminate the need of overexpression and purification for energetic studies of proteins. When conventional studies are not readily applicable due to the difficulty of overexpression and purification as the cases of membrane proteins, pulse proteolysis would serve as an excellent alternative.
Materials and Methods
Materials
E.coli MBP and RNase H were prepared as described previously.7,11 Thermolysin (EC 3.4.24.27) from B. thermoproteolyticus rokko (Sigma Chemical, St. Louis, MO) was prepared in 2.5M NaCl containing 10 mM CaCl2.20 Protein concentration was determined spectrophotometrically in 20 mM sodium phosphate buffer (pH 6.5) containing 6.0M guanidinium chloride at 280 nm using extinction coefficients calculated with amino acid compositions.21 Urea and guanidinium chloride were from Shelton Scientific. CaCl2 and EDTA were from J. T. Baker. d-(+)-Maltose monohydrate was from Sigma-Aldrich.
Determination of unfolding kinetics by pulse proteolysis
MBP (12 μM) was unfolded in 20 mM Tris-HCl (pH 8.0) containing 50 mM NaCl, 10 mM CaCl2, and 3.50–5.50M urea at 25°C. RNase H (25 μM) was unfolded in 20 mM sodium acetate (pH 5.5) containing 50 mM KCl and 6.20–7.18M urea at 25°C. Typically, pulse proteolysis is performed with 10 mM CaCl2 in the reaction because thermolysin requires Ca2+ for its structural integrity.22 However, to determine unfolding kinetics of RNase H under the identical experimental condition as published in the literature,11 CaCl2 was not included in the unfolding buffer. It was confirmed that thermolysin retains enough activity for pulse proteolysis (1 min) without 10 mM CaCl2 in the reaction (data not shown).
The basic procedure for unfolding studies by pulse proteolysis is shown in Figure 1. After unfolding was initiated, the reaction was dispensed into 100 μL aliquots in separate tubes. At each designated time interval, an aliquot was digested with 0.20 mg/mL thermolysin for 1 min. Fifteen microliters of the reaction mixture was quenched by mixing with 5 μL of 50 mM EDTA (pH 8.0). The amounts of remaining intact protein were then determined by SDS-PAGE [Fig.1(A)(A)]. Gels were stained with Sypro Red fluorescence dye (Cambrex) and quantified with Typhoon Trio+ imaging system (GE Healthcare). Unfolding kinetic constants (ku) were determined by fitting the band intensities of intact protein (I) to Eq. (6):
| 6 |
where I0 is the band intensity at t = 0 [Fig.2(B)]. The unfolding kinetic constants in the absence of urea, ku(H2O), were determined by extrapolating unfolding kinetic constants measured in varying concentrations of urea by Eq. (7):
| 7 |
where mu is the dependence of unfolding kinetic constants on urea, R is the ideal gas constant (0.00198 kcal/mol K), and T is temperature in Kelvin [Table I and Fig.2(C,D)].
Determination of unfolding kinetic constants of MBP by circular dichroism
MBP (1.2 μM; 50 μg/mL) was unfolded in 20 mM Tris-HCl (pH 8.0) containing 50 mM NaCl, 10 mM CaCl2, and 3.85–6.10M urea at 25°C. Unfolding was monitored by following the change in ellipticity at 222 nm with an Aviv 62DS circular dichroism spectrometer. Unfolding kinetic constants were determined by fitting the change in ellipticity to a first-order rate equation. The plot of lnku versus [urea] was fit to Eq. (7) to determine mu and ku(H2O) [Table I and Fig.2(C)(C)].
Determination of unfolding kinetic constants of MBP in a cell lysate
E. coli MBP was overexpressed in E.coli BL21(DE3)pLysS under the control of T7 promoter with 1 mM isopropyl-thio-galactoside. Harvested cells were washed thoroughly with 20 mM Tris-HCl (pH 8.0) containing 50 mM NaCl to remove any maltose from the culture media. Cells were lysed by sonication, and cell debris was removed by centrifugation at 10,000g at 4°C for 30 min. The resulting supernatant was used without further purification.
Unfolding of MBP was initiated by diluting the cell lysate by 5-fold with a buffer containing urea. The final solution contained 20 mM Tris-HCl (pH 8.0), 50 mM NaCl, 10 mM CaCl2, and 5.50M urea. The concentration of MBP in the reaction was unknown. To monitor unfolding, pulse proteolysis was performed with aliquots of the reaction as described earlier [Fig.3(A)]. Unfolding kinetic constants were also determined as described earlier [Fig. 3(B)].
Determination of unfolding kinetics of maltose binding protein with maltose
Unfolding of MBP was monitored by pulse proteolysis in 20 mM Tris-HCl (pH 8.0) containing 50 mM NaCl, 10 mM CaCl2, 100 μM maltose, and 5.60–7.18M urea at 25°C. For fitting to the changes in band intensity, Eq. (3) is modified as:
| 8 |
The plot of the band intensities versus time was fit to Eq. (8) with Lt = 100 μM and Pt = 12 μM. The ku values determined by curve-fitting are the apparent unfolding kinetic constants at [L] = Lt. The log of ku values were plotted against urea concentrations to determine mu and ku(H2O) by fitting to Eq. (7) [Fig.4(A)(A)].
Unfolding kinetics of MBP was also determined by pulse proteolysis with a fixed urea concentration and varying concentrations of maltose. Unfolding of MBP was monitored in 20 mM Tris-HCl (pH 8.0) containing 50 mM NaCl, 10 mM CaCl2, 6.00M urea, and 25–200 μM maltose at 25°C. The concentration of MBP was 12 μM. The changes in band intensities from SDS PAGE gels were fit to Eq. (8) with an appropriate total maltose concentration to determine ku. To determine Kd, the plot of ku versus total maltose concentrations was fit to Eq. (2) [ Fig. 4(B)] with ku° of (1.0 ± 0.1) × 10−2 s−1, which is the unfolding kinetic constant of free MBP in 6.0M urea extrapolated with the parameters in Table I.
Acknowledgments
The authors thank Dr. Jun Xie for advices on nonlinear regression and Jonathan Schlebach for helpful comments on the manuscript.
Footnotes
Even in case that digestion of unfolded proteins is not complete, pulse proteolysis would still report accurate kunf values. Because of remaining unfolded proteins after pulse proteolysis, band intensities would not reflect the amounts of folded proteins directly. Also, band intensities would converge to a nonzero value at later time points. However, because the relative ratio of incomplete digestion at each time point would be identical, the decay rate would not be affected. When the intensity change is fit to a rate equation with a nonzero final intensity (I = I0e−kt + If), the accurate kunf would be determined.
References
- 1.Cunningham EL, Jaswal SS, Sohl JL, Agard DA. Kinetic stability as a mechanism for protease longevity. Proc Natl Acad Sci USA. 1999;96:11008–11014. doi: 10.1073/pnas.96.20.11008. [DOI] [PMC free article] [PubMed] [Google Scholar]
- 2.Plaza del Pino IM, Ibarra-Molero B, Sanchez-Ruiz JM. Lower kinetic limit to protein thermal stability: a proposal regarding protein stability in vivo and its relation with misfolding diseases. Proteins. 2000;40:58–70. doi: 10.1002/(sici)1097-0134(20000701)40:1<58::aid-prot80>3.0.co;2-m. [DOI] [PubMed] [Google Scholar]
- 3.Linderstrøm-Lang K. Peptide bonds in globular proteins. Nature. 1938;142:996. [Google Scholar]
- 4.Pace CN, Barrett AJ. Kinetics of tryptic hydrolysis of the arginine-valine bond in folded and unfolded ribonuclease T1. Biochem J. 1984;219:411–417. doi: 10.1042/bj2190411. [DOI] [PMC free article] [PubMed] [Google Scholar]
- 5.Imoto T, Yamada H, Ueda T. Unfolding rates of globular proteins determined by kinetics of proteolysis. J Mol Biol. 1986;190:647–649. doi: 10.1016/0022-2836(86)90250-0. [DOI] [PubMed] [Google Scholar]
- 6.Park C, Marqusee S. Probing the high energy states in proteins by proteolysis. J Mol Biol. 2004;343:1467–1476. doi: 10.1016/j.jmb.2004.08.085. [DOI] [PubMed] [Google Scholar]
- 7.Park C, Marqusee S. Pulse proteolysis: a simple method for quantitative determination of protein stability and ligand binding. Nat Methods. 2005;2:207–212. doi: 10.1038/nmeth740. [DOI] [PubMed] [Google Scholar]
- 8.Park C, Marqusee S. Quantitative determination of protein stability and ligand binding by pulse proteolysis. Curr Protoc Protein Sci. 2006;20:20.11.21–20.11.14. doi: 10.1002/0471140864.ps2011s46. [DOI] [PubMed] [Google Scholar]
- 9.Dabora JM, Marqusee S. Equilibrium unfolding of Escherichia coli ribonuclease H: characterization of a partially folded state. Protein Sci. 1994;3:1401–1408. doi: 10.1002/pro.5560030906. [DOI] [PMC free article] [PubMed] [Google Scholar]
- 10.Fersht AR. Structure and mechanism in protein science: a guide to enzyme catalysis and protein folding. New York: W. H. Freeman; 1998. p. 631. [Google Scholar]
- 11.Raschke TM, Marqusee S. The kinetic folding intermediate of ribonuclease H resembles the acid molten globule and partially unfolded molecules detected under native conditions. Nat Struct Biol. 1997;4:298–304. doi: 10.1038/nsb0497-298. [DOI] [PubMed] [Google Scholar]
- 12.Sancho J, Meiering EM, Fersht AR. Mapping transition states of protein unfolding by protein engineering of ligand-binding sites. J Mol Biol. 1991;221:1007–1014. doi: 10.1016/0022-2836(91)80188-z. [DOI] [PubMed] [Google Scholar]
- 13.Sugawara T, Kuwajima K, Sugai S. Folding of staphylococcal nuclease A studied by equilibrium and kinetic circular dichroism spectra. Biochemistry. 1991;30:2698–2706. doi: 10.1021/bi00224a018. [DOI] [PubMed] [Google Scholar]
- 14.Chiti F, Taddei N, van Nuland NA, Magherini F, Stefani M, Ramponi G, Dobson CM. Structural characterization of the transition state for folding of muscle acylphosphatase. J Mol Biol. 1998;283:893–903. doi: 10.1006/jmbi.1998.2010. [DOI] [PubMed] [Google Scholar]
- 15.Telmer PG, Shilton BH. Insights into the conformational equilibria of maltose-binding protein by analysis of high affinity mutants. J Biol Chem. 2003;278:34555–34567. doi: 10.1074/jbc.M301004200. [DOI] [PubMed] [Google Scholar]
- 16.Arnold U, Ulbrich-Hofmann R. Kinetic and thermodynamic thermal stabilities of ribonuclease A and ribonuclease B. Biochemistry. 1997;36:2166–2172. doi: 10.1021/bi962723u. [DOI] [PubMed] [Google Scholar]
- 17.Hvidt A, Nielsen SO. Hydrogen exchange in proteins. Adv Protein Chem. 1966;21:287–386. doi: 10.1016/s0065-3233(08)60129-1. [DOI] [PubMed] [Google Scholar]
- 18.Kuwajima K, Mitani M, Sugai S. Characterization of the critical state in protein folding: effects of guanidine hydrochloride and specific Ca2+ binding on the folding kinetics of α-lactalbumin. J Mol Biol. 1989;206:547–561. doi: 10.1016/0022-2836(89)90500-7. [DOI] [PubMed] [Google Scholar]
- 19.Ferreon AC, Ferreon JC, Bolen DW, Rösgen J. Protein phase diagrams. II. Non-ideal behavior of biochemical reactions in the presence of osmolytes. Biophys J. 2007;92:245–256. doi: 10.1529/biophysj.106.092262. [DOI] [PMC free article] [PubMed] [Google Scholar]
- 20.Inouye K, Kuzuya K, Tonomura B. Sodium chloride enhances markedly the thermal stability of thermolysin as well as its catalytic activity. Biochim Biophys Acta. 1998;1388:209–214. doi: 10.1016/s0167-4838(98)00189-7. [DOI] [PubMed] [Google Scholar]
- 21.Gill SC, von Hippel PH. Calculation of protein extinction coefficients from amino acid sequence data. Anal Biochem. 1989;182:319–326. doi: 10.1016/0003-2697(89)90602-7. [DOI] [PubMed] [Google Scholar]
- 22.Dahlquist FW, Long JW, Bigbee WL. Role of calcium in the thermal stability of thermolysin. Biochemistry. 1976;15:1103–1111. doi: 10.1021/bi00650a024. [DOI] [PubMed] [Google Scholar]