Abstract
Glioblastoma Multiforme (GBM) is an aggressively invasive brain neoplasm with poor patient prognosis. We have previously shown that the bioactive lipid sphingosine-1-phosphate (S1P) stimulates in vitro invasiveness of GBM cells and that high expression levels of the enzyme that forms S1P, sphingosine kinase-1 (SphK1), correlate with shorter survival time of GBM patients. We also recently showed that S1P induces expression of CCN1 (also known as Cyr61), a matricellular protein known to correlate with poor patient prognosis, in GBM cells. In this study we further explored the role of CCN1 as well as the urokinase plasminogen activator (uPA), a protein known to stimulate GBM cell invasiveness, in S1P-induced invasion using a spheroid invasion assay. We also investigated the roles of various S1P receptors in stimulating invasiveness through these pathways. S1P induced expression of uPA, and its receptor uPAR in GBM cells. While S1P1–3 receptors all contribute at least partially, S1P1 overexpression led to the most dramatic induction of the uPA system and of spheroid invasion, even in the absence of added S1P. Furthermore, neutralizing antibodies directed against uPA or CCN1 significantly decreased both basal and S1P-stimulated GBM cell invasiveness. Inhibition of SphK blocked basal expression of uPA and uPAR, as well as glioma cell invasion, however overexpression of SphK did not augment S1P receptor-mediated enhancement of uPA activity or invasion. Thus, SphK is necessary for basal activity of the uPA system and glioma cell invasion, while S1P receptor signaling enhances invasion, partially through uPA and CCN1.
Keywords: sphingosine-1-phosphate, sphingosine kinase, glioma, invasion
Introduction
Glioblastoma multiforme (GBM) is a grade IV astrocytoma and is the most common primary brain tumor in adults. This deadly cancer has a five year survival rate of less than 5% and a median patient lifespan of approximately one year from diagnosis (1). Histopathologically, GBM displays significant vascular proliferation, localized invasiveness, and a high mitotic index. Standardized patient treatment includes tumor resection followed by chemotherapy and localized radiation treatment. The ineffectiveness of the current treatment regimen inevitably leads to tumor recurrence, often near the site of tumor resection. Consequently, molecular-based strategies to target GBM pathobiology are needed to significantly improve patient outcome.
Sphingosine-1-phosphate (S1P) is a potent lipid signaling molecule that binds to a family of G-protein coupled receptors (GPCRs) to influence cellular proliferation, migration, invasion, adhesion, angiogenesis, and differentiation (2–4). S1P acts both intracellularly as a second messenger (5) and through five cell surface, GPCRs of the EDG family S1P1/EDG-1, S1P2/EDG-5, S1P3/EDG-3, S1P4/EDG-6 and S1P5/EDG-8 (4).
We have previously shown that S1P has profound effects on GBM cells. The specific signaling pathways utilized by S1P and the biological consequences are dependent upon the S1P receptor subtypes expressed, since unique sets of G-proteins are activated to varying degrees by the different receptors (4). Both GBM cell lines and tissue express the S1P receptor subtypes S1P1, S1P2 and S1P3 (6). By signaling through these receptors S1P stimulates both proliferation and migration/invasion of several GBM cell lines (6, 7). Furthermore, high levels of expression in GBM tissue of the enzyme which forms S1P, sphingosine kinase-1 (SphK1), correlates with a more than 3 fold shorter survival time of patients and knockdown of SphK by RNA interference decreases glioma cell proliferation by preventing entry into the cell cycle (8). Thus, SphK1 and S1P play important roles in the malignant behavior of GBM cells.
Recently we showed that the three S1P receptors commonly expressed in GBM S1P1–3, all contribute to S1P-stimulated GBM cell growth (9). In addition, S1P1 and S1P3 stimulate GBM cell migration. Although S1P2 decreased GBM cell migration, it increased invasion through Matrigel, and this correlated with enhanced attachment of glioma cells to Matrigel in response to S1P2. S1P1 and S1P2 signaling led to increased expression of CCN1, a secreted matricellular protein also known as Cyr61, and S1P2-stimulated invasion was inhibited by an antibody to CCN1 (9).
Secreted CCN1 associates with integrin αvβ3 as well as extracellular matrix (ECM) proteins. In this way, CCN1 serves as a link to connect cellular integrins to the ECM and has been shown to stimulate cellular adhesion, migration, angiogenesis and invasion (10–12). Elevated CCN1 has been shown to correlate with tumor progression and poorer patient prognosis in glioma patients (13) and to enhance tumorigenicity of glioma cells (14).
We have also recently shown that S1P stimulation of GBM cells results in notable upregulation of mRNA expression for urokinase plasminogen activator (uPA) (15). uPA and its receptor uPAR, are critical mediators of invasiveness (16, 17). uPA is secreted in an inactive form (pro-uPA) and becomes activated through binding uPAR at the cell surface. Activated uPA can then convert plasminogen to plasmin, which is involved in the degradation of fibrin (16) and further activation of matrix metalloproteinases (MMP) (18). Furthermore, uPAR interacts with integrins, and uPAR/integrin complexes activate intracellular signaling cascades that have been linked to cellular adhesion, proliferation, and migration (19), as well as tumorigenesis and in vivo cancer progression (20). Elevated expression of uPAR has been shown in glioblastoma cells (21). Down regulation of uPA and uPAR expression in gliomas inhibits glioma invasion, growth and angiogenesis (22, 23).
This study investigates the role of CCN1 and uPA in mediating invasiveness of GBM cells induced through individual S1P receptor subtypes S1P1–3. S1P1 and S1P2 receptors contribute to CCN1 induction, while all three receptors cooperate to induce expression of members of the uPA system, with S1P1 being the most potent. Furthermore, neutralizing antibodies directed against uPA or CCN1 significantly decreased both basal and S1P-stimulated GBM cell invasiveness. uPA activity and glioma invasion were also potently blocked by SphK inhibition. Thus, the SphK/S1P/S1P receptor signaling axis plays important roles in glioma invasion, partially through induction of CCN1 and the uPA system.
Results
Influence of S1P on expression of genes related to GBM invasiveness
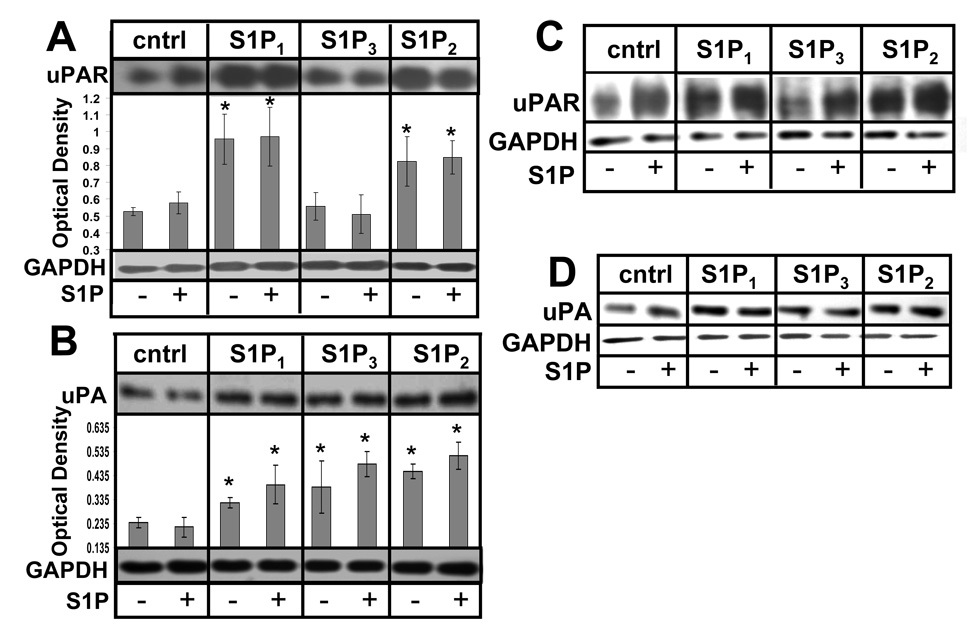
We have previously shown S1P to induce CCN1 and uPA mRNA expression in U-373 MG glioma cells (15). We have also found that S1P1 or S1P2 activation led to increased CCN1 protein levels in U-118 MG cells (9). To further explore S1P-mediated expression of genes known to correlate with GBM invasiveness, the effects of S1P1–3 receptor subtypes on uPA and uPAR protein expression was examined in U-118 MG cells stably transfected with expression constructs encoding S1P receptor subtypes S1P1–3 in comparison to empty vector-transfected U-118-control cells (9). U-118 MG cells were chosen because they normally expresses very low levels of S1P receptors and, therefore, do not respond to S1P with either proliferation or migration. The clones used overexpress the transfected receptor at approximately a four fold level of overexpression with no change in expression levels of any of the other S1P receptors (9). Preliminary dose dependence experiments had shown an induction of uPA by S1P treatment in glioma cells that peaked at 100 nM S1P (data not shown). The cells were treated with or without 100 nM S1P after a period of starvation and immunoblot analysis of uPA and uPAR was performed. Results of three independent experiments were quantitated. Both S1P1 and S1P2 receptor subtype overexpression caused significant induction of uPAR with and without S1P treatment (Fig. 1A). Increased expression of uPA was observed with and without S1P treatment in cells overexpressing all three S1P receptor subtypes compared to U-118-control cells under the same conditions (Fig. 1B). Similar results were obtained using different clones of S1P receptor-overexpressing U-118 MG cells (Fig 1C&D) indicating that the changes in gene expression are not merely quirks of the particular clones.
FIGURE 1.
Regulation of genes involved in glioma invasion by S1P. U-118-control and S1P receptor overexpressing cell lines were starved and treated without or with 100 nM S1P for 24 hours. A and B. Cell lysates were immunoblotted for uPAR (A) or uPA (B) as described in Material and Methods. Quantitation was performed using ImageJ software. Data are means ± standard deviations of triplicate determinations. * represents a statistically significant difference (p< 0.05) compared to U-118 control cells as determined by Student’s T-test. C and D. Alternate clones of U-118-control and S1P receptor-overexpressing cells were examined for uPAR and uPA expression as above.
The results of the expression analysis suggest that S1P receptor subtypes have a profound, coordinated effect on expression of several genes which are known to be involved in GBM invasiveness. S1P1 and S1P2 may be the major players in regulating this system as they both induce expression of uPA and uPAR. S1P3 may also contribute to uPA induction. Notably, in U-118 cells induction of uPA and uPAR was observed in the absence of added S1P, suggesting either constitutive activity of overexpressed receptors or an endogenous autocrine production of S1P in these cells.
Effect of S1P receptors on secreted uPA activity
To examine the downstream biological relevance of the induction of these proteins, we next measured uPA activity using fibrin zymography of conditioned media produced by these cells. uPA is secreted as inactive pro-uPA and is converted to an active form at the cell surface where it binds to its receptor uPAR. When activated, uPA can convert plasminogen to plasmin which can mediate several downstream effects (24). Conditioned media from the GBM cell lines treated with or without S1P was collected and subjected to zymography using gels containing plasminogen and fibrinogen. The SDS was then washed out of the gels and proteins were allowed to renature over an incubation period. Staining revealed zones of lysis where fibrin had been degraded in the gel. Lysis at the molecular weight corresponding to uPA is a measure of the activity of this enzyme to convert plasminogen to plasmin, which ultimately resulted in the degradation of fibrin.
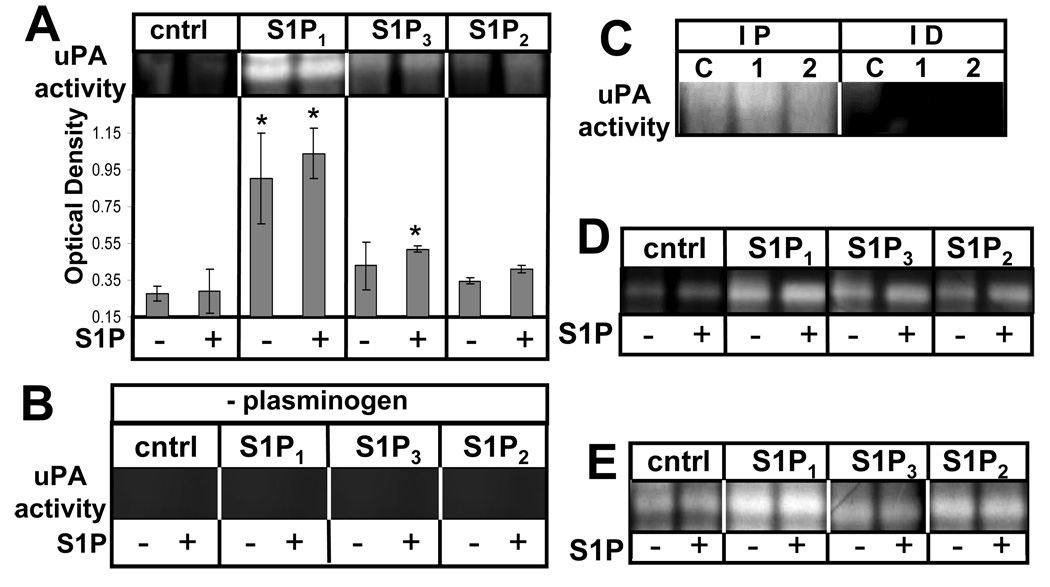
S1P1 overexpression in U-118 MG cells resulted in potent stimulation of uPA activity regardless of S1P treatment. Additionally, a mild stimulation of uPA activity was observed with S1P3 overexpression. S1P2 overexpression had little effect on uPA activity compared to control cells (Fig. 2A). Furthermore, similar to the induction of uPA/uPAR protein expression seen above, the stimulation of uPA activity by S1P1 was not influenced by the addition of S1P in this experiment.
FIGURE 2.
S1P receptor subtype effect on uPA activity. Conditioned media from U-118-control or S1P1–3 overexpressors was collected after treatment without or with 100 nM S1P for 24 hours A. Fibrin zymography was performed as described in Materials and Methods and zones of lysis were quantitated using ImageJ software. Data are means ± standard deviations of triplicate determinations. * represents a statistically significant difference (p< 0.05) compared to U-118-control sample as determined by Student’s T-test. B. The samples used in Panel A were run on plasminogen-free gels as a negative control. The area of the gel corresponding to the molecular weight of uPA is shown. C. uPA was immunoprecipitated from conditioned media from U-118-control (C), −S1P1 (1), or −S1P2 (2) cells. Immunoprecipitates (IP) or Immunodepleted (ID) samples were analyzed by fibrin zymography. D. Alternate U-118 cell clones were analyzed for secreted uPA activity as above.
To ensure that the fibrin degradation in the zymographic analysis was caused by uPA-induced activation of plasminogen, plasminogen-free gels containing fibrinogen were prepared. Using the same GBM cell lines as above, the experiment was repeated. On these gels no fibrin lysis was observed at the molecular weight corresponding to uPA (Fig. 2B). Additionally, the specificity of uPA was further confirmed by immunoprecipitation of uPA from supernatants prior to zymographic analysis. uPA immunoprecipitates showed fibrin degrading activity at the proper molecular weight, while the immunodepleted supernatants did not (Fig. 2C). uPA immunoprecipitates from S1P1-overexpressing cells also appeared to have elevated uPA activity.
We next confirmed these results using alternate clones of stably transfected U-118 cells. As shown in Figure 2D, in these clones S1P1 overexpression was again the most effective at activating uPA. Furthermore, we also stably overexpressed S1P receptors in another glioma cell line, A172. As shown in Figure 2E, S1P1 was again the most potent receptor at activating uPA in A172 cells.
Role of SphK1 in S1P receptor-mediated uPA/uPAR effects
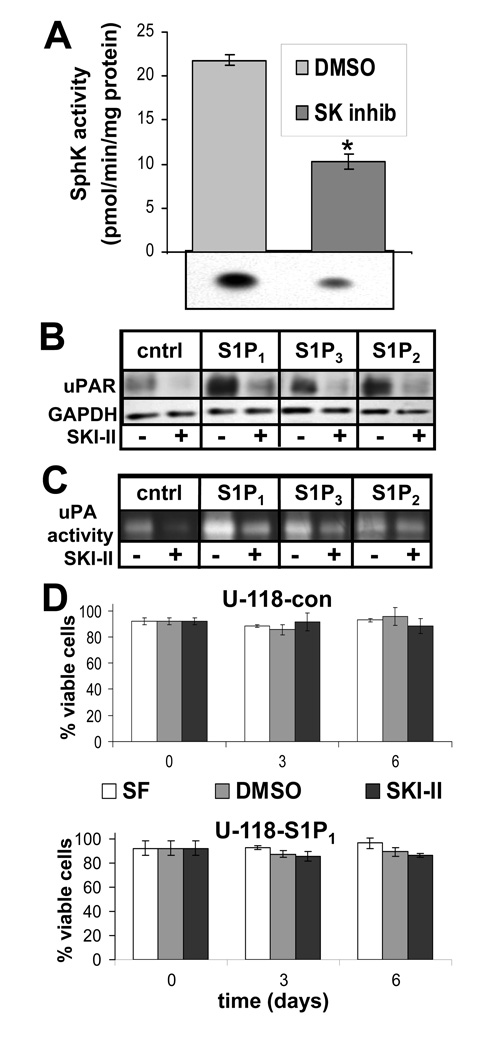
As noted above, uPA/uPAR expression and uPA activity were elevated in S1P receptor-overexpressing cells in the absence of added S1P. In order to explore whether SphK1 was involved in producing S1P which contributed to constitutive activity of overexpressed S1P receptors, experiments were performed on cells pretreated with or without the SphK inhibitor SKI-II (25). Incubation of U-118-control cells with SKI-II decreased SphK1 activity approximately 50% (Fig. 3A). uPAR expression in U-118-control and S1P receptor overexpressing cells was then measured in the absence or presence of SKI-II. As seen above, S1P1 or S1P2 overexpression led to significant uPAR upregulation. SKI-II, however, prevented this effect in cells overexpressing both receptor subtypes (Fig. 3B). Moreover, SKI-II decreased basal levels of uPAR in U-118-control cells. In addition, uPA activity in conditioned media from all the cell lines tested was potently decreased by SKI-II (Fig. 3C). Overexpression of S1P1 and S1P3, to some extent, led to increased uPA activity as above, but SKI-II decreased this activity to approximately untreated control levels.
FIGURE 3.
Effect of sphingosine kinase inhibition on the uPA system. A. U-118-control cells were treated for 24 hours with 1 µg/ml SphK inhibitor SKI-II or DMSO as a vehicle control and subjected to a sphingosine kinase assay as described in Materials and Methods. The data represent means ± standard deviations of triplicate samples. The * indicates a statistically significant difference by Student’s t-test (p<0.0005). Two independent experiments provided similar results. U-118-control or S1P1–3 expressing stable transfections were treated as in Panel A and subjected to Western blot analysis as described above to measure uPAR expression (B) or conditioned media was analyzed by fibrin zymography to measure uPA activity (C). D. Cells were cultured in serum-free medium (SF) or with DMSO vehicle or SKI-II as above and cellular viability was measured as described in Materials and Methods. Data are means ± standard deviations of triplicate determinations. No significant differences were seen for any of the conditions tested. Two independent experiments provided similar results.
To ensure that decreased uPAR expression and uPA activity in the presence of SKI-II was not a nonspecific consequence of toxicity, U-118-control and S1P1-overexpressing cells were treated with or without SKI-II and cell viability was measured over a six day period. SKI-II treatment did not significantly affect cell viability, which remained approximately 90% over the course of the experiment in both cell lines (Fig. 3D). Therefore, effects of SKI-II on these cells can not be attributed to toxicity.
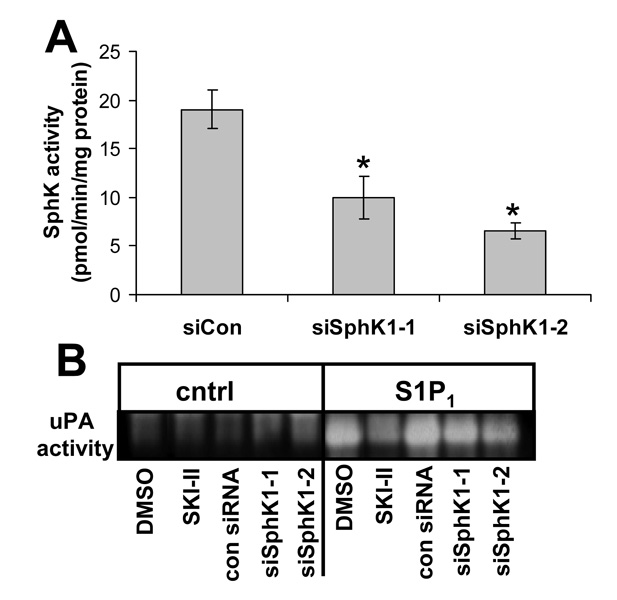
Although SKI-II has not been shown to have effects that are not specific to SphK inhibition, we wished to verify the significance of SphK to uPA activity by another means. We therefore transfected U-118-control or U-118-S1P1 cells with siRNA specific to SphK1. We used two different siRNA oligonucleotides which are commercially available as well as a control siRNA oligonucleotide which has no homology to known human genes. Both SphK1-specific siRNAs decreased SphK activity with siSphK1–2 being slightly more effective (Fig. 4A). Both siRNAs also decreased uPA activity in conditioned medium from U-118-S1P1 cells while the control siRNA had no effect (Fig. 4B), again with siSphK1–2 being slightly more potent. siRNA treatment was less effective than the inhibitor SKI-II, presumably due to incomplete down regulation of SphK1 by siRNA.
FIGURE 4.
Effect of RNA interference for SphK1 on uPA activity. U-118-control cells were transfected with control scrambled siRNA oligonucleotides or two different siRNA oligonucleotides specific for SphK1 (siSphK1-1 or -2) and two days later SphK activity was measured (A) or conditioned media were harvested and uPA activity measured by fibrin zymography (B). For (B) 1 µg/ml SphK inhibitor SKI-II was used. For A) data are means ± standard deviations of data from three independent experiments. The * indicates a statistically significant difference by Student’s t-test (p<0.005).
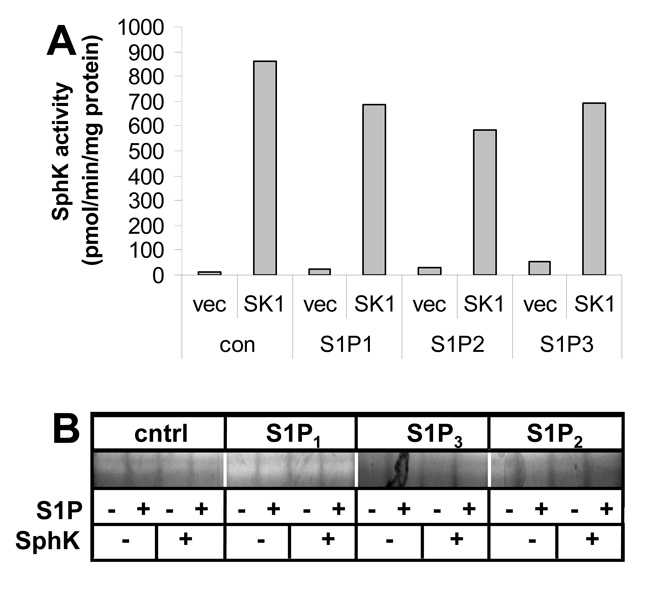
To further explore the role of SphK in induction of uPA activity, we stably transfected U-118-control and S1P receptor overexpressing cells with SphK1 in an expression vector containing a different selectable marker or the empty vector alone. SphK1 overexpression led to a dramatic increase in SphK activity compared to vector-transfected controls (Fig. 5A). Next we performed fibrin zymography for uPA activity on conditioned medium from these cells to determine whether increased SphK activity further activated uPA. As shown in Figure 5B, SphK1 overexpression failed to further activate uPA in either U-118-control cells with low levels of S1P receptors or in U-118 cells overexpressing any of the three S1P receptors.
FIGURE 5.
Lack of effect of SphK overexpression on uPA activity in the presence or absence of S1P receptor overexpression. U-118 control and S1P receptor overexpressing cell lines were stably transfected with a SphK1 expression construct or empty vector. A. Cells were lysed and SphK activity was measured as described in Materials and Methods. B. uPA activity in conditioned medium was determined by fibrin zymography analysis.
Taken together, these results suggest that endogenous SphK1 activity is necessary to maintain basal levels of uPA/uPAR expression and uPA activity. However, S1P1-induced further increases in uPA activity appears to be independent of cellular SphK activity.
Roles of CCN1, uPA and SphK in S1P receptor-mediated glioma cell invasion
In order to examine the relevance of uPA/uPAR and CCN1 to SphK1/S1P receptor-mediated GBM invasiveness, spheroid invasion assays were performed using our U-118 MG cell lines under a variety of conditions. In this assay a spheroid of cells is placed within a three-dimensional Matrigel environment that has potential stimulatory or inhibitory factors dispersed throughout. This assay may be thus be more representative of in vivo invasiveness than the two dimensional Boyden chamber assay (26). In addition, cells can be photographed over time invading through the Matrigel.
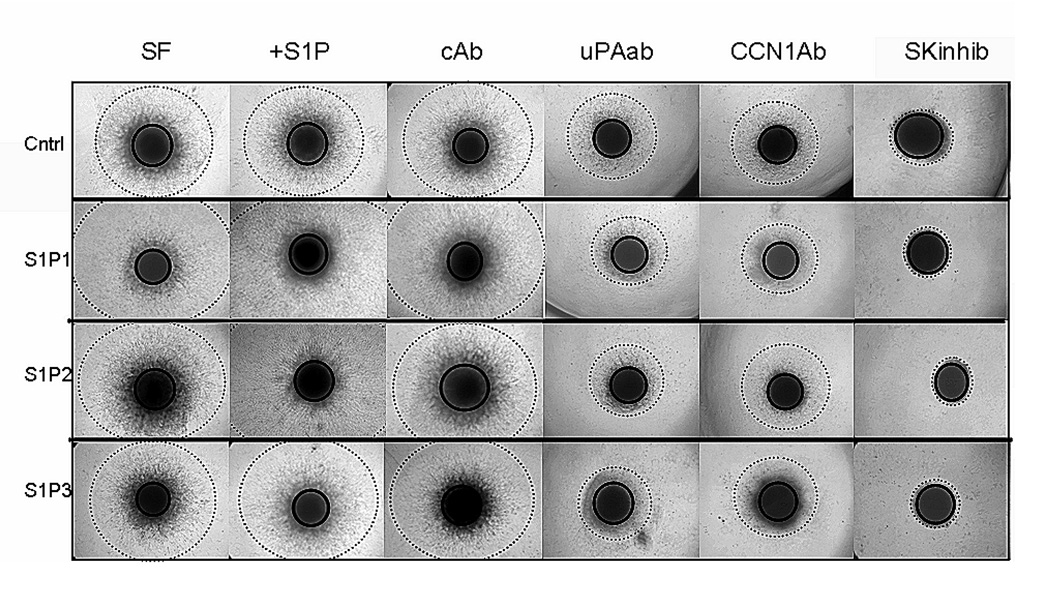
The invasiveness of U-118 MG control and S1P1–3 overexpressing GBM cells was measured over six days in the absence or the presence of S1P, SKI-II, or neutralizing antibodies to CCN1 or uPA in comparison to an irrelevant control antibody. Invasion was quantitated using NIH ImageJ software and expressed as the average ± the standard deviation of the invasive diameter minus the core spheroid diameter after six days of invasion (Table 1). Similar trends were seen at earlier time points. Photographs of typical spheroids from each cell line and condition tested after six days invasion are shown in Figure 6. Core spheroid size of each cell line increased only slightly over time with no core spheroid increasing over 1.3 fold throughout the course of the experiment (data not shown). This indicates that the cells observed outside the core spheroid over time are due to cells actively moving through the Matrigel.
Table 1.
Role of uPA, CCN1 and SphK in glioma cell spheroid invasion
| invasive distance (μm) | |||||||
|---|---|---|---|---|---|---|---|
| cell line | serum free | S1P | control antibody |
uPA antibody |
CCN1 antibody |
SphK inhibitor |
uPA & CCN1 ab |
| U-118-con | 371 ± 71 | 326 ± 90 | 459 ± 93 | 235 ± 108Ü | 209 ± 32Ü | 49 ± 15* | |
| U-118-S1P1 | 577 ± 128á | 674 ± 15β | 552 ± 54 | 272 ± 31Ü | 269 ± 54Ü | 36 ± 6* | |
| U-118-S1P2 | 479 ± 89 | 612 ± 94β | 474 ± 75 | 198 ± 29Ü | 249 ± 55Ü | 31 ± 12* | |
| U-118-S1P3 | 532 ± 77á | 547 ± 110β | 409 ± 90 | 212 ± 52Ü | 111 ± 36Ü | 55 ± 39* | |
| A172-con | 507 ± 44 | 409 ± 116 | 406 ± 91 | 173 ± 17Ü | 319 ± 92 | 89 ± 36* | 144 ± 8Ü |
| A172-S1P1 | 508 ± 44 | 607 ± 39*β | 529 ± 69 | 221 ± 96Ü | 324 ± 65Ü | 135 ± 44* | 207 ± 73Ü |
| A172-S1P2 | 567 ± 15á | 598 ± 67β | 427 ± 48 | 225 ± 67Ü | 332 ± 73 | 123 ± 95* | 162 ± 61Ü |
| A172-S1P3 | 599 ± 44á | 662 ± 16*β | 527 ± 33 | 183 ± 43Ü | 318 ± 90Ü | 205 ± 105* | 218 ± 110Ü |
Four replicate spheroids were examined for each condition after six days of invasion. Images of spheroids are shown in Figure 6. Invasive distance, defined as invasive diameter – core diameter in μm, is expressed as mean ± standard deviation.
Statistically significant difference compared to serum-free conditions for the same cell line, p<0.05.
Statistically significant difference compared to control antibody for the same cell line, p<0.05.
Statistically significant difference compared to control cells in serum-free conditions, p<0.05.
Statistically significant difference compared to control cells with S1P, p<0.05.
FIGURE 6.
Roles of uPA, CCN1 and SphK in S1P receptor mediated invasion of U-118 cells. Spheroids of U-118-control (cntrl) S1P1, S1P2, and S1P3 overexpressing cell lines were implanted into polymerized Matrigel and cultured with serum free media alone or with 100 nM S1P, 1 µg/ml SKI-II, or 20 µg/ml of either irrelevant control antibody, CCN1 antibody, or uPA antibody. Spheroid core diameter and invasive radius were measured following six days invasion. Four replicate spheroids were examined for each condition. Quantitative data are shown in Table 1. Illustrations of core diameter (solid line circle) and invasive diameter (dashed line circle) are shown for each cell line and condition tested at the six day time point. SF= serum free media, Ab=antibody, SK inhib = sphingosine kinase inhibitor SKI-II
Overexpression of S1P1 or S1P3 in U-118 cells significantly enhanced invasion even in the absence of added S1P (Table 1, column 1). While S1P2 overexpression showed a tendency toward increased invasion in the absence of S1P, this effect did not reach statistical significance. S1P treatment of U-118-control cells had no effect on invasion, however, in the presence of added S1P, all three S1P receptor-overexpressing cells invaded significantly further than U-118-control cells (Table 1, column 2). Thus, while overexpression of S1P receptors can in some cases affect invasion in the absence of added S1P, in the presence of S1P all three receptor subtypes positively influence invasion of these cells.
Treatment with neutralizing antibodies revealed roles for CCN1 and uPA in invasion of these cells. Compared to U-118 cells treated with an irrelevant control antibody, neutralizing antibodies to CCN1 or uPA significantly decreased invasion. For the four U-118 cell lines investigated, invasion was significantly greater in cells in serum-free medium, with 100 nM S1P, and with control antibodies than in those treated with the CCN1 or uPA antibodies, which themselves showed significantly greater invasion than the cells treated with the SphK inhibitor (p<0.001, non-parametric permutation test). This was true for U-118 control as well as S1P receptor-overexpressing cells. In each overexpressing S1P1–3 cell line, the total invasive distance was decreased to approximately half that of serum-free or control antibody-treated wells with antibody to either uPA or CCN1. Thus, uPA and CCN1 are important for both basal and S1P receptor-stimulated invasion of U-118 glioma cells.
The greatest decrease of invasiveness was observed with the addition of the sphingosine kinase inhibitor SKI-II to the spheroid samples. With this treatment, invasiveness was almost completely eliminated in all U-118 MG cell lines. Taken together, the potent effect of SphK inhibition and the enhancement of invasion by S1P receptor overexpression, particularly in the presence of S1P, suggest that the SphK/S1P/S1P receptor axis may play a key role in the regulation of invasion. While SphK appears to maintain basal levels of uPA activity and basal invasion rates, S1P receptor signaling further boosts invasion, at least partially through regulation of CCN1 expression and the uPA system.
We further wished to confirm these effects for another glioma cell line. We therefore, used our A172 S1P receptor-overexpressing cells in a spheroid invasion assay. Similar results to those seen for U-118 cells were obtained (Table 1). As for U-118 cells, in the presence of S1P all three S1P receptor-overexpressing A172 lines invaded further than A172-control cells either with or without S1P.
Antibodies to uPA inhibited invasion in all cell lines. The CCN1 antibody was less effective in A172 cells although it tend to decrease invasion in each case with statistically significant effects for S1P1 and S1P3–overexpressing A172 cells. Combining uPA and CCN1 antibodies did not inhibit invasion significantly more than uPA antibody alone. The SKI-II treatment was again very effective at blocking invasion of A172 cell lines.
Examination of cellular morphology along the spheroid invasive periphery
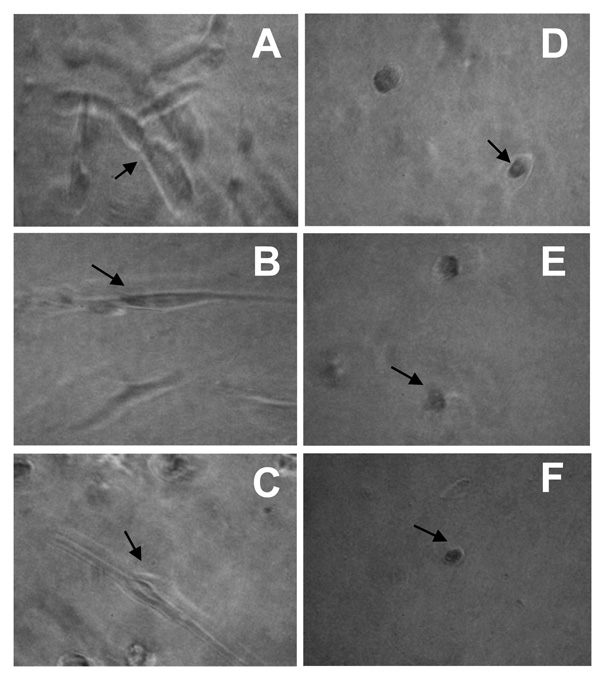
Cellular invasion is a complex process requiring actin cytoskeletal rearrangements that result in lamellipodia formation to allow cells to extend processes and move forward. Since the treatment of spheroids with antibody to CCN1 or uPA or with SKI-II all significantly decreased invasiveness, cellular morphology along the invasive periphery was more closely examined under these conditions. Following six days of invasion, U-118-control and S1P1–3 overexpressing cells were photographed along the invasive front at high magnification. Figure 7 shows images of U-118-S1P1 cells. Similar cellular morphologies were seen in the three remaining cell lines (data not shown). Treatment with CCN1 antibody, uPA antibody, or SKI-II (Fig. 7D–F) all resulted in a more rounded cellular morphology when compared to corresponding serum-free, control antibody, or S1P-treated cells (Fig. 7A–C), which showed morphology consistent with actively invading cells. This is marked by a more stretched, extended cellular morphology. Therefore, as these treatments reduced invasiveness, they also produce cells that are morphologically less aggressive and more rounded in appearance.
FIGURE 7.
Effects of uPA, CCN1 and SphK on cellular morphology along the invasive periphery during spheroid invasion. Spheroids of U-118-S1P1 cells were implanted into polymerized Matrigel as described for Figure 6. Cellular morphologies along the invasive periphery are represented for each condition. Arrows indicate cells with typical morphology for each condition. A. serum free; B. 100 nM S1P; C. control antibody; D. uPA antibody; E. CCN1 antibody; F. 1 µg/ml SKI-II inhibitor.
Discussion
We have previously established that increased SphK1 expression correlates with decreased survival of GBM patients (8), as well as shown that S1P signaling through its receptors enhances GBM cell invasiveness (6). Examination of genes that are upregulated by S1P in U-373 MG cells by microarray analysis combined with a bioinformatic text mining approach suggested that a program of genes enhancing invasiveness might be activated by S1P signaling in glioma cells (15). The purpose of this study was to examine the role of two of those pathways, CCN1/Cyr61 and the uPA system, both of which have been implicated in GBM (13, 14, 22), in invasiveness of glioma cells induced by the SphK1/S1P/S1P receptor signaling axis.
Our data indicate that both CCN1 (9) and the uPA system are induced by S1P signaling in glioma cells. All three of the S1P receptors commonly expressed in gliomas participate in these responses. We previously showed that S1P1 and S1P2, but not S1P3, induce CCN1 expression (9). In this study we show a similar pattern for induction of uPAR expression, while all three receptors induced uPA expression. S1P was the most potent inducer of uPA activity. All three receptors also enhanced invasion of cells through Matrigel in a spheroid invasion assay, and the invasion was blocked by neutralizing antibodies to either CCN1 or uPA, indicating the importance of these pathways for S1P-induced invasion. Notably, both antibodies also caused a more rounded cell morphology suggesting that these pathways may be important for attachment of glioma cells to extracellular matrix. It should be noted that both CCN1 and the uPA/uPAR complex are known to interact with cell surface integrins αv and β3, which are expressed in U-118 cells (data not shown), and thus it is possible that the antibodies used disrupted these complexes leading to cell rounding. CCN1 can also bind to heparin sulfate proteoglycans (27), present in Matrigel and in brain extracellular matrix, to provide an adhesion anchor for these cells.
Many of the above responses were seen even in the absence of added S1P, especially for U-118-S1P1 cells. As the first U-118-S1P1 clone we examined had somewhat higher SphK activity than our other clones, we hypothesized that this may have been due to autocrine activation of S1P receptors by S1P produced by cellular SphK. To examine this possibility we performed experiments with other U-118-S1P1 clones having lower SphK activity as well as A172 cells overexpressing S1P receptors. Although none of the other U-118 clones nor the A172 S1P receptor-overexpressing cells had altered SphK activity we observed similar upregulation of the uPA system again with S1P1 being the most potent. Furthermore, overexpression of SphK1 in U-118 clones with or without S1P receptor overexpression did not affect uPA activation. Thus, the constitutive activity of the overexpressed receptors does not appear to be due to increased SphK activity. In addition, these data demonstrate that S1P1 is the most potent upregulator of the uPA system.
In contrast SphK inhibition, down regulated endogenous expression of proteins of the uPA system and uPA activity, and nearly eliminated basal invasion of both U-118-control and A172-control cells. Thus, it appears that SphK may be required for the basal expression level of these proteins and basal invasion of glioma cells. Since, SphK inhibition decreased invasion to lower levels than a combination of antibodies to uPA and CCN1, it is likely that SphK contributes to other pathways involved in glioma cell invasion as well. In this regard, we have previously shown that S1P stimulates motility of several glioma cell lines (6). Interestingly, S1P was not detected in conditioned medium from our glioma cells, even with overexpression of SphK in U-118 cells (data not shown). Thus, the contribution of SphK to basal levels of glioma invasion may be at least in part receptor-independent, although we can not eliminate the possibility of a low level of secreted S1P below the detection limit of our assay contributing to this process.
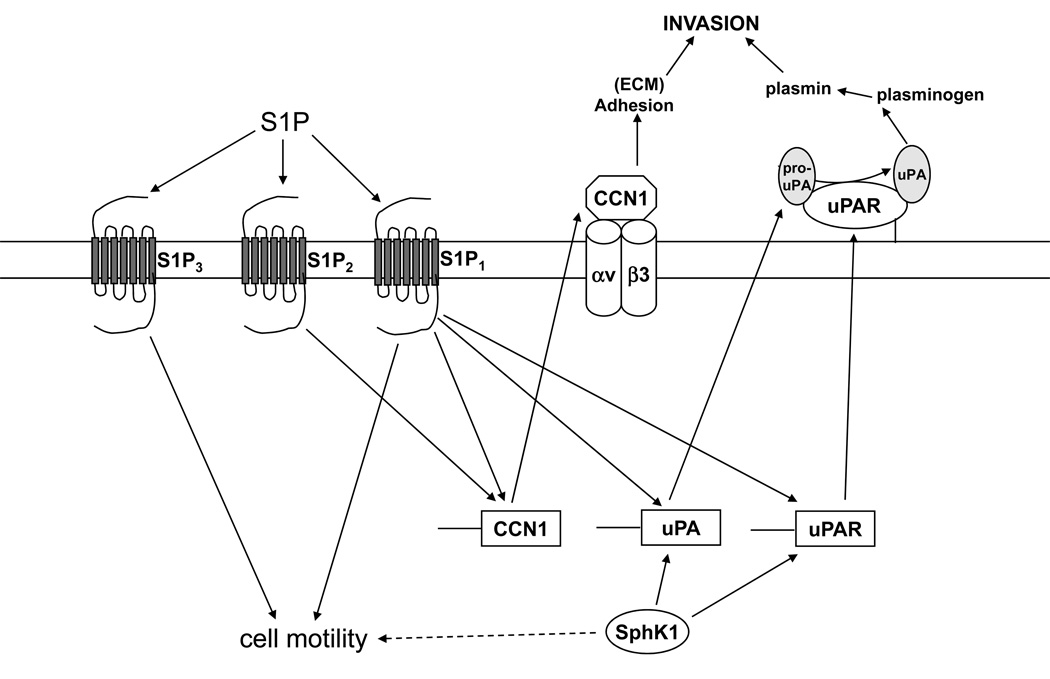
Thus, we propose that SphK and S1P impact glioma invasion through multiple mechanisms (Fig. 8). SphK is crucial for invasion, partially through maintenance of basal levels of the uPA/uPAR system. CCN1 and uPA are necessary to maintain this basal invasion rate since neutralizing antibodies to these proteins decrease invasion of U-118-control and A172-control cells.
FIGURE 8.
Diagram illustrating proposed pathways by which SphK and S1P receptor signaling regulate glioma cell invasion. SphK signaling is necessary for maintenance of uPA and uPAR expression and the basal invasive activity of glioma cells, by a mechanism that may be receptor independent. S1P1 most potently enhances uPA activity. S1P2 induces CCN1 and enhances cell adhesion, while S1P3 may rely mostly on stimulation of motility.
In addition, S1P receptor signaling can further enhance invasion. For S1P1 this likely involves increased activation of the uPA system, as this receptor is the most potent activator of this system. S1P2 and S1P3 had minimal effects on uPA activity, however still enhanced invasion in the spheroid assay. Thus, these receptors may rely more on other mechanisms to enhance invasion. For S1P2, although it tends to decrease cell motility, we have previously shown that this receptor utilizes induction of CCN1 to enhance U-118 cell invasion, and that it potently stimulates adhesion of glioma cells to Matrigel (9). S1P3 is well known to enhance cell motility, and thus, may rely on this mechanism.
Although S1P3 and particularly S1P2 only weakly affected uPA activity in comparison to S1P1, they had potent effects on uPA and uPAR expression, especially for S1P2. This suggests that S1P1 utilizes another signaling pathway to activate uPA and that S1P2 and S1P3 do not stimulate this pathway. Nevertheless, these three receptors clearly have overlapping functions in this system. This is likely due to the fact that they have different, but overlapping, G protein-coupling specificities (28).
It is also interesting to note that uPAR ligation has been shown to lead to activation of SphK (29). Thus, it is possible that uPA and SphK signaling systems impact each other on several levels, and in some cases positive feedback loops may even function. In addition, SphK1 has been shown to be necessary for EGF-induced expression of PAI-1, another member of the uPA system in A172 glioma cells (30). Thus, sphingolipid signaling appears to regulate the uPA system through several mechanisms.
In summary, we have shown that SphK1 maintains basal levels of glioma cell invasiveness at least partially through the uPA system, and that S1P receptor signaling further enhances glioma cell invasion through induction of CCN1 and elements of the uPA system.
Materials and methods
Materials
Sphingosine and S1P were from Avanti Polar Lipids (Alabaster, AL). Cell culture medium and fetal bovine serum were from Mediatech (Herndon, VA). Gelatin was from BioRad (Hercules, CA). Matrigel was from Becton Dickinson (Palo Alto, CA). Antibodies to CCN1, GAPDH, and p-JNK were from Santa Cruz Biotechnology (Santa Cruz, CA). Antibody to uPAR was from R&D Systems (Minneapolis, MN). Antibody to uPA was from American Diagnostica (Stamford, CT). Sphingosine kinase inhibitor was from Calbiochem (San Diego, CA). Fatty acid-free BSA, human fibrinogen and plasminogen and Protein G beads were from Sigma-Aldrich (St. Louis, MO).
Cell culture
All cell lines used in this study were maintained in Eagle’s minimum essential medium (EMEM) containing 10% fetal bovine serum, non-essential amino acids and sodium pyruvate. The cells were grown at 37°C in 95% air, 5% CO2 and cultures were passaged approximately once per week at a ratio of 1:12. EMEM containing 0.1% fatty acid-free BSA (E-BSA) was used for S1P media preparation. Sphingosine kinase inhibitor (Calbiochem) treatment consisted of adding 1 µg/mL to serum free EMEM. Equal volumes of dimethyl sulphoxide, DMSO, (Sigma-Aldrich) were used as a vehicle control.
Creation of stable cell lines used in this study was previously described (9). Briefly, U-118 MG and A172 cells were transfected with pcDNA3.0 plasmid (Invitrogen, Carlsbad CA) containing the open reading frame of S1P receptor subtype 1, 2, or 3 and stable cell lines were selected with Geneticin (Invitrogen). Individual colonies were isolated, grown, and S1P receptor expression was quantitated by real time RT-PCR analysis as described previously (9). Clones used in this study overexpressed individual S1P receptor subtypes at similar levels. Expression of S1P receptors other than the transfected subtypes was not affected. U-118 clones were also transfected with SphK1 expression construct in pcDNA3.1-hygro or vector alone and stable pooled cells were selected with hygromycin.
Western blotting
Cells were grown to approximately 85–90% confluence and starved overnight. After 24 hours in 100 nM S1P or 1 µg/mL sphingosine kinase inhibitor, cells were lysed in 25 mM Hepes (pH 7.5), 150 mM NaCl, 10 mM MgCl2, 0.2 EDTA, 1% Triton X-100, 0.1% SDS, 0.5% deoxycholate, 0.2 mM PMSF, and 10 µg/ml each of aprotinin and leupeptin. uPAR samples were collected under nonreducing conditions while all others were reduced. All samples were boiled and equal amounts of protein were separated by SDS-PAGE before being transferred to nitrocellulose membranes. Membranes were blocked for 1 h at room temperature in PBS + 0.1% Tween-20 (PBS-T) containing 5% (w/v) non-fat dry milk. Membranes were probed overnight with primary antibodies according to manufacturer’s instructions and washed 5 × 5 min with PBS-T, followed by incubation for 2 h at room temperature with goat anti-mouse IgG or goat anti-rabbit IgG conjugated to horseradish peroxidase (1:10,000 in blocking solution). Membranes were washed as above, followed by incubation in Pierce Super Signal West Pico chemiluminescent substrate. Pierce Super Signal West Fempto chemiluminescent substrate was used for uPAR detection. Bands were visualized by exposure to x-ray film. Quantitation of band density and conversion to optical density values was performed using NIH ImageJ 1.37v software (31).
Zymographic analysis
The enzymatic activity of uPA was examined by zymographic analysis measuring fibrin degradation in 9% SDS-PAGE gels essentially as described (32). Briefly, cells were grown to approximately 85–90% confluence and starved overnight in 6-well plates. Sphingosine kinase inhibitor (1 µg/mL) or 100 nM S1P was added to 1 mL E-BSA in the indicated wells. After 24 hours, supernatants were collected and combined with reducing loading buffer in the equivalent of 25 µg cellular lysate. The samples were then loaded onto gels containing 730 µg/mL purified human fibrinogen (Sigma-Aldrich) and 20 µg/mL purified human plasminogen (Sigma-Aldrich), added prior to gel polymerization. After electrophoresis, gels were rinsed twice in distilled water and washed twice for 30 minutes in 150 mL 2.5% Triton X-100 to remove SDS. The gels were then incubated in 150 mL 0.1 M Glycine, pH 8.0 for 16 hours at 37°C with agitation. After washing in distilled water as above, gels were stained in 0.25% Coomasie Brilliant Blue in 50% MeOH and 9% acetic acid for 2 hours at room temperature with agitation. Gels were destained with agitation in 150 mL 30% MeOH and 10% acetic acid twice for 25 minutes. Zones of lysis appeared as clear areas against the uniform background of stained fibrinogen and were compared to parallel lanes of molecular weight standards to determine the 55 kDa band that corresponds to uPA molecular weight. Quantitation of negative image band density and conversion to optical density values was performed using NIH ImageJ 1.37v software.
Additionally, uPA activity was distinguished from plasminolysis or nonspecific proteolysis by comparing lysis zones obtained on plasminogen-fibrinogen gels with those obtained on plasminogen-free fibrinogen gels. Specific uPA lysis at this molecular weight was then further confirmed by comparing lysis zones of supernatants immunoprecipitated by uPA antibody with the remaining, immunodepleted supernatants. Briefly, Protein G bead resins were prepared according to manufacturer’s protocol (Sigma-Aldrich) and used to preclear supernatants. Immunoprecipitation with 10 µg uPA antibody and Protein G bead resins was carried out at 4°C with agitation. Immunodepleted supernatants were removed after centrifugation and immunoprecipitates were resuspended in nonreducing loading buffer. Samples were washed, vortexed and heated to detach proteins from beads before loading onto gels.
Sphingosine Kinase Assay
Sphingosine kinase activity was measured as described (33) with minor modifications. Briefly, cells were scraped into sphingosine kinase buffer (200 mM Tris, pH 7.4, 20% glycerol, 10 mM MgCl2, 1 mM β-mercaptoethanol, 1 mM EDTA, 10 µg/ml leupeptin and aprotinin, 1 mM phenylmethylsulfonylfluoride, 15 mM NaF, 1 mM sodium orthovanadate, 40 mM β-glycerophosphate, and 0.5 mM deoxypyridoxine) and lysed by freeze/thawing seven times. Equal amounts of protein were assayed in the presence of 50 µM sphingosine and 1 mM ATP containing 10 µCi [γ-32P]ATP for one hour at 37°C. Labeled S1P was separated by thin layer chromatography (TLC) on Silica gel G60 plates with CHCl3/Acetone/MeOH/Acetic Acid/water (10/4/3/2/1), and visualized by autoradiography. Radioactive spots were scraped from TLC plates and quantified by scintillation counting.
Cellular Viability Assay
Cells were grown to approximately 85–90% confluence and starved overnight. Cells were then treated with DMSO, 1 µg/mL sphingosine kinase inhibitor, or serum free EMEM alone and trypsinized at the indicated time points. Cellular viability was determined as 1:1 mixes of trypsinized cells in 0.4% trypan blue were added to a hemocytometer and four random fields were examined. Averages of viable, clear cells and blue, dead cells were then determined. Viability was quantitated as a percentage of clear cells to the total number of cells.
Spheroid Invasion Assay
Cells were grown to approximately 85–90% confluence in cell culture flasks and plated as inverted droplets as previously described (9, 26) with modifications. Briefly, 50,000 cells per 25 µl were spotted on the lid of a 100 cm tissue culture dish in EMEM and grown inverted on the dish for 2 days. Matrigel preparations were prepared in parallel just prior to spheroid plating and included antibody, S1P, and sphingosine kinase inhibitor mixes. All Matrigel mixes were cooled 1:3 mixes of Matrigel (Becton Dickinson) to serum free media and were kept on ice prior to plating. Antibody mixes consisted of 20 µg/mL of either anti-uPA, anti-CCN1 or anti-p-JNK as an isotype matched control antibody. Additionally, E-BSA media with 100 nM S1P or serum free media with or without 1 µg/mL of sphingosine kinase inhibitor was added to 1:3 Matrigel mixes where indicated. Spheroids were then removed and added to 40 µl of polymerized Matrigel mix in a 96-well plate. This was covered by an additional 40 µl Matrigel mix, which was allowed to polymerize for 30 min at 37°C. The Matrigel-spheroid–Matrigel sandwich was then supplemented with serum-free media. S1P Matrigel media mix was supplemented with additional S1P approximately every 36 hours. Pictures were taken at time points shown using indicated microscope objectives and analyzed NIH ImageJ 1.37v software. Measurements of core and invasive diameter were done using this software and exported to Microsoft Excel for further analysis according to models previously characterized (34).
Acknowledgments
Grant Support: This work was supported by Grant # R01 NS41517 from the National Institute of Neurological Disorders and Stroke (NINDS) to JRVB and by the Department of Pathology, The Ohio State University.
References
- 1.Sathornsumetee S, Rich JN. New treatment strategies for malignant gliomas. Expert Rev Anticancer Ther. 2006;6:1087–1104. doi: 10.1586/14737140.6.7.1087. [DOI] [PubMed] [Google Scholar]
- 2.Spiegel S, Milstien S. Sphingosine-1-phosphate: an enigmatic signalling lipid. Nat. Rev. Mol. Cell Biol. 2003;4:397–407. doi: 10.1038/nrm1103. [DOI] [PubMed] [Google Scholar]
- 3.Hla T. Physiological and pathological actions of sphingosine 1-phosphate. Semin. Cell Dev. Biol. 2004;15:513–520. doi: 10.1016/j.semcdb.2004.05.002. [DOI] [PubMed] [Google Scholar]
- 4.Young N, Van Brocklyn JR. Signal transduction of sphingosine-1-phosphate G protein-coupled receptors. ScientificWorldJournal. 2006;6:946–966. doi: 10.1100/tsw.2006.182. [DOI] [PMC free article] [PubMed] [Google Scholar]
- 5.Spiegel S, Milstien S. Exogenous and intracellularly generated sphingosine 1-phosphate can regulate cellular processes by divergent pathways. Biochem. Soc. Trans. 2003;31:1216–1219. doi: 10.1042/bst0311216. [DOI] [PubMed] [Google Scholar]
- 6.Van Brocklyn JR, Young N, Roof R. Sphingosine-1-phosphate stimulates motility and invasiveness of human glioblastoma multiforme cells. Cancer Lett. 2003;199:53–60. doi: 10.1016/s0304-3835(03)00334-3. [DOI] [PubMed] [Google Scholar]
- 7.Van Brocklyn JR, Letterle CA, Snyder PJ, Prior TW. Sphingosine-1-phosphate stimulates human glioma cell proliferation through Gi-coupled receptors: Role of ERK MAP kinase and phosphatidylinositol 3-kinase β. Cancer Lett. 2002;181:195–204. doi: 10.1016/s0304-3835(02)00050-2. [DOI] [PubMed] [Google Scholar]
- 8.Van Brocklyn JR, Jackson CA, Pearl DK, Kotur MS, Snyder PJ, Prior TW. Sphingosine kinase-1 expression correlates with poor survival of patients with glioblastoma multiforme: roles of sphingosine kinase isoforms in growth of glioblastoma cell lines. J Neuropathol Exp Neurol. 2005;64:695–705. doi: 10.1097/01.jnen.0000175329.59092.2c. [DOI] [PubMed] [Google Scholar]
- 9.Young N, Van Brocklyn JR. Roles of sphingosine-1-phosphate (S1P) receptors in malignant behavior of glioma cells. Differential effects of S1P2 on cell migration and invasiveness. Exp. Cell Res. 2007;313:1615–1627. doi: 10.1016/j.yexcr.2007.02.009. [DOI] [PMC free article] [PubMed] [Google Scholar]
- 10.Leu SJ, Lam SC, Lau LF. Pro-angiogenic activities of CYR61 (CCN1) mediated through integrins alphavbeta3 and alpha6beta1 in human umbilical vein endothelial cells. J Biol Chem. 2002;277:46248–46255. doi: 10.1074/jbc.M209288200. [DOI] [PubMed] [Google Scholar]
- 11.Chen N, Leu SJ, Todorovic V, Lam SC, Lau LF. Identification of a novel integrin alphavbeta3 binding site in CCN1 (CYR61) critical for pro-angiogenic activities in vascular endothelial cells. J Biol Chem. 2004;279:44166–44176. doi: 10.1074/jbc.M406813200. [DOI] [PubMed] [Google Scholar]
- 12.Leask A, Abraham DJ. All in the CCN family: essential matricellular signaling modulators emerge from the bunker. J Cell Sci. 2006;119:4803–4810. doi: 10.1242/jcs.03270. [DOI] [PubMed] [Google Scholar]
- 13.Xie D, Yin D, Wang HJ, et al. Levels of expression of CYR61 and CTGF are prognostic for tumor progression and survival of individuals with gliomas. Clin. Cancer Res. 2004;10:2072–2081. doi: 10.1158/1078-0432.ccr-0659-03. [DOI] [PubMed] [Google Scholar]
- 14.Xie D, Yin D, Tong X, et al. Cyr61 Is overexpressed in gliomas and involved in integrin-linked kinase-mediated Akt and β-Catenin-TCF/Lef signaling pathways. Cancer Res. 2004;64:1987–1996. doi: 10.1158/0008-5472.can-03-0666. [DOI] [PubMed] [Google Scholar]
- 15.Natarajan J, Berrar D, Dubitzky W, et al. Text mining of full-text journal articles combined with gene expression analysis reveals a relationship between sphingosine-1-phosphate and invasiveness of a glioblastoma cell line. BMC Bioinformatics. 2006;7:373. doi: 10.1186/1471-2105-7-373. [DOI] [PMC free article] [PubMed] [Google Scholar]
- 16.Andreasen PA, Kjoller L, Christensen L, Duffy MJ. The urokinase-type plasminogen activator system in cancer metastasis: a review. Int. J. Cancer. 1997;72:1–22. doi: 10.1002/(sici)1097-0215(19970703)72:1<1::aid-ijc1>3.0.co;2-z. [DOI] [PubMed] [Google Scholar]
- 17.Sidenius N, Blasi F. The urokinase plasminogen activator system in cancer: recent advances and implication for prognosis and therapy. Cancer Metastasis Rev. 2003;22:205–222. doi: 10.1023/a:1023099415940. [DOI] [PubMed] [Google Scholar]
- 18.Lakka SS, Gondi CS, Dinh DH, et al. Specific interference of urokinase-type plasminogen activator receptor and matrix metalloproteinase-9 gene expression induced by double-stranded RNA results in decreased invasion, tumor growth, and angiogenesis in gliomas. J Biol Chem. 2005;280:21882–21892. doi: 10.1074/jbc.M408520200. [DOI] [PubMed] [Google Scholar]
- 19.Blasi F, Carmeliet P. uPAR: a versatile signalling orchestrator. Nat Rev Mol Cell Biol. 2002;3:932–943. doi: 10.1038/nrm977. [DOI] [PubMed] [Google Scholar]
- 20.van der Pluijm G, Sijmons B, Vloedgraven H, et al. Urokinase-receptor/integrin complexes are functionally involved in adhesion and progression of human breast cancer in vivo. Am J Pathol. 2001;159:971–982. doi: 10.1016/S0002-9440(10)61773-7. [DOI] [PMC free article] [PubMed] [Google Scholar]
- 21.Mohanam S, Gladson CL, Rao CN, Rao JS. Biological significance of the expression of urokinase-type plasminogen activator receptors (uPARs) in brain tumors. Front Biosci. 1999;4:D178–D187. doi: 10.2741/mohanam. [DOI] [PubMed] [Google Scholar]
- 22.Gondi CS, Lakka SS, Yanamandra N, et al. Expression of antisense uPAR and antisense uPA from a bicistronic adenoviral construct inhibits glioma cell invasion, tumor growth, and angiogenesis. Oncogene. 2003;22:5967–5975. doi: 10.1038/sj.onc.1206535. [DOI] [PubMed] [Google Scholar]
- 23.Gondi CS, Lakka SS, Yanamandra N, et al. Adenovirus-mediated expression of antisense urokinase plasminogen activator receptor and antisense cathepsin B inhibits tumor growth, invasion, and angiogenesis in gliomas. Cancer Res. 2004;64:4069–4077. doi: 10.1158/0008-5472.CAN-04-1243. [DOI] [PubMed] [Google Scholar]
- 24.Crippa MP. Urokinase-type plasminogen activator. Int. J. Biochem. Cell Biol. 2007;39:690–694. doi: 10.1016/j.biocel.2006.10.008. [DOI] [PubMed] [Google Scholar]
- 25.French KJ, Schrecengost RS, Lee BD, et al. Discovery and evaluation of inhibitors of human sphingosine kinase. Cancer Res. 2003;63:5962–2969. [PubMed] [Google Scholar]
- 26.Del Duca D, Werbowetski T, Del Maestro RF. Spheroid preparation from hanging drops: characterization of a model of brain tumor invasion. J. Neurooncol. 2004;67:295–303. doi: 10.1023/b:neon.0000024220.07063.70. [DOI] [PubMed] [Google Scholar]
- 27.Brigstock DR. The connective tissue growth factor/cysteine-rich 61/nephroblastoma overexpressed (CCN) family. Endocr. Rev. 1999;20:189–206. doi: 10.1210/edrv.20.2.0360. [DOI] [PubMed] [Google Scholar]
- 28.Windh RT, Lee MJ, Hla T, An S, Barr AJ, Manning DR. Differential coupling of the sphingosine 1-phosphate receptors Edg-1, Edg-3, and H218/Edg-5 to the Gi, Gq, and G12 families of heterotrimeric G proteins. J. Biol. Chem. 1999;274:27351–27358. doi: 10.1074/jbc.274.39.27351. [DOI] [PubMed] [Google Scholar]
- 29.Maupas-Schwalm F, Auge N, Robinet C, et al. The sphingomyelin/ceramide pathway is involved in ERK1/2 phosphorylation, cell proliferation, and uPAR overexpression induced by tissue-type plasminogen activator. FASEB J. 2004 doi: 10.1096/fj.03-1123fje. [DOI] [PubMed] [Google Scholar]
- 30.Paugh BS, Paugh SW, Bryan L, et al. EGF regulates plasminogen activator inhibitor-1 (PAI-1) by a pathway involving c-Src, PKCdelta, and sphingosine kinase 1 in glioblastoma cells. Faseb J. 2008;22:455–465. doi: 10.1096/fj.07-8276com. [DOI] [PMC free article] [PubMed] [Google Scholar]
- 31.Girish V, Vijayalakshmi A. Affordable image analysis using NIH Image/ImageJ. Indian J. Cancer. 2004;41:47. [PubMed] [Google Scholar]
- 32.Mohanam S, Chintala SK, Go Y, et al. In vitro inhibition of human glioblastoma cell line invasiveness by antisense uPA receptor. Oncogene. 1997;14:1351–1359. doi: 10.1038/sj.onc.1200963. [DOI] [PubMed] [Google Scholar]
- 33.Kohama T, Olivera A, Edsall L, Nagiec MM, Dickson R, Spiegel S. Molecular cloning and functional characterization of murine sphingosine kinase. J. Biol. Chem. 1998;273:23722–23728. doi: 10.1074/jbc.273.37.23722. [DOI] [PubMed] [Google Scholar]
- 34.Stein AM, Demuth T, Mobley D, Berens M, Sander LM. A mathematical model of glioblastoma tumor spheroid invasion in a three-dimensional in vitro experiment. Biophys J. 2007;92:356–365. doi: 10.1529/biophysj.106.093468. [DOI] [PMC free article] [PubMed] [Google Scholar]


