

Abstract
Influenza virus hemagglutinin (HA) has been suggested to be enriched in liquid-ordered lipid domains named rafts, which represent an important step in virus assembly. We employed Förster resonance energy transfer (FRET) via fluorescence lifetime imaging microscopy to study the interaction of the cytoplasmic and transmembrane domain (TMD) of HA with agly co sylphos pha tidyl ino si tol (GPI)-anchored peptide, an established marker for rafts in the exoplasmic leaflet of living mammalian plasma membranes. Cyan fluorescent protein (CFP) was fused to GPI, whereas the HA sequence was tagged with yellow fluorescent protein (YFP) on its exoplasmic site (TMD-HA-YFP), avoiding any interference of fluorescent proteins with the proposed role of the cytoplasmic domain in lateral organization of HA. Constructs were expressed in Chinese hamster ovary cells (CHO-K1) for which cholesterol-sensitive lipid nanodomains and their dimension in the plasma membrane have been described (Sharma, P., Varma, R., Sarasij, R. C., Ira, Gousset, K., Krishnamoorthy, G., Rao, M., and Mayor, S. (2004) Cell 116, 577–589). Upon transfection in CHO-K1 cells, TMD-HA-YFP is partially expressed as a dimer. Only dimers are targeted to the plasma membrane. Clustering of TMD-HA-YFP with GPI-CFP was observed and shown to be reduced upon cholesterol depletion, a treatment known to disrupt rafts. No indication for association of TMD-HA-YFP with GPI-CFP was found when palmitoylation, an important determinant of raft targeting, was suppressed. Clustering of TMD-HA-YFP and GPI-CFP was also observed in purified plasma membrane suspensions by homoFRET. We concluded that the pal mit oy lated TMD-HA alone is sufficient to recruit HA to cholesterol-sensitive nanodomains. The corresponding construct of the spike protein E2 of Semliki Forest virus did not partition preferentially in such domains.
Assembly of enveloped viruses requires the selective recruitment of viral components at distinct sites of the host cell membranes from which viruses bud. One of the most intensely studied enveloped viruses with respect to assembly is the influenza virus, in which budding takes place at the plasma membrane of epithelial cells. Three membrane proteins are embedded in the influenza virus envelope: hemagglutinin (HA),3 which mediates binding of the virus to the host cell and fusion with cell target membrane (1); neuraminidase; and the proton channel M2. The inner viral membrane leaflet is covered by the matrix protein M1, which is supposed to mediate binding of the eight viral RNA-nucleoprotein complexes harboring the genetic information of the virus. Several studies support a role of lipid domains as a platform for enrichment of viral components. HA, the most abundant envelope protein of the influenza virus, has been found to be enriched in detergent-resistant membrane (DRM) fractions (2–4). Typical lipid components of those fractions are saturated phospholipids, glycosphingolipids, and cholesterol, which are known to form liquid-ordered domains (5). This has led to the idea that so-called lipid rafts, which resemble liquid-ordered domains, could function as assembly sites. Support for this hypothesis was given by the observation that the lipid composition of the influenza virus envelope is more similar to that of a raft than to the overall plasma membrane (2, 6).
As it has been shown that DRM fractions may not represent the native state of lipid domains, in particular of rafts (7, 8), subsequent efforts have focused on other techniques to assess the lateral organization of HA. Electron microscopy studies using immunogold labeling (4, 9), Förster resonance energy transfer (FRET) measurements between fluorescent HA antibodies in fixed cells (9), and investigations on photoactivatable HA in living cells (10) have revealed cholesterol-sensitive clustering of HA in the plasma membrane of mammalian cells at lengths between 20 and 900 nm.
A specific problem encountered in studying the lateral organization of proteins in the plasma membrane is that lipid domains as rafts are typically organized at a submicroscopic level. Indeed, several attempts to image raft domains in biological membranes have suggested that rafts are very small and highly dynamic (11, 12). A guiding study in the characterization of lipid domains in biological membranes has been performed by Mayor and colleagues (13) on the plasma membrane of CHO-K1 cells. Based on homoFRET measurements they have shown that about 20–40% of GFP-tagged glycosylphosphatidylinositol (GPI) (for review see Brown and Rose (14)) and other GPI-anchored proteins are organized with about three to four copies in small cholesterol-sensitive clusters. Mathematical modeling of those experimental data is consistent with a domain diameter of about 5 nm (13).
In the present study we investigated the lateral organization of the C terminus of HA, corresponding to the transmembrane domain (TMD), and the cytoplasmic tail (CT) of the protein in the plasma membrane of CHO-K1 cells, taking advantage of the well characterized spatial arrangement of the raft marker GPI in those cells (see above). Lateral organization was studied essentially by fluorescence lifetime imaging microscopy (FLIM)-based FRET between CFP (donor) and YFP (acceptor). For this purpose, we replaced the ectodomain of HA by YFP and studied FRET between this construct and GPI-CFP. As a complementary approach, we performed ensemble measurements in suspensions of plasma membranes purified from cells expressing fluorescent GPI and HA constructs. We measured homoFRET by time-resolved fluorescence anisotropy, providing information on the aggregation/clustering state of the fluorescent constructs, which is important in rationalizing the FLIM-FRET data.
EXPERIMENTAL PROCEDURES
TMD-HA and Raft Marker Constructs
The sequence TMD-HA consisting of the TMD and CT as well as 38 amino acid of the ectodomain of HA from A/FPV/Rostock/34 (H7N1) corresponding to ASIRNNTYDHSKYREEAMQNRIQIDPVKLSGYKDVILWFSFGASCFLLLAIAMGLVFICVKNGNMRCTICI (glycosylation site, single underline; palmitoylation site, double underline; TMD, bold) was tagged on its N terminus with YFP (or CFP) and expressed in CHO-K1 cells. Palmitoylation sites were mutated to serine for generation of the non-palmitoylated variant TMD-HAC3S. The raft markers GPI-CFP and GPI-YFP were kindly provided by Patrick Keller (15). To exclude dimerization of fluorescent proteins, constructs with the mutation A206K in the fluorescent proteins (16) were also generated (mCFP, mYFP). For assessment of palmitoylation and endoglycosidase H resistance see the supplemental Experimental Procedures on-line. SFV-E2-mCFP was provided by Bastian Thaa.4
Treatment of Cells
Cells were depleted of cholesterol by treatment with methyl-β-cyclodextrin (MβCD). Depletion was quantified by using [1α,2α(n)-3H]cholesterol. The partition of constructs in DRM was assessed by Western blot after Triton X-100 treatment of cells and centrifugation in sucrose gradient. Plasma membrane extracts were obtained by homogenization of cells and Nycodenz step gradient centrifugation. For more details see the supplemental data. For cytochalasin D treatment, CHO-K1 transfectants were incubated with a 1 μm solution of cytochalasin D at 37 °C for 20 h. Cells were then washed with Dulbecco's modified phosphate-buffered saline and supplied with Dulbecco's modified Eagle's medium without phenol red before measurement (PAN Biotech, Aidenbach, Germany).
Confocal and FLIM-FRET Imaging
Intensity measurements as well as FLIM-FRET measurements were carried out using an inverted FluoView 1000 microscope (Olympus, Tokyo, Japan) equipped with a time-resolved LSM Upgrade kit (PicoQuant, Berlin, Germany) and a ×60 (1.35 numerical aperture) oil immersion objective at 25 °C. Images with a frame size of 512 × 512 pixels were acquired. FLIM was used to study energy transfer between the GPI-CFP raft marker (donor) and the different TMD-HA-YFP variants (acceptor). CFP was excited at 440 nm using a laser diode and detected in the range of 460 to 490 nm. YFP was excited at 515 nm using an argon laser and detected in the range of 535 to 575 nm. The CFP lifetime of cells expressing GPI-CFP only was measured first. The selection of cells coexpressing both proteins was based on fluorescence emission in the CFP and YFP channels after sequential excitation. FLIM images of the donor in the absence and in the presence of acceptor were acquired upon excitation of the donor at 440 nm. Fluorescence intensities were analyzed by the ImageJ analysis program, which enables selection and analysis of the same area for pictures taken sequentially. For FLIM measurements, CFP was excited at 440 nm using a pulsed laser diode. Fluorescence was detected by a single photon avalanche photodiode (SPAD) and a 470 ± 15 nm bandpass filter. Electrical signals were processed by using the TimeHarp 200 PC card. Analysis of FLIM images was performed using SymPhoTime software (PicoQuant), taking into account the instrument response function. FLIM pictures were accumulated for 90 s (60 frames with an average photon count rate of ∼2–4 × 10⁴ counts/s), and the plasma membrane was analyzed selectively. The measured photons-per-pixels corresponding to the plasma membrane were combined into a decay curve that was further analyzed by fitting it using a nonlinear least squares iterative procedure as the sum of two exponential terms. This kind of fitting is required because fluorescent proteins variants are known to show a multiple exponential decay (17). For every single cell the average lifetime of CFP was calculated using the following equation (17).
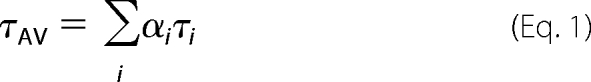 |
Quality of fits was judged by the distribution of the residuals and the χ2 value.
The efficiency of FRET (E) was calculated using the equation,
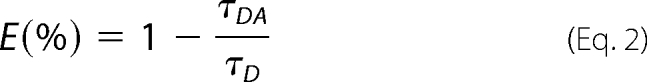 |
where τDA is the average lifetime of the donor in the presence of the acceptor and τD is the average lifetime of the donor expressed alone.
The FRET efficiency (E) of every cell coexpressing donor and acceptor was plotted against the fluorescence intensity of the acceptor (FYFP) in this cell. The data points were fitted according to the equation,
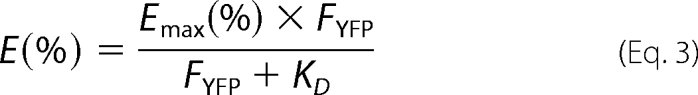 |
assuming that E is a hyperbolic function of the amount of acceptor. Emax (in %) is the maximal FRET efficiency calculated from the fitting (16). Equation 3 provides a dissociation constant (KD) as a parameter to assess the associative properties of donor and acceptor (see Table 1).
TABLE 1.
Fluorescence intensity and anisotropy decay parameters
Parameters describing the fluorescence intensity decay of purified plasma membrane suspensions from CHO cells expressing GPI-mCFP, untreated (−MβCD) or treated with MβCD (+MβCD) to extract cholesterol. αn, amplitude; τn, lifetime; τD, amplitude-averaged fluorescence lifetime; χ2tot, global chi square. The rotational correlation times (ϕ1and ϕ2) retrieved from the fluorescence anisotropy decays and the steady-state fluorescence anisotropy 〈r〉 are also shown. The last line refers to the donor-acceptor pair GPI-mCFP + TMD-HA-mYFP. ND, not determined.
| Sample | α1 | τ1 | α2 | τ2 | α3 | τ3 | τD | χ2 | ϕ1 | ϕ2 | χ2tot | 〈r〉 |
|---|---|---|---|---|---|---|---|---|---|---|---|---|
| ns | ns | ns | ns | ns | ns | |||||||
| −MβCD | 0.19 | 0.63 | 0.33 | 1.92 | 0.48 | 3.64 | 2.50 | 1.09 | 1.16 | 33 | 1.20 | 0.33 |
| +MβCD | 0.16 | 0.58 | 0.35 | 1.83 | 0.49 | 3.63 | 2.51 | 1.17 | ND | 32 | 1.23 | 0.34 |
| +TMD-HA- mYFP | 0.24 | 0.40 | 0.31 | 1.51 | 0.25 | 3.78 | 2.27 | 1.21 | ND | ND | ND | ND |
Measuring Protein Expression in the Plasma Membrane
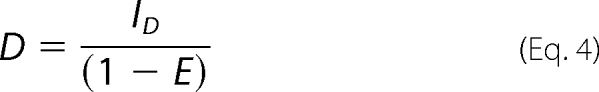
TMD-HA protein expression levels were monitored by measuring the fluorescence intensity of proteins at the plasma membrane. Confocal images were collected after sequential excitation of CFP and YFP, keeping all measurement conditions constant, and plasma membrane fluorescence intensity was analyzed. The mean intensity of the acceptor was taken as a measure for the amount of acceptor expressed after subtraction of the background. The amount of unquenched donor in the plasma membrane of cells expressing both acceptor and donor was determined correcting the measured donor intensity (ID) for the fluorescence decrease of the donor due to FRET. To estimate the efficiency of energy transfer (E) for every single cell, the average lifetime of a cell coexpressing donor and acceptor and the mean average lifetime of 10 cells expressing the donor alone were used. The unquenched donor amount (D) is then calculated as follows.
 |
Steady-state and Time-resolved Fluorescence Spectroscopy
The steady-state and time-resolved fluorescence instrumentation is the same as described previously (18). For steady-state fluorescence anisotropy measurements on purified plasma membrane suspensions at 25 °C, excitation and emission wavelengths were 435 and 477 nm for CFP and 515 and 535 nm for YFP, respectively (for protein concentrations, see Table 2). Fluorescence intensity and anisotropy decay curves were obtained by the single-photon timing technique. The excitation and emission wavelengths were 415 and 460–490 nm, respectively (CFP channel), or 490 and 520–560 nm (YFP channel). For fluorescence anisotropy decay collection and analysis see De Almeida et al. (18). Both fluorescence intensity and anisotropy decay were analyzed with TRFA software (Scientific Software Technologies Center, Minsk, Belarus). Based on the rates of fluorescence anisotropy decay due to homoFRET, the distance R between fluorophores was calculated according to Gautier et al. (19) and Tanaka and Mataga (20), as described in Sharma et al. (13), as follows.
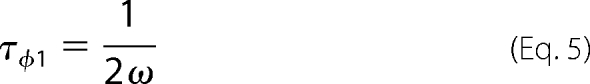 |
with
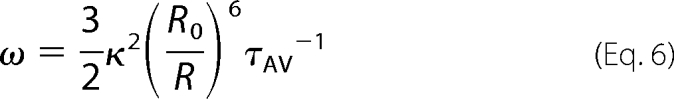 |
where τϕ1 is the short rotational correlation time (see “Results”), κ2 = ⅔, and R0 is the Förster radius (obtained from Patterson et al. (21)).
RESULTS
Characterization of TMD-HA-YFP
To study the lateral organization of the HA transmembrane domain with the cytoplasmic tail, we fused the N terminus of this sequence with the C terminus of YFP, replacing essentially the HA ectodomain. This construct was not delivered to the plasma membrane of CHO-K1 cells (not shown). However, upon fusion of the HA signal peptide to the N terminus of the fluorophore (Fig. 1), TMD-HA-YFP and TMD-HAC3S-YFP were transported to the plasma membrane (Fig. 2, A and B). The constructs contain a short sequence of the HA ectodomain bearing a potential glycosylation site (NNT). Apart from monomers, the constructs formed stable dimers (supplemental Fig. 1A). We could not detect any difference between constructs with wild type (CFP, YFP) and those with mutated fluorescent proteins (mCFP, mYFP), preventing any potential dimerization of fluorescent proteins (see below and “Experimental Procedures”). Endoglycosidase H digestion (supplemental Fig. 1B) reveals that TMD-HA dimers, but not monomers, acquire endoglycosidase H-resistant carbohydrates, a modification that occurs during the transport of proteins through the Golgi complex to the plasma membrane (22). Hence, only the dimeric form of TMD-HA is transported to the plasma membrane. Labeling of the protein with [3H]palmitate confirmed palmitoylation of the TMD-HA-YFP and the lack of palmitic acid attachment to TMD-HAC3S-YFP (supplemental Fig. 1C) (23). Triton X-100 extraction revealed the partition of TMD-HA-YFP to DRM fractions similar to that known for full-length HA (4, 24) (supplemental Fig. 1D). In contrast, TMD-HAC3S-YFP did not localize at all to those fractions, confirming that palmitoylation is an important signal for DRM partition. To compare the results obtained from different cells, we routinely verified that the protein amount in the plasma membrane was comparable among the different experiments. TMD-HA expression levels were monitored by measuring the fluorescence intensity of the proteins at the plasma membrane. Fig. 3 shows that the mean intensity ratio between donor and acceptor (D/A ratio) is similar among different donor and acceptor pairs. Hence, FRET efficiencies for different combinations of donor-acceptor pairs could be compared directly.
FIGURE 1.

Structure of TMD-HA-YFP and TMD-HAC3S-YFP. TMD-HA and TMD-HAC3S (C3S indicates the mutation of cysteines 551, 559, and 562 to serine) correspond to the sequence of the HA gene from influenza virus strain A/FPV/Rostock/34 (H7N1) and to the same sequence mutated at acylation positions 551, 559, and 562, respectively. SP, signal peptide; EctoSeq, 38-amino acid-long sequence of the HA ectodomain proximal to transmembrane domain; Palm, palmitoylation of cysteines (C); S, serine; *, glycosylation site.
FIGURE 2.

Characterization of expression and fluorescence lifetime of TMD-HA-YFP and TMD-HAC3S-YFP. A and B, localization of TMD-HA constructs at the plasma membrane of CHO-K1 cells. Confocal images of TMD-HA-YFP (A) and TMD-HAC3S-YFP (B) are shown. C and D, lifetime images of a cell expressing GPI-CFP (C) and a cell coexpressing GPI-CFP and TMD-HA-YFP (D). E and F, selected region of interest (plasma membrane) of the cells shown in C and D, respectively. The pseudocolor scale refers to the average lifetime. Images were taken at 25 °C.
FIGURE 3.

Quantification of construct expression at the plasma membrane. Intensity ratio of donor to acceptor (D/A) for various combinations of constructs. GPI-CFP, GPI-mCFP, and GPI-YFP are raft markers; TMD-HA-YFP, TMD-HA-mYFP, TMD-HA-CFP, TMD-HA-mCFP, and TMD-HAC3S-YFP are different TMD-HA variants. m, A206K mutation preventing any potential of dimerization; C3S, mutation of cysteines 551, 559, and 562 to serine. SFV-E2-mCFP is the non-raft protein based on the Semliki Forest virus E2 spike protein (see supplemental “Experimental Procedures” and under “FLIM-FRET Experiments with the Transmembrane Domain SFV-E2-mCFP Fusion Protein.”). Intensities were measured at 25 °C. Data represent the mean ± S.E.
FLIM-FRET Experiments
FLIM was used to study FRET between the raft marker GPI-CFP and TMD-HA-YFP variants. In Fig. 4 typical donor lifetimes for various donor-acceptor pairs are shown. Each graph refers to an independent set of experiments. Each set was done on the same day, and each point refers to a single cell. Although we found variations in lifetimes among sets, these values were highly reproducible within the same set of experiments. An unpaired t test was performed to assess statistical significance (see p values in legends to Figs. 4 and 5). The average donor lifetimes of cells expressing only GPI-CFP vary within a given range, which does not significantly overlap with the shorter average lifetimes of donor-acceptor coexpressing cells. To exclude the possibility that any FRET was the result of dimerization of the fluorophores, we also studied constructs with the mutation A206K of CFP and YFP, known to prevent any direct interaction between fluorescent proteins (16). Again, we could not detect any difference in FRET between constructs with wild type (CFP, YFP) and mutated fluorescent proteins (mCFP, mYFP) (Figs. 4 and 5). Therefore, although the results with both forms of fluorescent proteins are shown in Figs. 4 and 5, we will not distinguish further between them in this section.
FIGURE 4.

Fluorescence lifetime of GPI-CFP and TMD-HA-YFP constructs. A, average lifetimes (τAV) of cells expressing GPI-CFP alone or coexpressing GPI-CFP and different TMD-HA variants. B, comparison of lifetimes τAV between GPI-CFP and GPI-mCFP. Cells expressing the raft marker alone (GPI-CFP, GPI-mCFP) or coexpressing the raft marker with various TMD-HA constructs are shown. C, average lifetimes (τAV) of cells expressing GPI-mCFP alone or coexpressing GPI-mCFP and Lyn-mYFP. m, mutated form (mutation of CFP A206K); MβCD, after pretreatment with MβCD; Lyn, lipid anchor. Each graph refers to an independent set of experiments. Each set was done on the same day, and each point refers to a single cell. Data represent the mean ± S.E. ***, p < 0.0001. Measurements were taken at 25 °C.
FIGURE 5.

Interaction between GPI and TMD-HA constructs measured by FLIM-FRET. FRET efficiency between raft markers (A), between raft marker and different TMD-HA variants (B), and between the non-raft marker SFV-E2-mCFP and either GPI-YFP or TMD-HA-mYFP (C). MβCD, after pretreatment with MβCD. Above the bars, n refers to the number of independent experiments is given. Each experiment is based on 10 cells. Data represent the mean ± S.E. ***, p < 0.0001; **, p < 0.005. Experiments were carried out at 25 °C.
First, we verified that GPI-anchored fluorescent proteins are raft-associated. The lifetime of GPI-CFP in the plasma membrane was significantly shorter when the protein was coexpressed with the acceptor GPI-YFP, due to FRET (Fig. 5A). To disrupt rafts, plasma membranes were depleted of cholesterol by preincubating the cells with MβCD. Under our conditions, 12 ± 3% (n = 2, in duplicates) of the cholesterol was extracted from the cells. Cholesterol depletion led to a reduced FRET efficiency (Fig. 5A), confirming that GPI-CFP localizes to rafts (13, 14, 25).
Coexpression of GPI-CFP with TMD-HA-YFP led to a significant shortening of donor lifetime (Fig. 4A) as evident from typical FLIM images for a cell expressing donor only (Fig. 2, C and E) and a cell expressing both donor and acceptor (Fig. 2, D and F). This could be attributed to FRET, which was about 10%. For each experiment the mean average lifetime of 10 cells was taken, and the FRET efficiency was calculated. In Fig. 5B the average efficiency is shown.
Upon cholesterol depletion, a decrease of FRET was observed between GPI-CFP and TMD-HA-YFP (Fig. 5B). To probe whether MβCD was extracting GPI-CFP, fluorescence in the supernatant isolated from the treated cells was measured. The fluorescence intensity was in the range of a few percent of the total CFP intensity (not shown) showing that the donor was stably anchored to the membrane. Moreover, CFP lifetime in cells expressing only the donor was not affected by MβCD treatment (2.37 ± 0.02 ns in nontreated cells (n = 14); 2.33 ± 0.02 ns after MβCD treatment (n = 12). Data represent mean ± S.E.).
FLIM data were also analyzed by a model used by Zacharias et al. (16) who have shown that the dependence of the FRET efficiency (E) as a function of the acceptor fluorescence intensity (here FYFP) provides insight into the clustering of donor-acceptor pairs. When E (%) is fitted to a hyperbolic function (as described under “Experimental Procedures”), reflecting a simple saturating binding model of a ligand to its receptor, the relation between FYFP and the dissociation constant KD allowed us to assess the clustering of the probes. KD provides a parameter for the degree of clustering. If FYFP > KD, clustering of acceptor and donor occurs, and FRET is largely independent of acceptor concentration. However, if KD is in the same range of, or even larger than, FYFP, FRET efficiencies are approximately proportional to the acceptor surface densities, reflecting that the donors and acceptors are mutually randomly distributed and FRET is due to random distribution on the cell surface. However, KD values cannot be compared between different experiments (16). When fitting the FRET efficiency for GPI-CFP/TMD-HA-YFP as a function of the acceptor intensity (TMD-HA-YFP) we found FYFP > KD (see Fig. 6, A and B). KD increased 4-fold upon cholesterol depletion, indicating a reduced clustering. A similar observation was made for GPI-CFP/GPI-YFP (see Fig. 6, C and D).
FIGURE 6.

Clustering of TMD-HA-YFP with the raft marker GPI-CFP (A and B) and of the raft marker GPI-CFP with GPI-YFP (C and D). For each CHO cell the calculated FRET efficiency (E) percentage is plotted against the fluorescence intensity of the acceptor, FYFP (TMD-HA-YFP or GPI-YFP). A and B, ○, GPI-CFP/TMD-HA-YFP; *, GPI-mCFP/TMD-HA-mYFP. C and D, ○, GPI-CFP/GPI-YFP; *, GPI-mCFP/GPI-YFP. A and C, control (no cholesterol depletion). B and D, after cholesterol depletion by pretreatment with MβCD (see “Experimental Procedures”). Continuous lines, data were fitted to the saturable one-site binding model (see “Experimental Procedures”). Dissociation constants: A, KD = 94; B, KD = 366; C, KD = 81; D, KD = 475.
Coexpression of GPI-mCFP with a fluorescent raft marker for the inner leaflet of the plasma membrane (Lyn-mYFP) did not lead to any change in the GPI-mCFP lifetime (see Fig. 4C). Therefore, the shortening of the CFP lifetime in the presence of TMD-HA-YFP was not due to coexpression but was due to FRET.
To investigate the role of palmitoylation in lateral organization, GPI-CFP was coexpressed with TMD-HA-C3S-YFP. In that case, the FRET efficiency was only about 2% (Fig. 5B). Depletion of cholesterol did not show any effect on FRET (not shown).
We also observed FRET for the donor-acceptor pair TMD-HA-CFP and GPI-YFP (Fig. 5B), although this was somewhat less pronounced in comparison with the pair GPI-CFP and TMD-HA-YFP. Notably, TMD-HA-CFP lifetime (1.95 ± 0.01 ns, n = 11; mean ± S.E.) was much shorter than that of GPI-CFP when expressed in the absence of the respective acceptors (see Fig. 4, A and B). Thus, CFP molecules of TMD-HA-CFP are in very close proximity and may undergo self-quenching (homoFRET; see below) (26), showing that TMD-HA proteins are organized as dimers in the plasma membrane. Strong support for this conclusion is given by the observation that FRET efficiency between TMD-HA-(m)CFP and TMD-HA-(m)YFP (supplemental Fig. 2A) was much higher than that of the pair GPI-CFP and TMD-HA-YFP. When cells coexpressing TMD-HA-(m)CFP and TMD-HA-(m)YFP were treated with MβCD, no significant decrease in FRET efficiency was observed, indicating that TMD-HA protein clustering occurs independently from the association with lipid microdomains (supplemental Fig. 2A). Finally, pretreatment of cells with the cytoskeleton-disrupting agent cytochalasin D (1 μm) for 20 h at 37 °C did not affect the FRET efficiency between GPI-CFP and TMD-HA-YFP (supplemental Fig. 2B).
FLIM-FRET Experiments with the Transmembrane Domain SFV-E2-mCFP Fusion Protein
Unlike Influenza virus, Semliki Forest virus (SFV) does not appear to utilize lipid rafts as recruitment site of its components (2, 27, 28). No enrichment of viral spike proteins in detergent-resistant fractions was found (2). To produce a protein acting as a non-raft marker, a transmembrane domain based on the SFV glycoprotein E2 was fused to mCFP. Potential palmitoylation sites were replaced to abolish any residual interaction with raft-like lipid domains. FLIM-FRET experiments were carried out in cells coexpressing SFV-E2-mCFP and either TMD-HA-mYFP or GPI-YFP. As shown in Fig. 5C, in both cases no significant energy transfer was detected. Thus, these results indicate that indeed spike proteins of SFV do not associate preferentially with cholesterol-enriched domains, enforcing our hypothesis of a preferential localization of TMD-HA fusion proteins into lipid rafts domains.
Time-resolved Fluorescence Spectroscopy of Purified Plasma Membranes
To confirm FLIM-FRET measurements on single cells by ensemble studies, we performed time-resolved fluorescence spectroscopy on plasma membranes. We isolated plasma membranes by gradient purification of CHO cell lysates expressing either GPI-mCFP or TMD-HA-mYFP or coexpressing GPI-mCFP and TMD-HA-mYFP. As shown in supplemental Fig. 1E, the top fractions used for measurements are enriched with GPI-mCFP and TMD-HA-mYFP and contain only minor amounts of endoplasmic reticulum and Golgi membranes. Because plasma membrane preparation is rather extensive, we focused essentially (but not exclusively) on constructs with mutated fluorescent proteins.
In Table 1, the results of typical experiments are summarized. The fluorescence intensity decay curves are described by three exponentials, where a short component contributes very little to the average lifetimes. This component is usually not detected, and in the present case it was probably detected because of the picosecond time resolution of the single photon timing setup used. The two main components are similar to those published previously by others (29) and to those recovered from the FLIM data analysis. The amplitude average lifetime (2.4–2.5 ns) is also coincident with the FLIM results, validating the FLIM data analysis. Also in agreement with our FLIM studies, the average fluorescence lifetime of GPI-mCFP in the absence of acceptor (τD; see Table 1) did not change with the addition of MβCD, and thus the shortening observed in the presence of an acceptor can be directly related to FRET.
To assess lateral organization of fluorescent GPI and TMD-HA by means of homoFRET, we performed time-resolved anisotropy measurements. Thus, in samples containing only donor (GPI-mCFP) or only acceptor (TMD-HA-mYFP), energy homotransfer could be evaluated from picosecond resolution fluorescence anisotropy decay, which was translated as information on the aggregation state of the donor and the acceptor separately, yielding important knowledge for the rationalization of the heteroFRET data. In Fig. 7, curve A represents the anisotropy decay of GPI-mCFP. The steady-state values are very similar in all of the samples studied, ranging from 0.31 to 0.34 (Table 1). However, between the rotational correlation times, ϕ1 (short rotational correlation time) and ϕ2 (long rotational correlation time), significant differences are found. ϕ2 can be interpreted as the wobbling of the GPI-linked mCFP moiety, and it is around 33 ns. Because it depends only on the size and shape of the fluorophore and the viscosity of the medium, it is not surprising that no significant changes were detected. Regarding ϕ1, however, it cannot be related to the movement of a large chromophore such as mCFP, but rather it is due to a process of energy homotransfer or energy migration (13). In the case of mCFP, it has a value of 1.16 ns, indicative of the proximity of the chromophores, which corresponds to a distance between the two GPI-mCFP of about 33 Å (13). These data are in agreement with those of Sharma et al. (13) who observed that at least a fraction (>10%) of the GPI-GFP with an intermolecular distance of 35 Å is organized in small raft domains in the plasma membrane of CHO-K1 cells.
FIGURE 7.

Time-resolved anisotropy decay profiles of GPI-mCFP (A) and TMD-HA-mYFP (B). Anisotropy decay curves reveal the presence of a short rotational correlation time ϕ1 and a long rotational correlation time ϕ2 (see Tables 1 and 2). The short component is due to homoFRET.
Pretreatment of cells with MβCD leads to loss of homoFRET and, hence, of the short component ϕ1 (see Table 1), showing that the average distance between GPI-mCFP increased and chromophores are no longer within FRET distance. Again, this is in agreement with previous homoFRET studies (13), confirming the cholesterol-sensitive lateral organization of GPI-mCFP as a raft marker.
In the presence of TMD-HA-mYFP, there is a reduction in the fluorescence lifetime of GPI-mCFP (Table 1, last row). From the amplitude-averaged lifetime of several samples, FRET efficiencies between ∼10 and 20% are calculated. These values are in the order of those obtained from FLIM.
Rotational correlation times derived from anisotropy decay curves (Fig. 7, curve B) of TMD-HA-mYFP were investigated (Table 2). ϕ2 is similar to that observed for GPI-mCFP (Table 1), which is to be expected, because the size and shape of the two chromophores are similar. ϕ1 is below 0.5 ns, pointing also to a close proximity. The intermolecular distance can be estimated to be about 39 Å. HomoFRET contribution to the integrated steady-state anisotropy is greater in comparison with GPI-mCFP. Furthermore, the steady-state anisotropy is essentially independent of the surface density (cF) of TMD-HA-mYFP, and extraction of cholesterol with MβCD does not affect the rotational correlation parameters (Table 2). These observations are in agreement with a stable association between TMD-HA-mYFP molecules.
TABLE 2.
TMD-HA-mYFP time-resolved anisotropy parameters
Rotational correlation times (ϕ1and ϕ2) were retrieved from the fluorescence anisotropy decay curves, global chi square of the fitting (χ2tot), and steady-state fluorescence anisotropy 〈r〉 of purified plasma membrane suspensions from CHO cells expressing TMD-HA-mYFP, untreated (−MβCD) or treated with MβCD (+MβCD) to extract cholesterol. The total protein concentration,cP, the fluorescence intensity,IF (indicative of fluorescent protein amount), andcF=IF/cP (indicative of fluorescent protein concentration) are also given. a.u., arbitrary units.
| Sample | cP | IF | cF | ϕ1 | ϕ2 | χ2tot | 〈r〉 |
|---|---|---|---|---|---|---|---|
| μg/ml | a.u. | IF/cP | ns | ns | |||
| −MβCD | 50 | 1000 | 20.4 | 0.29 | 43 | 1.17 | 0.33 |
| −MβCD | 565 | 940 | 1.7 | 0.32 | 34 | 1.22 | 0.32 |
| +MβCD | 227 | 540 | 2.4 | 0.41 | 24 | 1.23 | 0.32 |
| +MβCD | 216 | 507 | 2.3 | 0.21 | 43 | 1.28 | 0.32 |
DISCUSSION
In the present study we investigated the lateral organization of the TMD and CT sequence of HA (TMD-HA) in the plasma membrane of living mammalian cells. Essentially, biochemical assays based on detergent insolubility and immunoelectron microscopy have provided evidence that HA is localized to lipid domains enriched in cholesterol, saturated phospholipids, and/or glycosphingolipids (so-called rafts). To enable the measurement of living cells, we tagged the constructs and the well established raft marker, GPI, with the fluorescent proteins YFP and CFP, respectively, and assessed their interaction by FLIM-FRET. Although previous approaches (10) tagged the CT of HA with variants of fluorescent proteins, we replaced the ectodomain of HA with a fluorescent protein. Thereby, we avoided any interference of the fluorescent protein with a role of the CT in the lateral organization of HA. Indeed, previous studies had indicated that mutations in the TMD and the CT of HA reduce association with detergent-resistant fractions (3, 4, 6, 30).
HeteroFRET measurements on cells can be done by FLIM or by steady-state measurements of the donor intensity. In the latter case bleaching of the acceptor, which is required to assess FRET, may be incomplete or may even affect the stability of the donor. For example, previous studies on GPI-linked fluorescent proteins using acceptor bleaching did not detect any significant heteroFRET beyond noise (13, 31, 32). In contrast, homoFRET measurements revealed clustering of GPI constructs (13). In line with the latter finding, we found significant heteroFRET between GPI-CFP and GPI-YFP by FLIM, indicating that this technique is superior to acceptor bleaching-based studies. Whatever technique is used to measure FRET, the interpretation of the results may not be straightforward. Hence, we employed different complementary strategies to extract information on the lipid domain organization of TMD-HA from FRET data. All approaches provided consistent data.
The strong homoFRET between TMD-HA constructs measured by anisotropy is in agreement with a tight association of constructs. This was also corroborated by the heteroFRET observed between TMD-HA-CFP and TMD-HA-YFP and by the absence of any effect of cholesterol depletion on FRET efficiency (not shown). Moreover, the very low FRET efficiency between the TMD-HA and the SFV-E2 constructs strongly indicate that TMD-HA specifically forms homodimers but not heterodimers.
Based on the distance of about 39 Å between the fluorescent proteins of the two associated TMD-HA constructs revealed by homoFRET and the Förster radius of 49 Å for a CFP-YFP pair (21), heteroFRET efficiency should be in the order of 60%. However, keeping in mind that apart from CFP-YFP, YFP-YFP and CFP-CFP TMD-HA dimers also are formed, which do not contribute to heteroFRET, the expected FRET efficiency is on the order of about 20%, which agrees with the measured value of about 16%.
In conclusion, TMD-HA forms stable dimers. This is in agreement with the strong self-association of synthetic TMD-HA peptides, which have been shown to form heat-stable oligomers (33, 34). Our data indicate that TMD-HA constructs may be also linked by disulfide bonds. Currently, we are studying which of the cysteines are the sites for this bond formation. The oligomerization of the TMD-HA mimics the organization of full-length HA, which forms noncovalent homotrimers, although we are aware that interactions between the ectodomains of full-length HA monomers are relevant for trimerization.
Interestingly, only HA trimers, but not monomers, are transported to the plasma membrane (22, 35). We made a similar observation showing that monomers of TMD-HA were not transported to the plasma membrane.
FRET efficiency between the raft marker GPI-(m)CFP and TMD-HA-(m)YFP was on the order of 10%. This magnitude has been also reported for other membrane proteins recruited to rafts (36). Cholesterol depletion led to a decrease in FRET efficiency between GPI and the TMD-HA consistent with a recruitment of TMD-HA to rafts, which are disrupted upon cholesterol depletion. Sharma et al. (13) have shown that in the plasma membrane of CHO-K1 cells, cholesterol-sensitive clusters of GPI-GFP and other GPI-linked protein are present. Their typical size is about 5 nm, and they are supposed to contain about four to five GPI-linked protein molecules. Based on our observation of cholesterol-sensitive FRET between GPI and TMD-HA, we surmise that TMD-HA is recruited to those nanoclusters. Because the fraction of those clusters has been found to be less than 30% (13), a large pool of GPI-linked fluorescent proteins and TMD-HA is outside of these clusters, which explains the limited FRET efficiency.
Support for the localization of TMD-HA to cholesterol-sensitive domains is also given by the observation that the non-palmitoylated variant of TMD-HA shows almost no FRET. Palmitoylation is considered to be important for the association of HA and other membrane proteins with cholesterol-enriched lipid domains. The different affinities of TMD-HA-YFP and TMD-HAC3S-YFP for rafts are also reflected by the observed difference with respect to DRM partitioning.
Finally, the very low energy transfer measured upon coexpression of SFV-E2-mCFP and TMD-HA-mYFP or GPI-YFP confirms the diverse plasma membrane localization of these two proteins. Therefore, it also assures that the reduction of the lifetime observed in the presence of the GPI raft marker has to be related to FRET because of the close proximity of the molecules and thus the clustering into lipid rafts domains. Hence, it underlines the sensitivity of our approach for lipid domain localization of proteins. Furthermore, the results support previous observations that spike proteins of SFV do not show any preference for partitioning into DRMs.
CONCLUSION
Our results on TMD-HA clustering in living cells are compatible with recent reports on the localization of HA on the cell surface using immunoelectron microscopy and fluorescence photoactivation localization microscopy (FPALM) (9, 10, 37). In these studies HA clusters at all accessible scales of length were observed, but only clusters at the nanometer scale could be disintegrated by extraction of cholesterol, suggesting that clustering of HA occurs also by other means. Here, we have shown that the membrane anchor of HA can recruit to previously characterized (13) cholesterol-sensitive nanoclusters resembling rafts in the plasma membrane of CHO-K1 cells. The data suggest that palmitoylated TMD-HA alone is sufficient for the association of HA with such nanodomains. Although we have no quantitative data, our results show that localization of TMD-HA dimers into raft domains reflects the behavior of full-length HA, at least on the qualitative level. Indeed, FLIM-FRET revealed strong clustering of native HA fused at its cytoplasmic tail to the fluorescent protein Cerulean, with Lyn-YFP, an established marker for rafts localized on the cytoplasmic leaflet of the plasma membrane.5 Clustering was significantly reduced when rafts were disintegrated by cholesterol depletion. Furthermore, our biochemical analysis of raft localization based on Triton extraction (see supplemental Fig. 1D) corroborates the assumption that TMD-HA localization reflects that of full-length HA, as both proteins were found in the detergent-resistant fraction. Hence, the TMD-HA constructs provides a basis for studying the relevance of the TMD sequence for lateral membrane distribution, in particular for recruitment into lipid domains. It remains to be seen whether clusters of similar size, or much larger, exist in the plasma membrane of native host cells of influenza virus. At least in the former case, small clusters have to be merged in order to form a virus budding site, which is known to be enriched in raft-forming lipids (3). This, for example, can be accomplished by interaction of viral matrix protein M1 with the cytoplasmic tails of HA and neuraminidase (38, 39) on one side and by polymerization of M1 (40) on the other. The initial small size of clusters and, hence, the low number of proteins in such a cluster, as well as the specific interaction of M1 with viral proteins, might provide a mechanism to specifically enrich viral proteins in merged clusters and expel nonviral membrane proteins. Interestingly, Sharma et al. (13) observed, by a similar principle (the specific interaction of cross-linked antibodies with constituents of nanoclusters), a reorganization of cluster composition.
Supplementary Material
Acknowledgments
We thank Bastian Thaa for providing the SFV-E2-mCFP fusion protein and Louis Loura for data analysis.
This work was supported by the Deutsche Forsch ungs ge mein schaft (DFG) (SPP 1175 and SFB 740, TP C3) (to A. H. and M. V.).

The on-line version of this article (available at http://www.jbc.org) contains supplemental “Experimental Procedures,” references, and Figs. 1 and 2.
B. Thaa, unpublished data.
S. Engel, S. Scolari, C. Sieben, B. Thaa, K. Nils, T. Koite, A. Hermann, and M. Veit, unpublished data.
- HA
- hemagglutinin
- FLIM
- fluorescence lifetime imaging microscopy
- FRET
- Förster resonance energy transfer
- GPI
- glycosylphosphatidylinositol
- GFP
- green fluorescent protein
- CFP
- cyan fluorescent protein
- YFP
- yellow fluorescent protein
- mCFP and mYFP
- mutated CFP and YFP, respectively
- TMD
- transmembrane domain
- CT
- cytoplasmic tail
- DRM
- detergent-resistant membrane
- CHO
- Chinese hamster ovary
- SFV
- Semliki Forest virus
- MβCD
- methyl-β-cyclodextrin.
REFERENCES
- 1.White J., Helenius A., Gething M. J. ( 1982) Nature 300, 658– 659 [DOI] [PubMed] [Google Scholar]
- 2.Scheiffele P., Rietveld A., Wilk T., Simons K. ( 1999) J. Biol. Chem. 274, 2038– 2044 [DOI] [PubMed] [Google Scholar]
- 3.Scheiffele P., Roth M. G., Simons K. ( 1997) EMBO J. 16, 5501– 5508 [DOI] [PMC free article] [PubMed] [Google Scholar]
- 4.Takeda M., Leser G. P., Russell C. J., Lamb R. A. ( 2003) Proc. Natl. Acad. Sci. U. S. A. 100, 14610– 14617 [DOI] [PMC free article] [PubMed] [Google Scholar]
- 5.De Almeida R. F., Loura L. M., Fedorov A., Prieto M. ( 2005) J. Mol. Biol. 346, 1109– 1120 [DOI] [PubMed] [Google Scholar]
- 6.Zhang J., Pekosz A., Lamb R. A. ( 2000) J. Virol. 74, 4634– 4644 [DOI] [PMC free article] [PubMed] [Google Scholar]
- 7.Heerklotz H. ( 2002) Biophys. J. 83, 2693– 2701 [DOI] [PMC free article] [PubMed] [Google Scholar]
- 8.Munro S. ( 2003) Cell 115, 377– 388 [DOI] [PubMed] [Google Scholar]
- 9.Hess S. T., Kumar M., Verma A., Farrington J., Kenworthy A., Zimmerberg J. ( 2005) J. Cell Biol. 169, 965– 976 [DOI] [PMC free article] [PubMed] [Google Scholar]
- 10.Hess S. T., Gould T. J., Gudheti M. V., Maas S. A., Mills K. D., Zimmerberg J. ( 2007) Proc. Natl. Acad. Sci. U. S. A. 104, 17370– 17375 [DOI] [PMC free article] [PubMed] [Google Scholar]
- 11.Hancock J. F. ( 2006) Nat. Rev. Mol. Cell Biol. 7, 456– 462 [DOI] [PMC free article] [PubMed] [Google Scholar]
- 12.Silvius J. R., Nabi I. R. ( 2006) Mol. Membr. Biol. 23, 5– 16 [DOI] [PubMed] [Google Scholar]
- 13.Sharma P., Varma R., Sarasij R. C., Ira, Gousset K., Krishnamoorthy G., Rao M., Mayor S. ( 2004) Cell 116, 577– 589 [DOI] [PubMed] [Google Scholar]
- 14.Brown D. A., Rose J. K. ( 1992) Cell 68, 533– 544 [DOI] [PubMed] [Google Scholar]
- 15.Keller P., Toomre D., Diaz E., White J., Simons K. ( 2001) Nat. Cell Biol. 3, 140– 149 [DOI] [PubMed] [Google Scholar]
- 16.Zacharias D. A., Violin J. D., Newton A. C., Tsien R. Y. ( 2002) Science 296, 913– 916 [DOI] [PubMed] [Google Scholar]
- 17.Lackowicz J. R. ( 2006) Principles of Fluorescence Spectroscopy, 3rd Ed., Springer Science+Business Media, New York [Google Scholar]
- 18.De Almeida R. F., Loura L. M., Prieto M., Watts A., Fedorov A., Barrantes F. J. ( 2006) Mol. Membr. Biol. 23, 305– 315 [DOI] [PubMed] [Google Scholar]
- 19.Gautier I., Tramier M., Durieux C., Coppey J., Pansu R. B., Nicolas J. C., Kemnitz K., Coppey-Moisan M. ( 2001) Biophys. J. 80, 3000– 3008 [DOI] [PMC free article] [PubMed] [Google Scholar]
- 20.Tanaka F., Mataga M. ( 1979) Photochem. Photobiol. 29, 1091– 1097 [Google Scholar]
- 21.Patterson G. H., Piston D. W., Barisas B. G. ( 2000) Anal. Biochem. 284, 438– 440 [DOI] [PubMed] [Google Scholar]
- 22.Copeland C. S., Doms R. W., Bolzau E. M., Webster R. G., Helenius A. ( 1986) J. Cell Biol. 103, 1179– 1191 [DOI] [PMC free article] [PubMed] [Google Scholar]
- 23.Veit M., Kretzschmar E., Kuroda K., Garten W., Schmidt M. F., Klenk H. D., Rott R. ( 1991) J. Virol. 65, 2491– 2500 [DOI] [PMC free article] [PubMed] [Google Scholar]
- 24.Tall R. D., Alonso M. A., Roth M. G. ( 2003) Traffic 4, 838– 849 [DOI] [PubMed] [Google Scholar]
- 25.Brown D. A., London E. ( 2000) J. Biol. Chem. 275, 17221– 17224 [DOI] [PubMed] [Google Scholar]
- 26.Grailhe R., Merola F., Ridard J., Couvignou S., Le Poupon C., Changeux J. P., Laguitton-Pasquier H. ( 2006) Chemphyschem 7, 1442– 1454 [DOI] [PubMed] [Google Scholar]
- 27.Lu Y. E., Kielian M. ( 2000) J. Virol. 74, 7708– 7719 [DOI] [PMC free article] [PubMed] [Google Scholar]
- 28.Briggs J. A., Wilk T., Fuller S. D. ( 2003) J. Gen. Virol. 84, 757– 768 [DOI] [PubMed] [Google Scholar]
- 29.Borst J. W., Hink M. A., van Hoek A., Visser A. J. ( 2005) J. Fluoresc. 15, 153– 160 [DOI] [PubMed] [Google Scholar]
- 30.Lin S., Naim H. Y., Rodriguez A. C., Roth M. G. ( 1998) J. Cell Biol. 142, 51– 57 [DOI] [PMC free article] [PubMed] [Google Scholar]
- 31.Kenworthy A. K., Edidin M. ( 1998) J. Cell Biol. 142, 69– 84 [DOI] [PMC free article] [PubMed] [Google Scholar]
- 32.Kenworthy A. K., Petranova N., Edidin M. ( 2000) Mol. Biol. Cell 11, 1645– 1655 [DOI] [PMC free article] [PubMed] [Google Scholar]
- 33.Tatulian S. A., Tamm L. K. ( 2000) Biochemistry 39, 496– 507 [DOI] [PubMed] [Google Scholar]
- 34.Chang D. K., Cheng S. F., Kantchev E. A., Lin C. H., Liu Y. T. ( 2008) BMC Biol. 6, 2. [DOI] [PMC free article] [PubMed] [Google Scholar]
- 35.Doms R. W., Lamb R. A., Rose J. K., Helenius A. ( 1993) Virology 193, 545– 562 [DOI] [PubMed] [Google Scholar]
- 36.Hofman E. G., Ruonala M. O., Bader A. N., van den Heuvel D., Voortman J., Roovers R. C., Verkleij A. J., Gerritsen H. C., van Bergen En Henegouwen P. M. ( 2008) J. Cell Sci. 121, 2519– 2528 [DOI] [PubMed] [Google Scholar]
- 37.Leser G. P., Lamb R. A. ( 2005) Virology 342, 215– 227 [DOI] [PubMed] [Google Scholar]
- 38.Enami M., Enami K. ( 1996) J. Virol. 70, 6653– 6657 [DOI] [PMC free article] [PubMed] [Google Scholar]
- 39.Gomez-Puertas P., Albo C., Perez-Pastrana E., Vivo A., Portela A. ( 2000) J. Virol. 74, 11538– 11547 [DOI] [PMC free article] [PubMed] [Google Scholar]
- 40.Baudin F., Petit I., Weissenhorn W., Ruigrok R. W. ( 2001) Virology 281, 102– 108 [DOI] [PubMed] [Google Scholar]
Associated Data
This section collects any data citations, data availability statements, or supplementary materials included in this article.