

Abstract
This work’s objective was to offer additional insights into the psychological and genetic bases of reading ability and disability, and to evaluate the plausibility of a variety of psychological models of reading involving phonological awareness (PA) and rapid naming (RN), both hypothesized to be principal components in such models. In Study 1, 488 unselected families were assessed with measures of PA and RN to investigate familial aggregation and to obtain estimates of both the number and effect-magnitude of genetic loci involved in these traits’ transmission. The results of the analyses from Study 1 indicated the presence of genetic effects in the etiology of individual differences for PA and RN and pointed to both the shared and unique sources of this genetic variance, which appeared to be exerted by multiple (3–6 for PA and 3–5 for RN) genes. These results were used in Study 2 to parameterize a simulation of 3,000 families with quantitatively distributed PA and RN, so that the robustness and generalizability of the Study 1 findings could be evaluated. The findings of both studies were interpreted according to established theories of reading and our own understanding of the etiology of complex developmental disorders.
Introduction
Specific reading disability (SRD) is often characterized by a deficit in the accuracy and fluency of single-word reading despite adequate instruction and cognitive ability (Lyon, 2003). Years of research have determined that it is more accurate to characterize SRD as a multidimensional and continuous construct than as a simple dichotomous diagnosis (Ackerman, Holloway, Youngdahl, & Dykman, 2001; Siegel, 2003). A number of researchers have identified two reading-related processes found to be principally deficient in individuals with SRD: phonemic awareness and rapid naming (Ackerman et al., 2001; Pennington, Cardoso-Martins, Green, & Lefly, 2001; Wolf & Bowers, 1999). Specifically, it has been established that phonemic awareness (PA)—the ability to both appreciate that spoken words are composed of a set of sounds and to manipulate these sounds—is strongly associated with accurate decoding of both real and nonsense written words (Pratt & Brady, 1988; Stanovich, 1988; Torgesen, Wagner, & Rashotte, 1994). Rapid naming (also referred to as speed of naming or speed of lexical retrieval, RN)—the ability to rapidly map a visual image to a word—in turn, has been found to be a good predictor of the fluency (i.e., speed) of single-word reading (Denckla & Rudel, 1974; LaBerge & Samuels, 1974; Smith & Holmes, 1971).
Multiple models of SRD implicate different causal pathways thought to relate primarily, but not exclusively, to deficits in phonemic/phonological skills (Pennington et al., 2001), naming/retrieval skills (Snyder & Downey, 1995), or some combination of both deficits (Denckla & Cutting, 1999; Wagner & Torgesen, 1987; Wolf & Bowers, 1999; Wolf et al., 2002). Correspondingly, the question is whether the difficulties in mastering reading are best characterized through a one-factor model in which phonological skills account for all or most of the variance in reading skills, and rapid naming is subsumed under the umbrella of phonological skills, or through a two-factor model, in which phonological skills and rapid naming each account for some unique variance in reading skills. To arrive at the aims of the proposed study, we need to briefly review the literature on PA and RN.
Phonemic Awareness
Individuals with SRD are often described as error-prone readers. It is thought that these errors in decoding and identifying single words are caused by an underlying deficit in the mastery of the sounds of language, that is, PA (Stanovich, 1988; Wagner, Torgesen, & Rashotte, 1994). Tasks used to assess PA commonly require some skills to navigate and process phonological information (phonological processing, PP). Thus, PA contributes to PP, but other skills form PP as well.
There is much individual variability in PP, and extensive research has documented the predictability of this variability across the lifespan for reading acquisition (Anthony et al., 2002; Atchley, Halderman, Kwasny, & Buchanan, 2003; Lyytinen et al., 2004; Sprugevica & Hoien, 2003) and its variability as a differentiating factor between typical and disabled readers (Stanovich & Siegel, 1994; Torgesen, Wagner, Rashotte, Burgess, & Hecht, 1997). Common examples of relevant difficulties observed across the lifespan include trouble rhyming (Ackerman, Dykman, & Oglesby, 1994); identifying phonemes or syllables in a word (Mody, Studdert-Kennedy, & Brady, 1997); deleting, isolating, or substituting syllables or phonemes in a word (Duncan & Johnston, 1999; Scarborough, Ehri, Olson, & Fowler, 1998); blending syllables and phonemes to form a word or pseudoword (Hoien, Lundberg, Stanovich, & Bjaalid, 1995); decoding and encoding (Snowling, Nation, Moxham, Gallagher, & Frith, 1997), and repeating (Brady, 1997) pseudowords. The variability of the tasks used to measure PP has been conceptualized through a latent construct known as underlying phonemic ability (Schatschneider, Francis, Foorman, Fletcher, & Mehta, 1999; Wagner et al., 1994).
The stability of PA within an individual over time, although modifiable (Torgesen et al., 1999), suggests that this trait is a consistent influence on reading acquisition and ability throughout the lifespan. Specifically, children and adults with reading difficulties often exhibit persistent difficulties on PA tasks under conditions of both natural development and remediation (Bird, Bishop, & Freeman, 1995; Fawcett & Nicolson, 1995). For example, college students with a previous history of SRD who read appropriately for their age and education level were reported as deficient in their ability to successfully manipulate phonemic representations in comparison with a control group of college students without SRD (Wilson & Lesaux, 2001). Interestingly, in adults these phonological deficits are most apparent in novel phonological situations such as spelling or reading pseudowords or in lexical decision tasks (Bruck, 1992). This finding suggests that although adults have developed compensatory strategies for dealing with learned words, they are still deficient in the underlying PP. It should also be noted that PA demonstrates substantial heritability, averaging at ~.45 (95% CI .42–.70) (Grigorenko, 2004).
Thus, PA skills remain a source of substantial individual variability across the lifespan. The source of this variability appears to be neurologically rooted (Pugh et al., 2001), with the relevant brain circuits somewhat sensitive to targeted intervention (Agnew, Dorn, & Eden, 2004; Shaywitz et al., 2004). The transformation, however, of these neurological changes into stable and prolonged behavioral manifestations (Blachman et al., 2004), as well as the transformation of improvements in PA skills into strengthened single-word reading, although possible, is a challenge (Bus & van IJzendoorn, 1999).
In summary, the PA–single-word reading link, although powerful, is not absolute. In other words, although important for reading, PA is not the only vital process (Castles & Coltheart, 2004). Other reading-related processes need to be considered in relation to SRD, including RN (Wolf & Obregon, 1992).
Rapid Naming
Researchers of different theoretical orientations (LaBerge & Samuels, 1974; Smith & Holmes, 1971) agree that fluent reading requires automatized rapid processing of single words; such an automatized rapid processing is closely related to, and thus highly correlated with, serial RN. A set of naming tasks was initially designed to assess this ability to map visual stimuli to their phonological representations automatically (Denckla & Rudel, 1974). Currently, there are many methods aimed at quantifying this skill (Swanson, Trainin, Necoechea, & Hammill, 2003). There is a substantial body of research indicating the connection between slow performance on serial naming tasks and laborious, slow, disabled reading (Ackerman & Dykman, 1996; Fawcett & Nicolson, 1994; Katzir et al., 2006; Savage & Frederickson, 2006; Semrud-Clikeman, Guy, Griffin, & Hynd, 2000; Wocadlo & Rieger, 2007). Of note is that RN tasks do not require participants to be literate; stimuli can be colors or pictures. For example, in pre-literate children, RN of objects turns out to be predictive of letter knowledge (Torppa, Poikkeus, Laakso, Eklund, & Lyytinen, 2006). Longitudinally, however, alphanumeric (rather than color–object) RN appears to be a better predictor of individual differences in reading skills (Compton, 2003; van den Bos, Zijlstra, & lutje Spelberg, 2002) and of concurrent text-reading speed (Savage & Frederickson, 2005; Young & Bowers, 1995). However, there are ongoing debates in the literature about the longitudinal predictive validity of RN (Puolakanaho et al., 2007; Savage, 2004).
Similar to PA, impairments in RN persist throughout childhood and adulthood. A 9-year follow-up study conducted on individuals identified at age 9 as reading disabled established that naming ability remained consistent and, in individuals with reading problems, deficient over the decade (Korhonen, 1995). Although RN skills can be improved (Kerins, 2006; Wolf, Miller, & Donnelly, 2000), the training appears to be time and labor intensive (de Jong & Vrielink, 2004; Korkman, Barron-Linnankoski, & Lahti-Nuuttila, 1999). Yet, RN indicators themselves have been reported to be unrelated to improvements in reading fluency (Berends & Reitsma, 2006). Similar to PA, individual variability in RN appears to be related to individual differences in activation patterns of specific neural substrates (Misra, Katzir, Wolf, & Poldrack, 2004) and its heritability is estimated at ~.60 (Grigorenko, 2004).
Additionally, RN is predictive of reading performance, but unlike PA, RN is most predictive in orthographies that display more consistency in the manner in which letters map to sounds (unlike English) (Muller & Brady, 2001), such as Finnish (Nopola-Hemmi et al., 2002; Torppa et al., 2006), Spanish (Gonzalez & Valle, 2000), and German (Landerl & Wimmer, 2002). Successful decoding in an orthographically transparent language is significantly easier than decoding in a language such as English, and thus allows more successful decoding by individuals who might otherwise exhibit difficulties (Goswami, 2003a). Yet, despite this advantage in certain languages, individuals with SRD still exhibit difficulties mapping letters to word sounds in a fluent manner; thus, in phonologically transparent linguistic environments, the performance of individuals with reading difficulties is still distinctly different from that of typical readers (i.e., is slow and laborious, although often comparable in accuracy).
Thus, the language of the reader appears to modulate the impact of various factors in the acquisition of reading ability; not all languages are equally easy or difficult for readers. PA and RN ability appear to vary in their respective power to predict reading performance depending on the level of transparency of a given orthography.
Relationships between PA and RN
Thus, PA is primarily concerned with the representation of the sounds of language, whereas RN is concerned with the retrieval of that information [for a comprehensive review of both processes and their relationships to dyslexia, see (Ramus & Szenkovits, 2008)]. Given the interest devoted to each of these processes in the literature, it is only natural that researchers have tried to investigate the relationship between these processes (Allor, 2002). A number of corresponding models have been developed: (1) a model in which RN and PA are viewed as different manifestations of a latent construct variably referred to as phonological competence, phonemic ability, phonological processing, or phonological representation (Savage, 2004; Shankweiler & Crain, 1986); (2) a two-factor model in which PA and RN are dissociable, so that deficits in each can contribute independently to the manifestation of SRD [although the most severe SRD is observed when both PA and RN are deficient, e.g., (Bowers & Wolf, 1993)]; and (3) models in which PA and RN are partially independent, sharing some variance in common and contributing uniquely to SRD in a hierarchical manner, in which the contribution of RN variability, although of interest, is relatively insignificant in the manifestation of SRD (Ackerman & Dykman, 1993; Ackerman et al., 2001; Felton, 1992; Meyer, Wood, Hart, & Felton, 1998; Pennington et al., 2001). Below we offer some brief excerpts from the literature to exemplify these models and, based on this review, formulate our hypotheses for the studies presented here.
Support for the first theoretical position—that PA and RN are different manifestations of the same latent construct—was generated in a number of empirical works that included measures of both PA and RN [e.g., (de Jong & van der Leij, 2002)]. In these studies, researchers attempted to discover whether RN accounts for any variance in the criterion (typically single-word decoding) over and above PA; The results indicated that, if at all, RN contributed to reading performance at a low level. Yet, the evidence from studies in English (Savage & Frederickson, 2006) and other languages (Torppa et al., 2006) suggests that naming ability has a considerable effect on reading performance. When decoding skills are formed and are no longer an obstacle for deficient readers of transparent languages, a fluency deficit remains. Thus, it is not unreasonable to conclude that there may be a second process in addition to a deficit in PP that explains the observed individual differences in reading present in all languages, although this process might be important at different developmental stages than PA.
Wolf and colleagues (Bowers & Ishaik, 2003; Bowers & Wolf, 1993; Wolf & Obregon, 1992) and other researchers (Miller et al., 2006) provide a useful illustration to show that PA and RN are two different processes. Specifically, these researchers posited a two-factor model of reading disability referred to as the Double-Deficit Hypothesis (DDH), which states that PA and RN are distinct processes that contribute to both reading acquisition and reading difficulties. The practical implication of this hypothesis is that, among children with SRD, one can find children with either PA or RN deficits (~15% to 20% each) or both deficits (~60%) (Wolf et al., 2002). Whereas children with PA and RN deficits tend to manifest somewhat distinct profiles of deficiencies, all deficiencies might occur in the two-deficit group, making it the group most severely affected with SRD. Thus, it is assumed that PA and RN are independent factors that act additively in the double-deficit group. There is a substantial body of research (Bowers, Sunseth, & Golden, 1999; Spring & Davis, 1988; Spring & Perry, 1983; Wolf & Bowers, 1999; Wolf & Obregon, 1992) that supports the DDH, although it also has its detractors (Schatschneider, Carlson, Francis, Foorman, & Fletcher, 2002).
The third theoretical position assumes that RN contributes to the manifestation of SRD over and above PA, but that this contribution is insufficient to be causal. The data supporting this view have been generated in group comparison (Cardoso-Martins & Pennington, 2004), longitudinal (Catts, Gillispie, Leonard, Kail, & Miller, 2002; Compton, 2003; de Jong & Olson, 2004; Felton, 1992), modeling (Manis, Seidenberg, & Doi, 1999), and meta-analytic (Swanson, Trainin et al., 2003) studies. This position appears to correspond with a conclusion drawn from a review of the history of testing for RN (Denckla & Cutting, 1999), according to which RN is a complex ability that draws on multiple psychological processes (visual, verbal, and executive, to name a few). It is possible that only a portion of the variance in RN is related to reading and, compared with PA, is of modest magnitude.
This research aims to compare three competing hypotheses: (1) PA and RN are different manifestations of the same underlying process (i.e., a broadly defined phonological ability) and, therefore, have a common etiology; (2) PA and RN are distinct processes with distinct etiologies; or (3) PA and RN are partially overlapping processes contributing both shared and distinct variance to reading ability and disability, and thus, their etiologies have both shared and unique components.
Although a direct test of these hypotheses is not possible in this particular research context, we can add to the relevant discussion in the field with regard to the plausibility of these hypotheses using the results from the two studies described below. First, in Study 1, we collected behavioral data from the participants in a large-scale family study. These data allowed us to evaluate the familiality of PA and RN, and to conduct segregation analyses of these indicators (i.e., to utilize a method of genetic analysis that tests whether an observed pattern of phenotypes in families is compatible with an explicit model of inheritance, see (Boehnke, Young, & Moll, 1988; Bonney, Lathrop, & Lalouel, 1988; Elston, 1981; Lalouel, Rao, Morton, & Elston, 1983)]. Then, in Study 2, using the information obtained from these segregation analyses, we simulated a genetic dataset mimicking the distribution of PA and RN in the general population. Finally, we analyzed the simulated dataset to illustrate the feasibility of recovering the initial parameter estimates obtained through the analyses of the original behavioral data and mapping the genes contributing to the manifestations of PA and RN.
Study 1
The main goal of this study was to investigate familial aggregation of PA and RN and the etiology of observed correlations between PA and RN in a large set of unselected (i.e., ascertained from the community) families. Specifically, the goal of the study was to estimate (1) the degrees of familiality and heritability of both traits; (2) the possible etiology of the traits individually, and their overlap; (3) the number of genes contributing to the traits; (4) the mode of this contribution; (5) the overlap (if any) between these genes across the two traits; and (6) the level of genetic contribution to these traits (i.e., the magnitude of gene-specific effects).
Method
Participants
The sample was ascertained through children attending third, fourth, and fifth grades in the public schools of a mid-size city in Russia. Schools were selected from school clusters to represent typical schools in this city. The study was advertised by flyers at the participating schools, and families were monetarily compensated for their participation.
The Russian language1 was selected intentionally because its linguistic properties put it approximately in the middle of the “transparency” scale between phonologically-orthographically complex (e.g., English) and phonologically-orthographically transparent (e.g., Swahili) languages. Correspondingly, the hypothesis was that both PA and RN are relevant in studying both typical and atypical reading skills in Russian and, thus, Russian would provide an excellent model in which to explore the etiology of and relationships between these traits.
The sample included 502 children aged 7–13 years (mean = 9.7, sd = 1.2), 259 (51.6%) boys and 243 (48.4%) girls clustered in 488 families (14 families had two children eligible to participate in the study, the remaining families had only one eligible child). In these families, at least one parent or adult caregiver was assessed. Altogether, we assessed 473 mothers (aged 24–52, mean = 33.9, sd = 5.2) and 324 fathers (aged 22–61, mean = 35.7, sd = 5.7). In addition, we assessed 6 grandmothers (aged 49–68, mean = 60.0, sd = 8.8) and 3 grandfathers (aged 53–65, mean = 58.7, sd = 6.0). Overall, there were 333 complete families (with both parents and at least one child assessed) and 155 incomplete families (with at least one adult relative and one child assessed). Of the incomplete families, 7 families had fathers and no mothers, 146 families had mothers and no fathers, and 2 families had grandparents but no parents. Thus, the total number of consenting participants in this sample was 1,302.
Materials
All available and consenting family members were assessed on indicators of PA and RN. The selection of the two particular instruments used in this study were driven by the following considerations: (1) the availability of the validated (i.e., adapted and utilized in other research) version in Russian; (2) the distribution of the levels of difficulty for the items so that the instruments could be administered to both children and adults; and (3) the utilization of the instruments in other studies using genetically informative designs (i.e., family or twin designs).
Phonemic awareness
PA was assessed with a Russian modification of Rosner’s Test of Auditory Analysis Skill [TAAS, (Rosner, 1999)]. Participants are required to make a new word by deleting a specified element (e.g., “Say meat. Now say it again, but don’t say m”). The trial items and the first few test items involve the deletion of a morpheme in a compound word or a syllable in a two-syllable word. The 40 remaining items involve omitting a phoneme, first in the initial position, then at the end of a word, then from consonant blends at the beginning of a word, and, finally, from phoneme blends in the middle of a word. The items varied in length from one to four syllables.
Rapid naming
We used an appropriate Russian version of the Test of Rapid Naming for Colors, Objects, Numbers, and Letters [RAN, (Denckla & Rudel, 1974)] to assess RN. Each of the four tests of the RAN consists of a chart containing five different items (i.e., five colors or five letters) presented in horizontal rows of 10 items each, repeated in a random order. The time it takes the child to name the 50 items from left to right, top to bottom, is measured.
Procedure
All of the children and adults were tested individually. Families were compensated monetarily for their participation.
Phenotypes
Using the TAAS, we counted the number of correct responses. For the RAN, we registered the time spent on each type of stimuli (colors, objects, numbers, and letters) and calculated the average time spent on each subtest. The correlations between the RAN subtests were fairly substantial, and, for the purposes of these analyses, we decided, following examples in the literature (Byrne et al., 2006; Petrill, Deater-Deckard, Thompson, DeThorne, & Schatschneider, 2006; Whiteley, Smith, & Connors, 2007), to use an average of the four measures. To generate phenotypes for the subsequent analyses, each trait (TAAS number of correct responses and RAN average time for the four cards) was covaried for age, gender, and age category (child vs. adult). The distribution of these resulting variables approximated normal distribution. The correlation between these two modified variables was −.330 (p < .001), which is congruent to previously reported results (Compton, DeFries, & Olson, 2001; Landerl, 2001; Petrill et al., 2006; Swanson, Harris, & Graham, 2003).
Statistical Analyses
The purposes of the analyses were threefold.
First, we wanted to investigate the familial correlations between different pairs of relatives. These investigations were based solely on correlational analyses.
Second, we were interested in establishing heritability estimates for the traits of interest (PA and RN). To obtain these heritability estimates, we followed relevant illustrations in the literature (Almasy et al., 1999; Wijsman et al., 2000). Specifically, we used LOKI software (Daw, Heath, & Wijsman, 1999; Daw et al., 2000; Heath, 1997) to obtain broad-sense2 heritability estimates, and SOLAR software (Almasy et al., 1999) to obtain narrow-sense3 heritability estimates; we also used a number of original R and Python routines for data manipulation and result presentation. Both LOKI and SOLAR allow the estimation of heritability based on family data of the kind we collected in this study (i.e., child-parent and other relative data from nuclear and small extended families). It is thought that these estimates represent upper bounds for heritability estimates since it is possible that they are somewhat inflated by the contributions from the family shared environment. Yet, both pieces of software are widely used in genetic studies of complex disorders with family data, and the corresponding estimates of heritability are perceived as informative.
Third, we were interested in investigating the modes of genetic transmission that might explain the familial aggregation of PA and RN. The methodology for these analyses was adopted from published work (Wijsman et al., 2000). Specifically, driven by the evidence that multiple genes contribute to the manifestation of reading ability and disability [e.g., (Galaburda, LoTurco, Ramus, Fitch, & Rosen, 2006)], we used the oligogenic segregation analysis Bayesian approach through the Markov chain Monte Carlo (MCMC) implemented in the LOKI software (Daw et al., 1999; Daw et al., 2000; Heath, 1997). In general, segregation analysis permits an investigation of the vertical familial transmission of the phenotype of interest; oligogenic segregation analysis, in particular, allows the modeling of such patterns of familial transmission, including both genetic and environmental factors so that both estimates of heritability and environmentality can be obtained. In particular, in the MCMC approach, it is assumed that phenotype is related to an additive combination of the effects of specific “environmental” covariates (e.g., education) and genetic influences captured through quantitative trait loci (QTL). The phenotypes and covariates are measured, whereas the parameters, including covariate effects, the number of QTL, and their specific effects are estimated by MCMC. In each MCMC iteration, randomly perturbed model parameters are proposed and then either accepted or rejected with probabilities determined by a Metropolis-Hastings ratio. In particular, LOKI uses reversible jump MCMC techniques to incorporate moves that change the numbers of QTL and parameters in the model. Each iteration contributes to the estimates of posterior probabilities. Thus, the estimation involves a stochastic element and calls for many iterations, so that probabilities of the competing models generated during the MCMC iterations can be estimated and compared. In these analyses, we used 20,000 iterations. Specification of parameters in the prior distributions required for Bayesian analyses was done following previously developed procedures (Wijsman et al., 2000; Wijsman, personal communication). As anticipated, results are quite insensitive to the choices of most of the prior parameters, but there is one parameter that can have a considerable effect. The idea of the procedure for choosing this parameter was to adjust it through a range of possible values and choose a value around which the results were most stable4.
The utilization of complex modeling techniques [e.g., variance-components techniques, (Almasy et al., 1999) and MCMC (Wijsman et al., 2000)] on families of different constellations (e.g., including parents, offspring, siblings, and grandparents) allows us not only to obtain estimates of familiality, but also to obtain estimates of heritability. In addition to providing heritability estimates, modern segregation analyses allow investigators to formulate better hypotheses regarding the patterns of vertical transmissions of phenotypes of interest, the anticipated number of genes that might be involved in the transmission of these phenotypes, and the effects sizes for the genes that are hypothesized to be involved. The information obtained from such segregation analyses is informative for molecular-genetic studies attempting to localize specific genes, and it can and should be used in subsequent molecular-genetic investigations. In particular, both LOKI and SOLAR allow the results of segregation analyses to be incorporated into the analyses of molecular-genetic data collected for the same phenotypes. The accurate and proper utilization of the information from segregation analyses in the investigation of genetic linkages and associations with traits of interest might help reduce the number of non-replications in the field of genetic studies of complex behaviors (NCI-NHGRI Working Group on Replication in Association Studies et al., 2007). In short, these modeling techniques allow researchers to formulate more precise hypotheses regarding the magnitude, pattern, and structure of the transmission of genetic predisposition in families vertically, across generations, and to verify these hypotheses, sequentially or simultaneously, in the context of molecular-genetic investigations (Brkanac et al., in press; Sung, Thompson, & Wijsman, 2007) and are especially useful for complex behavior traits whose inheritance is characterized by multilocus inheritance, allelic and locus heterogeneity, and often the presence of a substantial environmental component (Igo & Wijsman, 2008).
Results
Correlations between Relatives
Table 1 shows the correlations between the different types of relatives present in our sample, specifically, child-mother, child-father, and mother-father correlations. All of these correlations were calculated twice, (1) controlling for age and gender and (2) utilizing original indicators. Three observations can be made from Table 1. First, all of the familial correlations for blood relatives, but one borderline correlation (between PA for children and their fathers, p = .102), are statistically significant. Second, also of interest is a pattern of correlations between the spouses: neither the PA nor the RN correlations were significant, indicating the absence of assortative mating for either of the traits. Third, of particular note here is the fact that, in this study, the same instruments for assessing PA and RN were used for both parents and children to investigate the patterns of vertical transmission. Thus, at least conceptually, there was an assumption that the same skills were measured across generations. This conceptual comparability does not assume the absence of age effects, but makes them easier to understand and interpret. Yet, in this study, the “raw” and age- and gender-adjusted correlations are not substantially different (see Table 1). Both types of correlations capture the presence of relative resemblance or familiality. This familial resemblance, however, can be attributed to the influence of shared genes, shared environments, of both. Below, these indicators are subjected to further analyses to estimate heritability (i.e., the degree of resemblance attributable to shared genes) for both PA and RN.
Table 1.
Correlations between Relatives on Indicators of PA and RN
| Relatives & Traits | Child | Mother | Father | |||
|---|---|---|---|---|---|---|
| PA r(p) n | RN(A) r(p) n | PA r(p) n | RN(A) r(p) n | PA r(p) n | RN(A) r(p) n | |
| Child | ||||||
| PA r(p) | 1 | −.391 (.000) 500 | .093 (.043) 478 | −.090 (.048) 478 | .103 (.087) 279 | −.143 (.016) 278 |
| RN(A) r(p) | −.384 (.000) 500 | 1 | −.039 (.396) 478 | .180 (.000) 478 | .019 (.754) 279 | .147 (.014) 279 |
| Mother | ||||||
| PA r(p) | .094 (.041) 473 | −.044 (.474) 474 | 1 | −.243 (.000) 474 | −.034 (.591) 258 | .086 (.170) 258 |
| RN(A) r(p) | −.092 (.044) 476 | .176 (.000) 478 | −.261 (.000) 474 | 1 | .025 (.686) 258 | .072 (.251) 258 |
| Father | ||||||
| PA r(p) | .098 (.102) 278 | .024 (.692) 279 | −.039 (.540) 255 | .024 (.697) 255 | 1 | −.243 (.000) 271 |
| RN(A) r(p) | −.145 (.015) 278 | .150 (.012) 279 | .095 (.129) 255 | .059 (.352) 255 | −.242 (.000) 268 | 1 |
Notes: Familial correlations are shown in bold.
The correlations below the diagonal are adjusted for age and gender; the correlations above the diagonal are not adjusted.
Heritability Estimates
As indicated above, we used two different pieces of software, SOLAR and LOKI, to obtain heritability estimates. SOLAR reports heritability in the narrow sense, which is based on additive genetic variance only: the underlying model assumes that genetic effects operate according to a linear additive function with no higher-order interactions. LOKI reports heritability in the broad sense, which includes both additive and interactive effects of genes. In other words, heritability estimates obtained through SOLAR indicate the lower boundary (i.e., the lowest possible values of heritability estimates for PA and RN, assuming that only additive genetic effects are involved, while the ones obtained through LOKI indicate the upper boundary of heritability (i.e., the highest possible values of heritability estimates for PA and RN, assuming that additive and nonadditive genetic effects are involved) of the trait. Because, at least at this point, both models are plausible, it is important to consider both of these types of heritability estimates.
For the two traits of interest, the narrow-sense (SOLAR-based) heritability estimates were .158 (se = .066) and .246 (se = .063), for PA and RN, respectively. Both values were statistically different from 0. The broad-sense (LOKI-based) heritability estimates for the PA and RN phenotypes were, respectively, .729 (se = .066) and .569 (se = .057). Thus, depending on the genetic model/statistical software utilized, the heritability estimates varied from .158 to .729 for PA and from .246 to .569 for RN. These results indicate that additive genetic effects appear to be smaller for PA than RN, and that nonadditive genetic effects (i.e., dominance) appear to be greater for PA than RN.
Number of Contributing Genes
The heritability analyses presented earlier added additional data to the literature, signifying the importance of genetic factors, especially genetic interactions, as sources of individual differences in both PA and RN [for a review, see (Grigorenko, 2004)]. The next step in the analyses conducted here was to investigate the number of genes that might form these genetic factors. Because these analyses are possible only with the LOKI software, we utilized the broad-sense heritability estimates (and, correspondingly, the genetic model capturing the additive and nonadditive effects of genes on PA and RN).
All analyses were performed covarying for age, sex, and their interaction, with 20,000 iterations. Figure 2(A & B) illustrates the estimates obtained from the MCMC segregation analyses of the posterior probability that specific QTL contribute to each of the two phenotypes, PA and RN. Overall, results indicate that multiple genes contribute to the phenotypes of PA and RN.
Figure 2. Summaries of the segregation analyses.

A. The steps of the histogram are from 0 to 10. The box plot in the corner shows the magnitude of effects of each of the genes, if present (when total genetic variance is constrained to 1).
• Above the X axis: Number of genes contributing to PA when the trait is analyzed alone.
• Below the X axis: Number of genes contributing to PA when the trait is analyzed in the presence of RN.
B. The steps of the histogram are from 0 to 9. The box plot in the corner shows the magnitude of effects of each of the genes, if present (when total genetic variance is constrained to 1).
• Above the X axis: Number of genes contributing to RN when the trait is analyzed alone.
• Below the X axis: Number of genes contributing to RN when the trait is analyzed in the presence of PA.
Specifically, the number of QTL affecting PA was estimated at three to six (posterior probability of .924), with a range of posterior probabilities that a specific number of genes contribute to this trait at .002, .019, .322, .304, and .202, and .096 for one to six genes, respectively (see Figure 2A, top histogram). The distribution of results from 20,000 iterations was characterized by a range of 0–9, with a mean of 4.20, median of 4, mode of 3, and standard deviation of 1.25. The effect size analysis suggested that, among the genes contributing to the variation in PA, when only genetic variance is considered (i.e., 1 is all genetic variance contributing to the trait, regardless of the proportion that genetic variance contributes to the overall phenotypic variance of the trait), there is only one gene of main effect (at an effect size of .4 to .6), three to four genes of moderate effect (at an effect size of ~.2), and possibly a number of genes of small and very small effects (at an effect size below .1 and only slightly different from 0). Interpreting these results in the context of the heritability estimates presented earlier indicates that there might be a gene accounting for ~30% of the genetic variance in PA. In addition, 3–4 genes appear to be accounting for 14–15% of the genetic variance, and 4–5 genes appear to be contributing to ~5–7% of the genetic variance. Of note is that, given the small magnitude of the narrow-sense heritability estimates for PA (.158), it is likely that a major portion of the genetic variance in the PA is attributable to nonadditive rather than additive genetic effects.
The number of QTL contributing to the phenotypic variance of RN was estimated at three to five (posterior probability of .896), with a range of posterior probabilities that suggest that a specific number of genes contribute to the trait of RN at .002, .053, .483, .292, and .121, for one to five genes, respectively (see Figure 2B, top histogram). The distribution of the 20,000 iterations had a range of 0–9, with a mean of 3.63, median of 3.00, mode of 3, and standard deviation of 1.00. The effect size analysis suggested that, among the genes contributing to the genetic variation in RN (i.e., when all genetic variance in the trait is fixed at 1), there is one gene of moderate effect size (i.e., accounting for ~.4 of the genetic variance), two to three genes of small effect (at an effect size of ~.2), and a number of genes of very small effect (at an effect size of .1 and below). Similar to PA, the relative contributions of these genes to the genetic variance in RN appear to vary from ~30% to ~5% of the total genetic variance. However, given that the broad-sense heritability for RN is smaller than that of PA (.569), the absolute contributions of these genes will be smaller than those of the genes contributing to PA’s phenotypic variance.
When both phenotypes were used as covariates in the analyses of each phenotype, the estimates for the number of contributing genes decreased. Specifically, when PA was adjusted for RN, the mean number of genes was estimated at 3.93 (range 0–10, median of 4, mode of 3, and standard deviation of 1.35), with the distribution slightly shifting to the left (see Figure 2A, bottom histogram). Similarly, when RN was adjusted for PA, the mean number of genes was also fewer than for the unadjusted RN, and was estimated at 2.85 (range 0–8, median of 3, mode of 2, and standard deviation of 1.01), with the distribution slightly shifting to the left (see Figure 2B, bottom histogram). These results are in line with the results of the bivariate genetic analyses characteristic of modern analyses of twin data. For example, when both PA and RN are considered simultaneously in the context of genetic analyses, a so-called “genetic correlation” can be obtained; these correlations, when squared, indicate the proportion of shared genetic variance in the two traits. Although not many, the literature contains estimates of such correlations between PA and RN, e.g. .35 [95% confidence interval .16–.52, (Samuelsson et al., 2005)] and .53 [no confidence interval available, (Petrill et al., 2006)]. These estimates suggest that the percent of overlapping genetic variance in these two traits is ~12.3% to 28.1%. Our estimates are closer to the lower value, but are of similar magnitude. As evident from the bottom histograms in Figure 2A and B, the genetic overlap between PA and RN is characterized by one-two genes, whose contributions to the genetic variance are of main (30%) to moderate (14–15%) magnitude. Thus, it is possible that these (this) shared genes (gene) form the basis of the genetic correlations between the two traits.
Discussion
The pair-wise correlations of PA and RN for different types of relative pairs indicated the presence of familiality in their patterning. This familiality, however, could be explained through genetic, environmental, or a combination of both factors. The fact that heritability estimates for both PA and RN were statistically significant suggests that genetic factors do play a role in the manifestation of both of these traits.
Previously, heritability estimates for PP including PA have been reported to range from .3 to .8 (Boada et al., 2002; Byrne et al., 2006; Davis et al., 2001; Francks et al., 2003; Gayan & Olson, 1999, 2003; Petrill et al., 2006). There are fewer studies estimating heritability coefficients for measures of RN; these studies have reported estimates ranging from .1 to .8 (Byrne et al., 2006; Byrne et al., 2007; Davis et al., 2001; Petrill et al., 2006; Samuelsson et al., 2007). However, all of the estimates in the literature present narrow-based heritability estimates (i.e., estimates capturing only additive genetic variance). Thus, although our estimates of heritability appear to “fit” within the wide brackets of the estimates currently available in the literature, when only narrow-sense heritability is considered, our estimates tend to fall in the lower range defined by these brackets. There are a number of factors that substantiate these heritability estimates.
First, much of the prior research was conducted on samples of twins, whereas we sampled families. It is known that heritability estimates obtained through twin samples tend to be somewhat higher than those obtained through family samples (van Beijsterveldt & van Baal, 2002). For example, (Marlow et al., 2001) reported heritability estimates of PA of .3 when assessing sib-pairs and family members. Thus, it is reassuring that, although somewhat lower than twin-based estimates, the estimates obtained from our data appear to be comparable to other estimates available in the literature which were obtained on family rather than twin data.
Second, the majority of the prior studies in which heritability estimates for both PA and RN were obtained [for a review, see (Grigorenko, 2004)] based their ascertainment strategy on recruiting affected individuals and their families. There is evidence suggesting that restricting the sample to affected individuals and their families might increase heritability estimates (Castles, Datta, Gayan, & Olson, 1999). In contrast, and similar to some other studies (Byrne et al., 2007; Byrne et al., 2005; Petrill et al., 2006), our sample was collected from the community to represent the full range of reading ability. Thus, our estimates, although lower than some previous estimates obtained from proband-ascertained samples, are in line with community samples.
Third, most heritability estimates of phonological processes have been conducted in English, a language in which the phonology-orthography link is fairly difficult to master (Goswami, 2003b). This study, to our knowledge, provides first estimates of the heritability of reading-related processes in Russian.
These heritability estimates appear to be reasonable in the context of the results of the segregation analyses.
In summary, these results suggest that there are four to six genes contributing to PA and three to five genes contributing to RN. It appears that, for each trait, each gene mostly contributes uniquely, but there is evidence that at least one, and possibly two genes, contribute pleiotropically to both phenotypes. Based on the analyses of the box plots in Figures 2A and B, it seems that the gene(s) pleiotropically contributing to both PA and RN is(are) of moderate–small effect (again, in these analyses only the total additive and nonadditive genetic variance was modeled). This is why, as per the joint analyses of the traits, the “loss” of a shared gene is more noticeable for RN than for PA.
Thus, in this study, we confirmed previous evidence (Wijsman et al., 2000) suggesting that individual differences in the componential traits of reading (i.e., PA and RN) appear to be controlled by multiple genes of a variety of effects, ranging from very small (<1% of the total genetic variance) to substantial (~ 30% of the total genetic variance). It is important to note that in these data we observed a rather small amount of overlap between the constellations of genes contributing traits to PA and RN, both in the genes themselves and the magnitude of the effects of the shared genes. This finding contradicts the hypothesis that posits the presence of a generalist gene for reading-related componential traits and learning disabilities (Plomin & Kovas, 2005).
Study 2
The purpose of this study was to investigate the robustness, reproducibility, and generalizability of the observations made in Study 1. In other words, having obtained specific information concerning how (through how many genes and of what magnitude) the traits of PA and RN appear to be transmitted across generations, we wanted to evaluate the plausibility of this information. The objective of the study was to effect a “reverse movement” from the data obtained in Study 1 toward an opportunity to compare results obtained in a highly controlled simulation study with the findings available in the literature. Specifically, the general results of a segregation analysis from Study 1 were used to parameterize the simulation of 3,000 unselected sibling families segregating traits of PA and RN.
Methods
We carried out two simulation exercises; these simulations were designed to both confirm and expand our observations from Study 1. Overall, we wanted to investigate the following questions: Given that there appear to be genes that control genetic variance in both traits in a shared and specific manner, what is, empirically, the degree of reliability and precision yielded by unveiling the impact of such genes in the contexts of segregation (first simulation exercise) and linkage (second simulation exercise) analyses?
The first simulation exercise was designed to test the hypothesis that we can detect the influence of both shared and unique genes in simulated data. To simplify both the simulation and the analyses, we simulated two identical quantitative traits and varied the degree of genetic overlap between them. Specifically, we assumed that four genes contributed to each trait. All four genes were of equal effect size; that is, they each contributed 25% of the total genetic variance of the trait. To explore the impact of overlap among the genes, we ran five rounds of simulations based on different scenarios, ranging from the two traits sharing no genes to the two traits sharing all contributing genes (see Figure 3A). The parameters of this exercise were informed by the findings from Study 1.
Figure 3. Diagrams of the simulation scenarios. Circles show genes contributing to the traits uniquely. Diamonds depict shared genes.


A. Simulation scenarios modeling different degrees of overlap among the genes contributing to PA and RN.
B. Simulation scenarios modeling the “detectability” of genetic effects of different magnitudes. The magnitudes of genetic effects are shown with numbers.
The second simulation exercise was designed to test the hypothesis that we can detect genes of both shared and unique effects using genetic-linkage analyses, i.e., the analyses typically used to search for genetic regions harboring SRD-related genes [for a review, see (Grigorenko, 2005; Grigorenko & Naples, in press)]. For this exercise, we used the scenarios depicted in Figure 3B. In each of the three scenarios, we set the genetic variation in both traits as controlled by three genes, with one gene contributing to both traits (i.e., all scenarios involved five genes, see Figure 3B). However, we also set the genes to contribute differentially in terms of their effect sizes across the different scenarios. Specifically, in the first scenario, for the genetic variance, the shared gene contributed to 50% of PA and 45% of RN; in the second, 33% to PA and 33% to RN; whereas in the third, the shared gene contributed to 17% of PA and 22% of RN. The contributions of the unique genes varied and are presented in Figure 3B. This constellation of loadings was modeled using the results of Study 1.
The following steps were used in the simulation study, identically for both exercises 1 (segregation analysis study) and 2 (linkage analyses study). Genotypes and phenotypes were simulated using the Python programming language. We randomly generated 6,000 parents; they were “mated” to form 3,000 families of 2 parents and 2 children each. Eight genes were needed to meet the requirements of all of the scenarios depicted in Figure 3A and B. Because each of these genes contributed to the simulated quantitative traits (modeled PA and RN), we refer to them as quantitative trait loci (QTL).
For simplicity, all genes relevant to the modeled quantitative traits (either PA or RN) were defined as autosomal biallelic loci (QTL 1–8) with equifrequent alleles; all alleles and loci contributed to the traits additively. The variance in each trait was determined by genetic and residual variance; the latter included environmental and polygenetic variance and noise. Specifically, for both traits, the variance was 80% genetic, 10% polygenic, and 10% environmental (including error).
Finally, once the genotypes for each individual were determined, the value of each genotype was established and the overall trait value was calculated additively. For example, in the first simulation exercise, the input of each of the QTL contributing to either of the two traits (PA or RN) was simulated according to pre-set effect size (or the amount of variance effected by the genotype, i.e. the particular combination of alleles, at every QTL, as it accounts for a given portion of the overall genetic variance for the trait). The contribution of each allele combination was also determined by pre-set values. Figure 4 presents an example of how “gene-based values” were used to generate a “behavioral value” for one of the simulated traits, RN. We simulated a 372-marker genome. The marker locations were chosen from the ABI Prism® Linkage Mapping Set, Version 2.5b, and the distances, in cM, were determined using the Marshfield map, the most complete for the markers chosen. The markers on the ABI panel ranged from two to 16 alleles; for simplicity, we chose to use five alleles for each marker. The 8 QTL were randomly placed on regions of interest for reading disability, as identified in a recent meta-analysis (Grigorenko, 2005): 15q, 6p, 2p, 6q, 18p, 11p, 1p, and 3p. The simulation code is available at www.yale.edu/eglab.
Figure 4.

An illustration of how trait values are generated. This illustration matches the first model in Figure 3A. In that model, four unique genes contribute to the variance in PA. For each gene, there is a numeric hypothetical phenotypic value associated with each specific genotype. In this example, an individual has the aa genotype at QTL1, the aa genotype at QTL2, the ab genotype in QTL3, and the bb genotype in QTL4. Each genotype contributes a value to the resulting PA value (shown by numbers). In addition, there are certain amounts of other variance (shown by letters e and p) that reflect polygenic and environmental contributions and noise.
Results
The data simulated in both exercises were subjected to two rounds of analyses. First, we carried out a set of segregation analyses similar to those conducted in Study 1. Second, we conducted a set of genetic linkage analyses to investigate the power to detect the genes influencing correlated traits when a different number of unique and overlapping genes are involved and are of various effect sizes.
Hide and Seek: How Many Genes Can Be Found?
Number of genes found as function of overlap among genes
Here, the datasets simulated according to the scenarios depicted in Figure 3A were subjected to analyses similar to those used in Study 1. The results for the number of genes found are presented in Figure 5A (each box-and-whisker plot represents a summary of the segregation analyses for one simulated model). A number of observations are warranted. First, when the data simulated under Model 1 (Figure 3A) are analyzed for either of the two traits separately (i.e., a trait is generated by a specific set of genes), the results accurately match the simulated data (see box-and-whisker plot 1, Figure 5A). As per these analyses, the trait has three to five controlling genes (posterior probabilities are .267, .697, and .947, correspondingly), and the distribution of results obtained in 20,000 iterations is such that the mean = 4.08 (sd = 0.93), the median = 4, and the mode = 4 (the range of solutions is 1–8). In addition, the analyses present evidence for the presence of four genes of moderate effect (~.45 to .50). Second, box-and-whisker plots 2–6 show the number of genes found in the analyses while regressing out one trait or the other (Models 1–5 in Figure 3A) and the observed pattern of change in these plots corresponds to the anticipated pattern. Specifically, as the number of overlapping genes changes from zero to four (see Models 1–5, Figure 3), the mean number of genes “moves” from 5 to 1 and the shapes of the plots change. Specifically, the “no overlap” scenario generates the following statistics: mean = 4.97, sd = 1.54, mode = 5, median = 5, range 1–10. Notably, the introduction of an overlapping gene (box 3) and subsequent increases in the number of overlapping genes (boxes 4–5) result in a stepwise “loss” of genes (one per box). Box 6 presents the results of no or only one gene found (when found, this gene is of very small effect size, less than .1). The corresponding changes in the moments of the distribution are: (1) one gene shared: mean = 3.16, sd = .49, mode = 3, median = 3, range 1–6; (2) two genes shared: mean = 2.25, sd = .51, mode = 2, median = 2, range 1–4, (3) three genes shared: mean = 1.24, sd = .50, mode = 1, median = 1, range 1–4; and (4) four genes shared: mean = 1.51, sd = 1.31, mode = 1, median = 1, range 1–7. The data on gene effects support these results by capturing the “disappearance” of genes of large and moderate effect. In summary, the results of the segregation analyses are remarkably consistent with the simulated scenarios presented in Figure 3A.
Figure 5. Results from segregation analyses of the data generated in Study 2.


A. Results of first simulation exercise. Box-and-whisker plots present the results of the segregation analyses for one trait (either PA or RN) by itself and then for both traits simultaneously, using simulated data created under scenarios 1–5 as shown in Figure 3A. The X axis shows the number of box-and-whisker plots: Plot #1 depicts the analyses for a single isolated trait; Plots 2–6 correspond to Models 1–5 as illustrated in Figure 3A. The Y axis shows the number of genes identified at least once in the course of 20,000 iterations.
B. Results of the second simulation exercise (simulated scenarios shown in Figure 3B). The X axis shows the number of box-and-whisker plots: Plot 1 depicts the results of the segregation analyses for PA; Plot 5 depicts the results of the segregation analyses for RN; Plots 2–4 show the results of the analyses for PA when RN is regressed out (as per the simulation models shown in Figure 3B); Plots 6–8 show the results of the analyses for RN when PA is regressed out (as per the simulation models shown in Figure 3B). The Y axis shows the number of genes identified at least once in the course of 20,000 iterations.
Number of genes found as a function of effect size
The analyses presented here were carried out on the data simulated based on the scenarios depicted in Figure 3B. Once again, the overall pattern of results from these analyses matched those obtained in Study 1 (see Figure 5B).
Specifically, in simulation scenarios 6–8 (Figure 3B), three genes contributed to PA (the distributions of genetic variance between these three genes was 17%, 33%, and 50%) and three genes contributed to RN (accounting for 22%, 33%, and 45% of genetic variance, respectively); one of these five genes was shared, and the amount of variance this shared gene contributed to each trait varied. Thus, when each trait is considered without covarying out the second trait, so that the “sharedness” of one gene is not included, the analyses determined that three genes, on average, contributed to PA (box-and-whisker plot 1, Figure 5B, mean = 3.56, sd = .95, mode = 3, median = 3, range 1–6) and three genes on average contributed to RN (box-and-whisker plot 5, Figure 5B, mean = 3.44, sd = .94, mode = 3, median = 3, range 1–7). When the magnitude of the contribution of the shared gene to each trait varied and both traits were considered simultaneously in the analyses, the results were as follows: For PA, the change in contribution of the shared gene from 50%, to 30%, to 17% (see Models 6–8, Figure 3B) resulted in an increase in the number of genes detected as contributing to PA (mean = 1.36, sd = .56, mode = 1, median = 1, range 1–4; mean = 2.35, sd = .57, mode = 2, median = 2, range 1–5; mean = 2.82, sd = .96, mode = 3, median = 3, range 1–6 for box-and-whisker plots 2–4 of Figure 5B, respectively). Similarly, for RN, change in the contribution of the shared gene from 45%, to 33%, to 22% also resulted in an increase in the number of genes detected as contributing to RN, although this tendency was less pronounced for RN than for PA (mean = 2.84, sd = .86, mode = 3, median = 3, range 1–6; mean = 2.75, sd = 1.05, mode = 2, median = 3, range 0–7; mean = 3.59, sd = 1.00, mode = 4, median = 4, range 0–7, for box-and-whisker plots 6–8 of Figure 5B, respectively). The differences in the profiles of results for PA and RN when these traits were covaried for each other (box-and-whisker plots 2–4 vs. 6–8, respectively) can be explained by the relative contributions of shared and nonshared genes. For example, when the shared gene contributes substantially more to one trait than another (50% vs. 45%, for PA and RN respectively, as in scenario 1 [Figure 3B]), and the contributions of the “specific” genes are also disproportionately smaller (33% and 17% for PA), the “loss” of the shared gene is more evident (box-and-whisker plot 2) than when the contribution of the shared gene is small (17% for PA and 22% for RN) and the contributions of the “specific” genes disproportionately larger (50% and 33% for PA, box-and-whisker plot 4). In sum, these analyses on the simulated data enhanced our understanding of the differential results obtained for PA and RN in the context of the single-trait analyses and the analyses that included one of the traits as a covariate.
Tug of War: Where are the Genes?
Finally, we wanted to examine one of the simulated datasets that most approximated the patterns revealed through the analyses in Study 1 by means of linkage analyses. The purpose of these analyses was to attempt to map or locate the genes in the genome that contribute to the manifestation of PA and RN. We used the dataset with 372 markers and 6 genes simulated under Model 3 (two shared genes and four unique genes contributing differentially, in pairs, to PA and RN, see Figure 3A). The six contributing genes/markers were placed randomly within the eight regions with positive linkage signals as identified in the literature and specified earlier [15q, 6p, 2p, 6q, 18p, 11p, 1p, and 3p, as described in (Grigorenko, 2005)]. Specifically, the unique contributing markers were placed at 1p (in the candidate region for SRD, DYX8) and 11p (DYX7) for PA and at 15q (DYX1) and 18p (DYX6) for RN; the shared contributing markers were placed at 2p (DYX3) and 6q (DYX4). To analyze the data for linkage, we used the LOKI software (Daw et al., 1999; Daw et al., 2000; Heath, 1997). As mentioned earlier, all four markers influencing the trait contributed equally, and the magnitude of each marker’s effect was 25% of the total genetic variance. As an indicator of the presence of linkage, we used the Bayes factor or L-score (Wijsman & Yu, 2004), the ratio of the prior probability to the posterior probability—that is, the probability that there is no linkage to a region (null hypothesis) to the probability that there is linkage following the completion of the run. A rule of thumb for interpreting L-scores is that scores from 3 to 20 indicate positive evidence, 20 to 150 indicate strong evidence and scores above 150 indicate very strong evidence (Raftery, 1996). To determine the L-score at each location of the simulated genome, the QTLs were histogrammed with bins 1cM wide and plotted (see Figure 6).
Figure 6.

Results from the linkage analyses of the data generated under Model 3 in the first simulation exercise. The results were generated with 20,000 iterations for all of the analyses; however, the results for the phenotype “RN covarying for PA” for chromosome 6 were generated with 200,000 iterations (to ensure that the results were indeed nil results). The vertical black line for each chromosome denotes the location of the “susceptibility” gene. Horizontal lines indicate the upper and lower boundaries for significant L-scores. The intensity of the shade captures the magnitude of the L-score (darker means stronger); the widths of the shade capture the precision with which the location of the signal can be established. The order of the strips is as follows: PA is the top strip, and then PA covarying for RN, then RN and then RN covarying for PA. The abbreviations C1–18 indicate chromosome numbers and QTL1–6 indicate contributing loci in the order in which they were selected at random from the list of eight candidate regions.
The analyses were carried out with 20,000 iterations for each of the four phenotypes: PA, PA covarying for RN, RN, and RN covarying for PA (in the order of appearance in Figure 6). The results are graphically summarized in Figure 6 and numerically summarized below. All six contributing genetic markers were identified, but the pattern of results was somewhat different for PA and RN.
Specifically, for PA, all four contributing loci were detected: L-scoremax = 215.2 for DYX8 (1p, QTL6, unique); L-scoremax = 144.7 for DYX3 (2p, QTL1, shared); L-scoremax = 146.0 for DYX4 (6q, QTL2, shared); and L-scoremax = 306.6 for DYX7 (11p, QTL4, unique). Similarly, the LOKI software properly located all four loci contributing to the RN trait: L-scoremax = 134.4 for DYX3 (2p, QTL1, shared); L-scoremax = 322.54 for DYX4 (6q, QTL2, shared); L-scoremax = 277.6 for DYX1 (15q, QTL3, unique); and L-scoremax = 273.6 for DYX6 (18p, QTL5, unique). Summarizing these results, it is important to note that in general the signals were stronger for unique loci than for shared loci, though there was an exception for DYX4 (6q, QTL2 shared) and RN.
It is also interesting to note that covarying one trait for another did not improve either the intensity or the precision of the signal. Specifically, for the shared loci 2p and 6q, the corresponding L-scores max were 55.6 (PA covarying for RN) and 74.83 (RN covarying for PA) and 59.72 (PA covarying for RN) and .71 (RN covarying for PA), respectively.
Discussion
The results of the analyses of the simulated data were concordant with the profile of the findings and the conclusions from Study 1.
Specifically, first, the results of the segregation analysis conducted on the simulated data support the pattern of results obtained in Study 1 and the plausibility of the theoretical model connecting PA and RN through genetic etiological factors, assuming both shared and unique genetic contributions.
Second, the results also indicated how “sharedness” might not be symmetrical—that one gene can contribute more to one trait than to the other trait and, correspondingly, that the “loss” of the gene when one trait is covaried for another can be more evident for one trait than the other trait when the contribution of the common gene is unequal to the two traits.
Third, when linkage analyses were carried out on the simulated data, similarly to the outcomes of the segregation analyses, we were also able to recover the simulated model. Of interest is that the precision of localization and the magnitude of the genetic effect varied depending on the specifics of the contribution of a particular locus to one of the two modeled traits, PA and RN.
General Discussion and Conclusion
Here we have presented two studies designed to generate insights into the psychological and genetic bases of reading ability and disability as conceptualized through the quantitative traits of PA and RN. Specifically, in the first study, using behavioral indicators of PA and RN from a large genetically informative sample of unselected families, we attempted to validate different models of the etiological relationship between PA and RN. Based on the familiality and heritability patterns, we concluded that the most likely pattern of such relationships involves only partially overlapping genetic etiology for both traits; in other words, both unique and shared genes are involved, and PA and RN have shared but not identical genetic foundations. We used the results from Study 1 to simulate plausible datasets, then conducted a set of analyses intended to validate our findings (Study 2). The results of the simulation studies supported a number of conclusions that we had drawn from our empirical study and strengthened our hypothesis that correlated componential traits characterizing reading ability and disability appear to be receiving both shared and unique contributions from underlying genetic factors. A few issues merit comment along with this general conclusion.
First, based on the results of Study 1, the observed behavioral correlation between PA and RN can be at least partially explained by the presence of genetic correlations. Based on our data, these correlations appear to emerge from a partial overlap in the genetic bases of these traits. Yet, there is reason to believe that this overlap is incomplete, and that the manifestation of both traits is influenced by some additional unique genes. This observation might contribute to or even resolve the discussion on the overlap between PA and RN at the phenotypic level.
Second, it is evident from our results that both traits are influenced by a number of genes. This observation aligns with previous observations on related traits, such as phonological memory (Wijsman et al., 2000). This finding also aligns with the fact that multiple regions of interest are currently under consideration in the field of reading abilities and disabilities (Fisher & Francks, 2006; Grigorenko, 2005) for their contribution to both the holistic phenotype of reading and its components. In this and the context of other recent papers, although not directly tested here, the hypothesis of the over-riding presence of generalist genes (Kovas & Plomin, 2006) contributing to all learning disabilities does not seem readily supportable. In addition, it appears that the contributing genes vary in their magnitude effects; not all of them are small, and a number of them might be accounting for a substantial proportion of genetic variance.
Third, the results of our simulation study indicated that our model of unique and shared genes is plausible; the patterns of results obtained in this study largely corresponded, at least in general terms, to our expectations. Thus, we specifically addressed the relationships between PA and RN, but similar analyses could be carried out with a number of correlated traits characterizing reading ability and disability. These results are even more reassuring in the context of the literature delineating the pathway from segregation analyses to the discovery of genes, such as, for example, the literature on Alzheimer’s disease (Daw et al., 2000; Wijsman et al., 2004; Wijsman et al., 2005; Yu et al., 2007).
Fourth, to our knowledge, this is one of only a few large-scale genetically informative studies of the familiality/heritability of PA and RN in a language other than English. We specifically selected Russian, which is substantially more phonologically transparent than English, yet not as transparent as Finnish, Turkish, or Swahili. This “position” of the Russian language permits more balanced studies of PA and RN: the emphasis on accuracy, of which PA is typically a good predictor, is not as heavy as in English, and the emphasis on fluency, of which RN is typically a good predictor, is not as heavy as in Finnish or Turkish. Given the growing appreciation of the hypothesis that English is a very particular orthographic system (Share, in press), it appears that more information is needed about other orthographic systems to appreciate both the position of English orthography and the biological machinery behind reading. This study adds to a growing number of studies contributing to the understanding reading in languages other than English and to the discernment of the genetic bases of reading ability and disability in these languages [e.g., Swedish, Finnish, German]. These studies are important to understanding the fine aspects of within- (e.g., twins and siblings) and cross- (e.g., parents and children) generational transmission of reading-related skills.
Finally, a special comment should be made with regard to the power of genetic studies aimed at understanding familial patterns of transmission of reading and reading-related traits and their genetic bases. It is obvious that for the detection of many genes of moderate–small effects, the direction in which the field seems to be moving, large sample sizes are needed for the successful identification and localization of the signals.
This study also has a number of limitations. First, we used an unselected, representative sample of families, and it is possible that familiality and heritability estimates would have been larger if the sample had been ascertained through probands whose performance on reading and reading-related tasks was deficient. Such a sample might have been formed from our dataset, using the conventional segment of 15–25% of the lowest performance bracket, but this sample would have had substantially less power. Thus, our findings are interpretable only with regard to a general, population, not a disabled one. Second, these results are limited to two traits only, PA and RN, while modern models of reading are much more sophisticated and engage several other reading-related processes and representations. Future research might expand our models to include additional reading-related traits. Third, given the size of the sample and the distribution of ages among our participants, we were limited in both the time spent with each participant in the individual testing sessions and by the availability of assessments that work well across ages. It will be important to confirm our results in studies where convergent operators (i.e., multiple assessments of the same trait) are used to minimize measurement error and maximize the precision in measuring PA and RN. Fourth, in this sample we did not have molecular-genetic data and including such data would be quite important for the verification of the observations made in this study. Finally, although our simulation studies and analyses were more extensive than presented here, they were illustrative, not conclusive. That is, although we generated multiple datasets for exploration purposes and observed results that appeared internally consistent, we presented here only a single randomly chosen dataset per model for demonstration purposes, leaving a more elaborate and systematic exploration of the robustness of our conclusions for further methodological research.
Despite these limitations, however, the study contributes to the growing body of literature on the etiology of reading and reading-related processes and provides an illustration of how a genetically informed design might contribute to the development and verification of psychological theories. The study makes contributions to the field by (1) presenting a large community sample of families; (2) providing insights into the etiology of reading development in Russian; (3) investigating the etiological relationships between phonological awareness and rapid naming in both real and simulated datasets; and (4) contributing to the verification of the theories of typical and atypical reading development.
Figure 1. Theoretical models of unique and shared genetic etiologies of PA and RN.
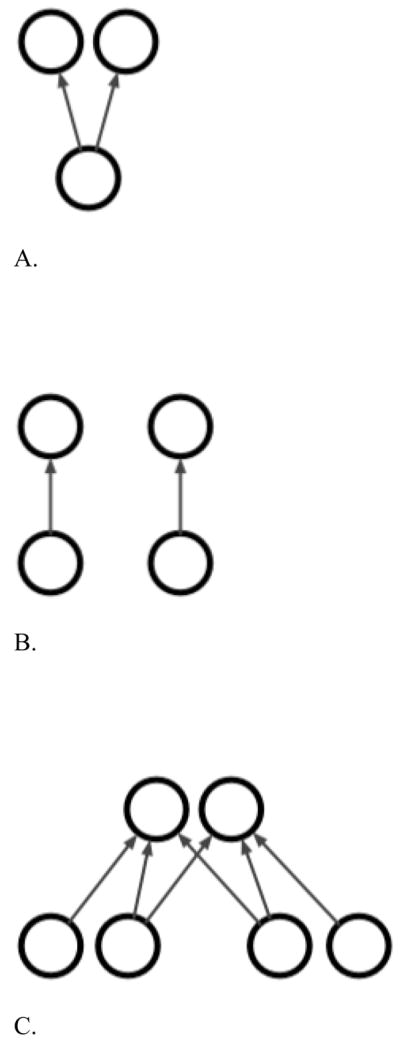
A. PA and RN are different manifestations of the same underlying process with a common/shared etiology.
B. PA and RN are distinct processes with distinct etiologies.
C. PA and RN are phenomenologically and etiologically partially overlapping processes.
Acknowledgments
This work was supported by a grant from the International Dyslexia Association (PIs: Grigorenko and Katz), by grants R206R00001 from the Javits Act Program administered by the Institute for Educational Sciences, U.S. Department of Education (PI: Grigorenko), and NICHD01994 (PI: Fowler), DC007665 (PI: Grigorenko), HD048830 (PI: Pugh), and PO HD052120 (PI: Wagner) from the National Institutes of Health. Grantees undertaking such projects are encouraged to freely express their professional judgment. This article, therefore, does not necessarily represent the position or policies of the IDA, IES or the NIH, and no official endorsement should be inferred. The authors express sincere gratitude to Ms. Robyn Rissman, Ms. Kelly Nedwick, and Ms. Mei Tan for their editorial assistance.
Footnotes
Russian and English have major differences in the areas of phonology, morphology, orthography, and syntax, and thus, through comparative research, studies of Russian can enrich the field’s understanding of both language-universal and language-specific difficulties in mastering reading.
Broad-sense heritability reflects all of the possible genetic contributions to a population’s phenotypic variance; it includes effects due to allelic variation (additive variance), dominance variation (the differential impact of specific alleles at the same locus), and epistatic variation (multi-allelic or multi-genic interactions).
Narrow-sense heritability quantifies only the portion of the phenotypic variation that is additive (allelic).
These technical details are available from the authors.
Publisher's Disclaimer: This is a PDF file of an unedited manuscript that has been accepted for publication. As a service to our customers we are providing this early version of the manuscript. The manuscript will undergo copyediting, typesetting, and review of the resulting proof before it is published in its final citable form. Please note that during the production process errors may be discovered which could affect the content, and all legal disclaimers that apply to the journal pertain.
References
- Ackerman PT, Dykman RA. Phonological processes, immediate memory, and confrontational naming in dyslexia. Journal of Learning Disabilities. 1993;26:597–609. doi: 10.1177/002221949302600910. [DOI] [PubMed] [Google Scholar]
- Ackerman PT, Dykman RA. The speed factor and learning disabilities: The toll of slowness in adolescents. Dyslexia: An International Journal of Research & Practice. 1996;2:1–21. [Google Scholar]
- Ackerman PT, Dykman RA, Oglesby D. Visual event-related potentials of dyslexic children to rhyming and nonrhyming stimuli. Journal of Clinical & Experimental Neuropsychology. 1994;16:138–154. doi: 10.1080/01688639408402624. [DOI] [PubMed] [Google Scholar]
- Ackerman PT, Holloway CA, Youngdahl PL, Dykman RA. The double-deficit theory of reading disability does not fit all. Learning Disabilities Research & Practice. 2001;16:152–160. [Google Scholar]
- Agnew JA, Dorn C, Eden GF. Effect of intensive training on auditory processing and reading skills. Brain and Language. 2004;88:21–25. doi: 10.1016/s0093-934x(03)00157-3. [DOI] [PubMed] [Google Scholar]
- Allor JH. The relationships of phonemic awareness and rapid naming to reading development. Learning Disability Quarterly. 2002;25:47–57. [Google Scholar]
- Almasy L, Porjesz B, Blangero J, Chorlian DB, O’Connor SJ, Kuperman S, et al. Heritability of event-related brain potentials in families with a history of alcoholism. American Journal of Medical Genetics. 1999;88:383–390. [PubMed] [Google Scholar]
- Anthony JL, Lonigan CJ, Burgess SR, Driscoll K, Phillips BM, Cantor BG. Structure of preschool phonological sensitivity: Overlapping sensitivity to rhyme, words, syllables, and phonemes. Journal of Experimental Child Psychology. 2002;82:65–92. doi: 10.1006/jecp.2002.2677. [DOI] [PubMed] [Google Scholar]
- Atchley RA, Halderman L, Kwasny K, Buchanan L. The processing of pseudohomophones by adults with a history of developmental language disabilities. Brain and Cognition. 2003;53:139–144. doi: 10.1016/s0278-2626(03)00096-4. [DOI] [PubMed] [Google Scholar]
- Berends IE, Reitsma P. Remediation of fluency: Word specific or generalised training effects? Reading and Writing. 2006;19:221–234. [Google Scholar]
- Bird J, Bishop DVM, Freeman NH. Phonological awareness and literacy development in children with expressive phonological impairments. Journal of Speech and Hearing Research. 1995;38:446–462. doi: 10.1044/jshr.3802.446. [DOI] [PubMed] [Google Scholar]
- Blachman BA, Schatschneider C, Fletcher JM, Francis D, Clonan SM, Shaywitz BA, et al. Effects of intensive reading remediation for second and third graders and a 1-year follow-up. Journal of Educational Psychology. 2004;96:444–461. [Google Scholar]
- Boada R, Willcutt EG, Tunick RA, Chabildas NA, Olson RK, DeFries JC, et al. A twin study of the etiology of high reading ability. Reading and Writing: An Interdisciplinary Journal. 2002;15:683–707. [Google Scholar]
- Boehnke M, Young MR, Moll PP. Comparison of sequential and fixed-structure sampling of pedigrees in complex segregation analysis of a quantitative trait. American Journal of Human Genetics. 1988;43:336–343. [PMC free article] [PubMed] [Google Scholar]
- Bonney GE, Lathrop GM, Lalouel JM. Combined linkage and segregation analysis using regressive models. American Journal of Human Genetics. 1988;43:29–37. [PMC free article] [PubMed] [Google Scholar]
- Bowers PG, Ishaik G. RAN’s contribution to understanding reading disabilities. In: Swanson L, Harris KR, editors. Handbook of learning disabilities. New York, NY: Guilford Press; 2003. pp. 140–157. [Google Scholar]
- Bowers PG, Sunseth K, Golden J. The route between rapid naming and reading progress. Scientific Studies of Reading. 1999;3:31–53. [Google Scholar]
- Bowers PG, Wolf M. Theoretical links among naming speed, precise timing mechanisms, and orthographic skill in dyslexia. Reading & Writing. 1993;6:69–86. [Google Scholar]
- Brady SA. Ability to encode phonological representations: An underlying difficulty of poor readers. In: Blachman BA, editor. Foundations of reading acquisition and dyslexia: Implications for early intervention. Mahwah, NJ, US: Lawrence Erlbaum Associates, Publishers; 1997. pp. 21–47. [Google Scholar]
- Brkanac Z, Chapman NH, Igo RPJ, Matsushita MM, Nielsen K, Berninger VW, et al. Genome scan of a nonword repetition phenotype in families with dyslexia: Evidence for multiple loci. Behavior Genetics. doi: 10.1007/s10519-008-9215-2. in press. [DOI] [PMC free article] [PubMed] [Google Scholar]
- Bruck M. Persistence of dyslexics’ phonological awareness deficits. Developmental Psychology. 1992;28:874–886. [Google Scholar]
- Bus AG, van IJzendoorn MH. Phonological awareness and early reading: A meta-analysis of experimental training studies. Journal of Educational Psychology. 1999;91:403–414. [Google Scholar]
- Byrne B, Olson RK, Samuelsson S, Wadsworth S, Corley R, DeFries JC, et al. Genetic and environmental influences on early literacy. Journal of Research in Reading. 2006;29:33–49. [Google Scholar]
- Byrne B, Samuelsson S, Wadsworth S, Hulslander J, Corley R, DeFries JC, et al. Longitudinal twin study of early literacy development: Preschool through Grade 1. Reading & Writing. 2007;20:77–102. [Google Scholar]
- Byrne B, Wadsworth S, Corley R, Samuelsson S, Quain P, DeFries JC, et al. Longitudinal twin study of early literacy development: Preschool and kindergarten phases. Scientific Studies of Reading. 2005;9:219–235. [Google Scholar]
- Cardoso-Martins C, Pennington BF. The relationship between phoneme awareness and rapid serial naming skills and literacy acquisition: The role of developmental period and reading ability. Scientific Studies of Reading. 2004;8:27–52. [Google Scholar]
- Castles A, Coltheart M. Is there a causal link from phonological awareness to success in learning to read? Cognition. 2004;91:77–111. doi: 10.1016/s0010-0277(03)00164-1. [DOI] [PubMed] [Google Scholar]
- Castles A, Datta H, Gayan J, Olson RK. Genetic influences on subtypes of developmental dyslexia. Experimental Child Psychology. 1999;72:73–94. doi: 10.1006/jecp.1998.2482. [DOI] [PubMed] [Google Scholar]
- Catts HW, Gillispie M, Leonard L, Kail RV, Miller CA. The role of speed of processing, rapid naming, and phonological awareness in reading achievement. Journal of Learning Disabilities. 2002;35:509–524. doi: 10.1177/00222194020350060301. [DOI] [PubMed] [Google Scholar]
- Compton DL. Modeling the relationship between growth in rapid naming speed and growth in decoding skill in first-grade children. Journal of Educational Psychology. 2003;95:225–239. [Google Scholar]
- Compton DL, DeFries JC, Olson RK. Are RAN and phonological awareness deficits additive in children with reading disabilities? Dyslexia: An International Journal of Research & Practice. 2001;7:125–149. doi: 10.1002/dys.198. [DOI] [PubMed] [Google Scholar]
- Davis CJ, Gayan J, Knopik VS, Smith SD, Cardon LR, Pennington BF, et al. Etiology of reading difficulties and rapid naming: The Colorado Twin Study of reading disability. Behavior Genetics. 2001;31:625–635. doi: 10.1023/a:1013305730430. [DOI] [PubMed] [Google Scholar]
- Daw EW, Heath SC, Wijsman EM. Multipoint oligogenic analysis of age-at-onset data with applications to Alzheimer’s disease pedigrees. American Journal of Human Genetics. 1999;64:839–851. doi: 10.1086/302276. [DOI] [PMC free article] [PubMed] [Google Scholar]
- Daw EW, Payami H, Nemens EJ, Nochlin D, Bird TD, Schellenberg GD, et al. The number of trait loci in late-onset Alzheimer disease. American Journal of Human Genetics. 2000;66:196–204. doi: 10.1086/302710. [DOI] [PMC free article] [PubMed] [Google Scholar]
- de Jong P, Olson RK. Early predictors of letter knowledge. Journal of Experimental Child Psychology. 2004;88:254–273. doi: 10.1016/j.jecp.2004.03.007. [DOI] [PubMed] [Google Scholar]
- de Jong P, van der Leij A. Effects of phonological abilities and linguistic comprehension on the development of reading. Scientific Studies of Reading. 2002;6:51–77. [Google Scholar]
- de Jong P, Vrielink LO. Rapid automatic naming: Easy to measure, hard to improve. Annals of Dyslexia. 2004;54:65–88. doi: 10.1007/s11881-004-0004-1. [DOI] [PubMed] [Google Scholar]
- Denckla M, Cutting L. History and significance of rapid automatized naming. Annals of Dyslexia. 1999;49:29–42. [Google Scholar]
- Denckla M, Rudel R. Rapid “automatized” naming of pictured objects, colors, letters and numbers by normal children. Cortex. 1974;10:186–202. doi: 10.1016/s0010-9452(74)80009-2. [DOI] [PubMed] [Google Scholar]
- Duncan LG, Johnston RS. How does phonological awareness relate to nonword reading skill amongst poor readers? Reading & Writing. 1999;11:405–439. [Google Scholar]
- Elston RC. Segregation analysis. Advances in Human Genetics. 1981;11:372–373. doi: 10.1007/978-1-4615-8303-5_2. [DOI] [PubMed] [Google Scholar]
- Fawcett AJ, Nicolson RI. Naming speed in children with dyslexia. Journal of Learning Disabilities. 1994;27:641–646. doi: 10.1177/002221949402701004. [DOI] [PubMed] [Google Scholar]
- Fawcett AJ, Nicolson RI. Persistence of phonological awareness deficits in older children with dyslexia. Reading and Writing. 1995;7:361–376. [Google Scholar]
- Felton RH. Early identification of children at risk for reading disabilities. Topics in Early Childhood Special Education. 1992;12:212–229. [Google Scholar]
- Fisher SE, Francks C. Genes, cognition and dyslexia: learning to read the genome. Trends in Cognitive Sciences. 2006;10:250–257. doi: 10.1016/j.tics.2006.04.003. [DOI] [PubMed] [Google Scholar]
- Francks C, Fisher SE, Marlow AJ, MacPhie IL, Taylor KE, Richardson AJ, et al. Familial and genetic effects on motor coordination, laterality, and reading-related cognition. American Journal of Psychiatry. 2003;160:1970–1977. doi: 10.1176/appi.ajp.160.11.1970. [DOI] [PubMed] [Google Scholar]
- Galaburda AM, LoTurco JJ, Ramus F, Fitch RH, Rosen GD. From genes to behavior in developmental dyslexia. Nature Neuroscience. 2006;9:1213–1217. doi: 10.1038/nn1772. [DOI] [PubMed] [Google Scholar]
- Gayan J, Olson RK. Reading disability: Evidence for a genetic etiology. Europena Child and Adolsecent Psychiatry. 1999;8:52–55. doi: 10.1007/pl00010695. [DOI] [PubMed] [Google Scholar]
- Gayan J, Olson RK. Genetic and environmental influences on individual differences in printed word recognition. Journal of Experimental Child Psychology. 2003;84:97–123. doi: 10.1016/s0022-0965(02)00181-9. [DOI] [PubMed] [Google Scholar]
- Gonzalez JEJ, Valle IH. Word identification and reading disorders in the Spanish language. Journal of Learning Disabilities. 2000;33:44–60. doi: 10.1177/002221940003300108. [DOI] [PubMed] [Google Scholar]
- Goswami U. Phonology, learning to read and dyslexia: A cross-linguistic analysis. Dyslexia: Different brain, different behavior. In: Csepe V, editor. Neuropsychology and cognition. Vol. 23. New York, NY: Kluwer Academic/Plenum Publishers; 2003a. pp. 1–40. [Google Scholar]
- Goswami U. Why theories about developmental dyslexia require developmental designs. Trends in Cognitive Sciences. 2003b;7:534–540. doi: 10.1016/j.tics.2003.10.003. [DOI] [PubMed] [Google Scholar]
- Grigorenko EL. Genetic bases of developmental dyslexia: A capsule review of heritability estimates. Enfance. 2004;3:273–287. [Google Scholar]
- Grigorenko EL. A conservative meta-analysis of linkage and linkage-association studies of developmental dyslexia. Scientific Studies of Reading. 2005;9:285–316. [Google Scholar]
- Grigorenko EL, Naples AJ. The devil is in the details: Decoding the genetics of reading. In: McCardle P, Pugh K, editors. Helping children learn to read: Current issues and new directions in the integration of cognition, neurobiology and genetics of reading and dyslexia. New York, NY: Psychological Press; in press. [Google Scholar]
- Heath SC. Markov Chain Monte Carlo segregation and linkage analysis for oligogenic models. American Journal of Human Genetics. 1997;61:748–760. doi: 10.1086/515506. [DOI] [PMC free article] [PubMed] [Google Scholar]
- Hoien T, Lundberg I, Stanovich KE, Bjaalid IK. Components of phonological awareness. Reading and Writing. 1995;7:171–188. [Google Scholar]
- Igo RPJ, Wijsman EM. Empirical significance values for linkage analysis: trait simulation using posterior model distributions from MCMC oligogenic segregation analysis. Genetic Epidemiology. 2008;32:119–131. doi: 10.1002/gepi.20267. [DOI] [PubMed] [Google Scholar]
- Katzir T, Kim Y, Wolf M, O’Brien B, Kennedy B, Lovett M, et al. Reading fluency: The whole is more than the parts. Annals of Dyslexia. 2006;56:51–82. doi: 10.1007/s11881-006-0003-5. [DOI] [PubMed] [Google Scholar]
- Kerins M. The effects of systematic reading instruction on three classifications of readers. Reading Research and Instruction. 2006;45:243–260. [Google Scholar]
- Korhonen TT. The persistence of rapid naming problems in children with reading disabilities--a 9-year follow-up. Journal of Learning Disabilities. 1995;28:232–239. doi: 10.1177/002221949502800405. [DOI] [PubMed] [Google Scholar]
- Korkman M, Barron-Linnankoski S, Lahti-Nuuttila P. Effects of age and duration of reading instruction on the development of phonological awareness, rapid naming, and verbal memory span. Developmental Neuropsychology. 1999;16:415–431. [Google Scholar]
- Kovas Y, Plomin R. Generalist genes: implications for the cognitive sciences. Trends in Cognitive Sciences. 2006;10:198–203. doi: 10.1016/j.tics.2006.03.001. [DOI] [PubMed] [Google Scholar]
- LaBerge D, Samuels SJ. Toward a theory of automatic information processing in reading. Cognitive Psychology. 1974;6:293–323. [Google Scholar]
- Lalouel JM, Rao DC, Morton NE, Elston RC. A unified model for complex segregation analysis. American Journal of Human Genetics. 1983;35:816–826. [PMC free article] [PubMed] [Google Scholar]
- Landerl K. Word recognition deficits in German: more evidence from a representative sample. Dyslexia: An International Journal of Research & Practice. 2001;7:183–196. doi: 10.1002/dys.199. [DOI] [PubMed] [Google Scholar]
- Landerl K, Wimmer H. Deficits in phoneme segmentation are not the core problem of dyslexia: Evidence from German and English children. Applied Psycholinguistics. 2002;21:243–262. [Google Scholar]
- Lyon GR. Part I. Defining dyslexia, comorbidity, teachers’ knowledge of language and reading. Annals of Dyslexia. 2003;53:1–14. [Google Scholar]
- Lyytinen H, Ahonen T, Eklund K, Guttorm T, Kulju P, Laakso ML, et al. Early development of children at familial risk for dyslexia--follow-up from birth to school age. Dyslexia: An International Journal of Research & Practice. 2004;10:146–178. doi: 10.1002/dys.274. [DOI] [PubMed] [Google Scholar]
- Manis FR, Seidenberg MS, Doi LM. See Dick Ran: Rapid naming and the longitudinal prediction of reading subskills in first and second graders. Scientific Studies of Reading. 1999;3:129–157. [Google Scholar]
- Marlow AJ, Fisher SE, Richardson AJ, Francks C, Talcott JB, Monaco AP, et al. Investigation of quantitative measures related to reading disability in a large sample of sib-pairs from the UK. Behavior Genetics. 2001;31:219–230. doi: 10.1023/a:1010209629021. [DOI] [PubMed] [Google Scholar]
- Meyer MS, Wood FB, Hart LA, Felton RH. Longitudinal course of rapid naming in disabled and nondisabled readers. Annals of Dyslexia. 1998;48:91–114. [Google Scholar]
- Miller CJ, Miller SR, Bloom JS, Jones L, Lindstrom W, Craggs J, et al. Testing the double-deficit hypothesis in an adult sample. Annals of Dyslexia. 2006;56:83–102. doi: 10.1007/s11881-006-0004-4. [DOI] [PubMed] [Google Scholar]
- Misra M, Katzir T, Wolf M, Poldrack R. Neural systems for rapid automatized naming in skilled readers: Unravelling the RAN-reading relationship. Scientific Studies of Reading. 2004;8:241–256. [Google Scholar]
- Mody M, Studdert-Kennedy M, Brady S. Speech perception deficits in poor readers: Auditory processing or phonological coding? Journal of Experimental Child Psychology. 1997;64:199–231. doi: 10.1006/jecp.1996.2343. [DOI] [PubMed] [Google Scholar]
- Muller K, Brady S. Correlates of early reading performance in a transparent orthography. Reading and Writing. 2001;14:757–799. [Google Scholar]
- NCI-NHGRI Working Group on Replication in Association Studies. Chanock SJ, Manolio T, Boehnke M, Boerwinkle E, Hunter DJ, et al. Replicating genotype-phenotype associations. Nature. 2007;447:655–660. doi: 10.1038/447655a. [DOI] [PubMed] [Google Scholar]
- Nopola-Hemmi J, Myllyluoma B, Voutilainen A, Leinonen S, Kere J, Ahonen T. Familial dyslexia: neurocognitive and genetic correlation in a large Finnish family. Developmental Medicine and Child Neurology. 2002;44:580–586. doi: 10.1017/s0012162201002614. [DOI] [PubMed] [Google Scholar]
- Pennington BF, Cardoso-Martins C, Green PA, Lefly DL. Comparing the phonological and double deficit hypotheses for developmental dyslexia. Reading and Writing. 2001;14:707–755. [Google Scholar]
- Petrill SA, Deater-Deckard K, Thompson LA, DeThorne LS, Schatschneider C. Genetic and environmental effects of serial naming and phonological awareness on early reading outcomes. Journal of Educational Psychology. 2006;98:112–121. doi: 10.1037/0022-0663.98.1.112. [DOI] [PMC free article] [PubMed] [Google Scholar]
- Plomin R, Kovas Y. Generalist genes and learning disabilities. Psychological Bulletin. 2005;131:592–617. doi: 10.1037/0033-2909.131.4.592. [DOI] [PubMed] [Google Scholar]
- Pratt AC, Brady S. Relation of phonological awareness to reading disability in children and adults. Journal of Educational Psychology. 1988;80:319–323. [Google Scholar]
- Pugh KR, Mencl WE, Jenner AR, Lee JR, Katz L, Frost SJ, et al. Neuroimaging studies of reading development and reading disability. Learning Disabilities Research & Practice. 2001;16:240–249. doi: 10.1002/1098-2779(2000)6:3<207::AID-MRDD8>3.0.CO;2-P. [DOI] [PubMed] [Google Scholar]
- Puolakanaho A, Ahonen T, Aro M, Eklund K, Leppanen P, Poikkeus AM, et al. Very early phonological and language skills: estimating individual risk of reading disability. Journal of Child Psychology and Psychiatry. 2007;48:923–931. doi: 10.1111/j.1469-7610.2007.01763.x. [DOI] [PubMed] [Google Scholar]
- Raftery AE. Approximate Bayes factors and accounting for model uncertainty in generalised linear models. Biometrika. 1996;83:251–266. [Google Scholar]
- Ramus F, Szenkovits G. What phonological deficit? The Quarterly Journal of Experimental Psychology. 2008;61:129–141. doi: 10.1080/17470210701508822. [DOI] [PubMed] [Google Scholar]
- Rosner J. Test of auditory analysis skills. Novato, CA: Academic Therapy Publications; 1999. [Google Scholar]
- Samuelsson S, Byrne B, Quain P, Corley R, DeFries JC, Wadsworth S, et al. Environmental and genetic influences on pre-reading skills in Australia, Scandinavia, and the U.S. Journal of Educational Psychology. 2005;97:705–722. [Google Scholar]
- Samuelsson S, Olson RK, Wadsworth S, Corley R, DeFries JC, Willcutt E, et al. Genetic and environmental influences on prereaidng skills and early reading and spelling development in the United States, Australia, and Scandinavia. Reading & Writing. 2007;20:51–75. [Google Scholar]
- Savage RS. Motor skills, automaticity and developmental dyslexia: A review of the research literature. Reading and Writing. 2004;17:301–324. [Google Scholar]
- Savage RS, Frederickson N. Evidence of a highly specific relationship between rapid automatic naming of digits and text-reading speed. Brain and Language. 2005;93:152–159. doi: 10.1016/j.bandl.2004.09.005. [DOI] [PubMed] [Google Scholar]
- Savage RS, Frederickson N. Beyond phonology: What else is needed to describe the problems of below-average readers and spellers? Journal of Learning Disabilities. 2006;39:399–413. doi: 10.1177/00222194060390050301. [DOI] [PubMed] [Google Scholar]
- Scarborough HS, Ehri LC, Olson RK, Fowler AE. The fate of phonemic awareness beyond the elementary school years. Scientific Studies of Reading. 1998;2:115–142. [Google Scholar]
- Schatschneider C, Carlson CD, Francis D, Foorman BR, Fletcher JM. Relationship of rapid automatized naming and phonological awareness in early reading development. Journal of Learning Disabilities. 2002;35:245–256. doi: 10.1177/002221940203500306. [DOI] [PubMed] [Google Scholar]
- Schatschneider C, Francis D, Foorman BR, Fletcher JM, Mehta P. The dimensionality of phonological awareness: an application of item response theory. Journal of Educational Psychology. 1999;91:439–449. [Google Scholar]
- Semrud-Clikeman M, Guy K, Griffin JD, Hynd GW. Rapid naming deficits in children and adolescents with reading disabilities and attention deficit hyperactivity disorder. Brain and Language. 2000;74:70–83. doi: 10.1006/brln.2000.2337. [DOI] [PubMed] [Google Scholar]
- Shankweiler DP, Crain S. Language mechanisms and reading disorders: A modular approach. Cognition. 1986;24:139–168. doi: 10.1016/0010-0277(86)90008-9. [DOI] [PubMed] [Google Scholar]
- Share D. On the Anglocentricities of current reading research and practice: the perils of overreliance on an “outlier” orthography. Psychological Bulletin. doi: 10.1037/0033-2909.134.4.584. in press. [DOI] [PubMed] [Google Scholar]
- Shaywitz BA, Samuels SJ, Blachman BA, Pugh KR, Fulbright RK, Skudlarski P, et al. Development of left occipitotemporal systems for skilled reading in children after a phonologically-based intervention. Biological Psychiatry. 2004;55:926–933. doi: 10.1016/j.biopsych.2003.12.019. [DOI] [PubMed] [Google Scholar]
- Siegel LS. Basic cognitive processes and reading disabilities. In: Swanson KRHHL, Graham S, editors. Handbook of learning disabilities. New York: Guilford Press; 2003. pp. 158–181. [Google Scholar]
- Smith P, Holmes DL. The independence of letter, word, and meaning identification in reading. Reading Research Quarterly. 1971;6:394–415. [Google Scholar]
- Snowling MJ, Nation K, Moxham P, Gallagher A, Frith U. Phonological processing skills of dyslexic students in higher education: A preliminary report. Journal of Research in Reading. 1997;20:31–41. [Google Scholar]
- Snyder LS, Downey DM. Serial rapid naming skills in children with reading disabilities. Annals of Dyslexia. 1995;45:31–49. doi: 10.1007/BF02648211. [DOI] [PubMed] [Google Scholar]
- Spring C, Davis JM. Relations of digit naming speed with three components of reading. Applied Psycholinguistics. 1988;9:315–334. [Google Scholar]
- Spring C, Perry L. Naming speed and serial recall in poor and adequate readers. Contemporary Educational Psychology. 1983;8:141–145. [Google Scholar]
- Sprugevica I, Hoien T. Early phonological skills as a predictor of reading acquisition: A follow-up study from kindergarten to the middle of grade 2. Scandinavian Journal of Psychology. 2003;44:119–124. doi: 10.1111/1467-9450.00329. [DOI] [PubMed] [Google Scholar]
- Stanovich KE. Explaining the differences between the dyslexic and the garden-variety poor reader: The phonological-core variable-difference model. Journal of Learning Disabilities. 1988;21:590–604. doi: 10.1177/002221948802101003. [DOI] [PubMed] [Google Scholar]
- Stanovich KE, Siegel LS. Phenotypic performance profile of children with reading disabilities: A regression-based test of the phonological-core variable-difference model. Journal of Educational Psychology. 1994;86:24–53. [Google Scholar]
- Sung YJ, Thompson EA, Wijsman EM. MCMC-based linkage analysis for complex traits on general pedigrees: multipoint analysis with a two-locus model and a polygenic component. Genetic Epidemiology. 2007;31:103–114. doi: 10.1002/gepi.20194. [DOI] [PubMed] [Google Scholar]
- Swanson L, Harris KR, Graham S. Handbook of learning disabilities. New York: Guilford Press; 2003. [Google Scholar]
- Swanson L, Trainin G, Necoechea DM, Hammill DD. Rapid naming, phonological awareness, and reading: A meta-analysis of the correlation evidence. Review of Educational Research. 2003;73:407–440. [Google Scholar]
- Torgesen JK, Wagner RK, Rashotte CA. Longitudinal studies of phonological processing and reading. Journal of Learning Disabilities. 1994;27:276–286. doi: 10.1177/002221949402700503. [DOI] [PubMed] [Google Scholar]
- Torgesen JK, Wagner RK, Rashotte CA, Burgess SR, Hecht SA. Contributions of phonological awareness and rapid automatic naming ability to the growth of word-reading skills in second- and fifth-grade children. Scientific Studies of Reading. 1997;1:161–185. [Google Scholar]
- Torgesen JK, Wagner RK, Rashotte CA, Rose E, Lindamood P, Conway T, et al. Preventing reading failure in young children with phonological processing disabilities: Group and individual responses to instruction. Journal of Educational Psychology. 1999;91:579–593. [Google Scholar]
- Torppa M, Poikkeus AM, Laakso ML, Eklund K, Lyytinen H. Predicting delayed letter knowledge development and its relation to grade 1 reading achievement among children with and without familial risk for dyslexia. Developmental Psychology. 2006;42:1128–1142. doi: 10.1037/0012-1649.42.6.1128. [DOI] [PubMed] [Google Scholar]
- van Beijsterveldt CE, van Baal GC. Twin and family studies of the human electroencephalogram: a review and a meta-analysis. Biological Psychology. 2002;61:111–138. doi: 10.1016/s0301-0511(02)00055-8. [DOI] [PubMed] [Google Scholar]
- van den Bos KP, Zijlstra BJH, lutje Spelberg HC. Life-span data on continuous-naming speeds of numbers, letters, colors, and pictured objects, and word-reading speed. Scientific Studies of Reading. 2002;6:25–49. [Google Scholar]
- Wagner RK, Torgesen JK. The nature of phonological processing and its causal role in the acquisition of reading skills. Psychological Bulletin. 1987;101:192–212. [Google Scholar]
- Wagner RK, Torgesen JK, Rashotte CA. Development of reading-related phonological processing abilities: New evidence of bidirectional causality from a latent variable longitudinal study. Developmental Psychology. 1994;30:73–87. [Google Scholar]
- Whiteley HE, Smith CD, Connors L. Young children at risk of literacy difficulties: factors predicting recovery from risk following phonologically based intervention. Journal of Research in Reading. 2007;30:249–269. [Google Scholar]
- Wijsman EM, Daw EW, Yu CE, Payami H, Steinbart EJ, Nochlin D, et al. Evidence for a novel late-onset Alzheimer disease locus on chromosome 19p13.2. American Journal of Human Genetics. 2004;75:398–409. doi: 10.1086/423393. [DOI] [PMC free article] [PubMed] [Google Scholar]
- Wijsman EM, Daw EW, Yu X, Steinbart EJ, Nochlin D, Bird TD, et al. APOE and other loci affect age-at-onset in Alzheimer’s disease families with PS2 mutation. American Journal of Medical Genetics. Part B, Neuropsychiatric Genetics. 2005;132:14–20. doi: 10.1002/ajmg.b.30087. [DOI] [PubMed] [Google Scholar]
- Wijsman EM, Peterson D, Leutenegger AL, Thomson JB, Goddard KAB, Hsu L, et al. Segregation analysis of phenotypic components of learning disabilities: I. Nonword memory and digit span. American Journal of Human Genetics. 2000;67:631–646. doi: 10.1086/303044. [DOI] [PMC free article] [PubMed] [Google Scholar]
- Wijsman EM, Yu D. Joint oligogenic segregation and linkage analysis using Bayesian Markov Chain Monte Carlo Methods. Molecular Biotechnology. 2004;28:205–226. doi: 10.1385/MB:28:3:205. [DOI] [PubMed] [Google Scholar]
- Wilson A, Lesaux K. Persistence of phonological processing deficits in college students with dyslexia who have age-appropriate reading skills. Journal of Learning Disabilities. 2001;34:394–401. doi: 10.1177/002221940103400501. [DOI] [PubMed] [Google Scholar]
- Wocadlo C, Rieger I. Phonology, rapid naming and academic achievement in very preterm children at eight years of age. Early Human Development. 2007;83:367–377. doi: 10.1016/j.earlhumdev.2006.08.001. [DOI] [PubMed] [Google Scholar]
- Wolf M, Bowers PG. The double-deficit hypothesis for the developmental dyslexia. Journal of Educational Psychology. 1999;91:415–438. [Google Scholar]
- Wolf M, Miller L, Donnelly K. Retrieval, automaticity, vocabulary, elaboration, orthography (RAVE-O): A comprehensive, fluency-based reading intervention program. Journal of Learning Disabilities. 2000;33:375–386. doi: 10.1177/002221940003300408. [DOI] [PubMed] [Google Scholar]
- Wolf M, O’Rourke AG, Gidney C, Lovett M, Cirino P, Morris R. The second deficit: An investigation of the independence of phonological and naming-speed deficits in developmental dyslexia. Reading & Writing. 2002;15:43–72. [Google Scholar]
- Wolf M, Obregon M. Early naming deficits, developmental dyslexia, and a specific deficit hypothesis. Brain and Language. 1992;42:219–247. doi: 10.1016/0093-934x(92)90099-z. [DOI] [PubMed] [Google Scholar]
- Young A, Bowers PG. Individual difference and text difficulty determinants of reading fluency and expressiveness. Journal of Experimental Child Psychology. 1995;60:428–454. [Google Scholar]
- Yu CE, Seltman H, Peskind ER, Galloway N, Zhou PX, Rosenthal E, et al. Comprehensive analysis of APOE and selected proximate markers for late-onset Alzheimer’s disease: patterns of linkage disequilibrium and disease/marker association. Genomics. 2007;89:655–665. doi: 10.1016/j.ygeno.2007.02.002. [DOI] [PMC free article] [PubMed] [Google Scholar]