

Abstract
Recent studies suggest that an auditory nonlinearity converts second-order sinusoidal amplitude modulation (SAM) (i.e., modulation of SAM depth) into a first-order SAM component, which contributes to the perception of second-order SAM. However, conversion may also occur in other ways such as cochlear filtering. The present experiments explored the source of the first-order SAM component by investigating the ability to detect a 5-Hz, first-order SAM probe in the presence of a second-order SAM masker beating at the probe frequency. Detection performance was measured as a function of masker-carrier modulation frequency, phase relationship between the probe and masker modulator, and probe modulation depth. In experiment 1, the carrier was a 5-kHz sinusoid presented either alone or within a notched-noise masker in order to restrict off-frequency listening. In experiment 2, the carrier was a white noise. The data obtained in both carrier conditions are consistent with the existence of a modulation distortion component. However, the phase yielding poorest detection performance varied across experimental conditions between 0° and 180°, confirming that, in addition to nonlinear mechanisms, cochlear filtering and off-frequency listening play a role in second-order SAM perception. The estimated magnitude of the modulation distortion component ranges from 5%-12%.
I. Introduction
The ability of human listeners to detect slow modulations in the amplitude of incoming sounds is generally understood using models based on either a low-pass filter/integrator (Viemeister, 1979; Moore et al., 1988) or a modulation filterbank (MFB) (Dau et al., 1997a, 1997b). In a modulation-masking study, Strickland and Viemeister (1996) first mentioned the ability to perceive the envelope beat produced by the addition of two closely spaced modulation components, which is a slow modulation in envelope depth. In parallel, electrophysiological work by Shofner et al. (1996) demonstrated that neural units in the ventral cochlear nucleus of the chinchilla show phase-locked responses both to the frequencies of the modulation primaries and to the modulation difference frequency (i.e., the beat frequency) of two-component sinusoidal amplitude modulation (SAM). These findings appeared to be a challenge for current models of temporal-envelope processing, because there was no energy at the beat frequency in the “physical” modulation spectrum of such stimuli. This was interpreted as evidence for the existence of a nonlinearity along the auditory pathway (e.g., compression, saturation, or thresholding) that generates a modulation distortion component at the envelope-beat frequency.
Psychoacoustical evidence consistent with the notion that nonlinear processes are involved in temporal-envelope beat perception was provided by Sheft and Yost (1997) and Moore et al. (1999). In both studies, the listeners' sensitivity to a probe modulator was assessed in the presence of a two-component masker modulator with modulation difference frequency equal to the probe modulation frequency. The probe and masker modulators were either applied to different sinusoidal carriers (Sheft and Yost, 1997) or to the same sinusoidal or narrowband carrier (Moore et al., 1999). Despite the fact that the physical modulation components of the masker were too remote from the probe to yield modulation-masking effects, the results showed that the presence of the beating masker modulators degraded probe-detection thresholds. Taken together, these studies clearly pointed out the need to incorporate an additional nonlinearity into each envelope-processing model to account for the masking data.
The distortion-component hypothesis has received further support from psychoacoustical data on second-order SAM detection (Lorenzi et al., 2001a, 2001b; Füllgrabe and Lorenzi, 2003), that is detection of a sinusoidal modulation applied to the modulation depth of a SAM stimulus. In a masking study, Lorenzi et al. (2001b) compared second-order SAM detection for a 5-kHz sinusoidal carrier and a 2-Hz wide narrowband-noise carrier centered at 5 kHz. The inherent random amplitude fluctuations in the narrowband noise would be expected to mask any modulation components in the low modulation frequency region (Dau et al., 1997a). The results revealed that second-order SAM detection thresholds were worse for the narrowband noise than for the sinusoidal carrier only for the lowest second-order modulation frequencies. This finding provided evidence that detection of a distortion component at the envelope-beat frequency contributed to second-order SAM detection.
The potential role of cochlear compression in producing distortion in the internal modulation spectrum has been tested in psychoacoustical studies on second-order SAM detection conducted with hearing-impaired (Tandetnik et al., 2001; Füllgrabe et al., 2003) and cochlear implant listeners (Lorenzi et al., 2004). In both groups, cochlear compression was either severely reduced or completely abolished by cochlear damage. However, second-order temporal modulation transfer functions (TMTFs) relating second-order SAM detection thresholds to second-order modulation frequency were normal or near-normal in shape in these listeners. This demonstrated that cochlear damage has little disruptive effect on the detection of second-order SAM, and, if a distortion component is actually used in second-order SAM detection, it must be generated by a nonlinearity other than cochlear compression.
One way to explore the type of nonlinearity involved in the generation of envelope distortion is to determine the relative phase of the distortion component. In a modulation-masking experiment using a 5-kHz sinusoidal carrier, Verhey et al. (2003) systematically varied the phase relationship between the probe modulator and the envelope beat cycle of two- and three-component masker modulators. Irrespective of the masker components' modulation frequencies (ranging from 90 to 360 Hz), maximum masking generally occurred in the antiphase (i.e., 180°) condition, where the maxima in the probe modulator coincided with the minima in the beat cycle of the masker envelope. Moreover, when the probe modulation was in-phase with the envelope beat, masked thresholds were lower than those measured in the unmasked condition. Taken together, these observations indicated that the generated distortion component was in-phase with the envelope beat cycle. However, with relatively low (i.e., 40 and 45 Hz) modulation components, the phase-dependent masking effects were less pronounced and maximum masking occurred—when observed—at 90° and 180°. In agreement with the hearing-impaired data discussed above, Verhey et al. (2003) concluded that the distortion component could not be accounted for by a compressive nonlinearity, which would have yielded a 180° out-of-phase distortion component, that is, maximum masking in the 0° condition. By contrast, the masking data were globally consistent with the notion of “venelope” extraction proposed by Ewert et al. (2002). In their functional model of temporal-envelope processing, envelope-beat information is extracted by computing the so-called venelope (the Hilbert envelope of the accoupled Hilbert envelope), which is then attenuated and combined with the first-order SAM. In response to complex temporal envelopes, such a mechanism produces an internal modulation component at the envelope-beat frequency that is in-phase with the envelope beat cycle (Ewert et al., 2002; Verhey et al., 2003), and therefore correctly predicts the empirically obtained maximum masking effects for the antiphase condition.
In an attempt to clarify the phase and magnitude of the distortion component, Sek and Moore (2004) measured psychometric functions for detecting a 5-Hz SAM probe applied to a 4-kHz sinusoidal carrier in the presence of a masker modulator with components at 50 and 55 Hz. This time, performance was poorest when the probe modulation was 135° out-of-phase with the masker envelope beat, similar to the phase effect obtained by Verhey et al. (2003), but not entirely consistent with predictions based on venelope extraction. In addition, as already apparent in masking data obtained by Verhey et al. (2003) using comparable modulation frequencies, the phase effect did vary somewhat across listeners. The effective modulation depth of the distortion component was estimated by Sek and Moore (2004) to be rather weak, at about 3%; however, the authors acknowledged the possibility that the chosen probe phase may not have been optimal to estimate the maximum effective magnitude of the distortion component.
Overall, the preceding studies do not yield fully converging outcomes and showed some degree of inter-listener variability, consistent with the idea that the envelope-beat information may not be converted into a first-order SAM component via a single, presumably nonlinear, mechanism. Ewert et al. (2002) and Verhey et al. (2003) already noted that such a conversion may occur via cochlear filtering, provided subjects make use of the output of an auditory filter that is not centered on the carrier frequency. Introduction of a component at the second-order frequency via cochlear filtering would mainly occur for sinusoidal carriers. However, it is conceivable that such a conversion also occurs for broadband-noise carriers, especially when the frequency of the first-order SAM carrying the second-order modulation is relatively high (Viemeister, 2003).
Our purpose in the present study was therefore to demonstrate the existence of a “genuine” modulation distortion component generated by the auditory system in response to second-order masker modulators, and to evaluate the role of other sources of conversion involved in second-order SAM perception. The experiments reported here addressed these issues by investigating the effect of a second-order masker modulator on the detectability of a first-order probe modulator whose modulation frequency corresponded to the periodicity of the masker's envelope beat. Using different carrier signals, the characteristics (i.e., phase and magnitude) of the modulation distortion component were investigated by measuring detection performance as a function of (i) the carrier (or first-order) modulation frequency of the masker; (ii) the phase relationship between the probe and masker modulator; and (iii) the probe modulation depth.
Finally, previous modulation masking studies exploring the phase of the distortion component used procedures with feedback. Using feedback might have led listeners to use any cue when performing the detection task (rather than choosing the interval where the modulation depth was greater). This issue seems particularly important when a 2IFC procedure is used in which listeners may change their strategy based on feedback. In their second experiment, Sek and Moore (2004) measured psychometric functions for probe modulation detection as a function of probe depth when no feedback was provided; however, they used a phase relationship between the probe and masker modulator that had been obtained in a previous experiment using feedback. Here, in all masking conditions, no feedback was provided; this was intended to allow us to observe genuine effects of cancellation between the probe modulator and first-order SAM component resulting from conversion, when they were out-of-phase.
II. Experiment 1: Masked and Unmasked Modulation Detection Using a Sinusoidal Carrier
A. Rationale
Our aim in this experiment was to extend previously published studies conducted with sinusoidal carriers investigating the nature of the nonlinear mechanism involved in the perception of temporal-envelope beat information. Using a 5-kHz sinusoidal carrier, detection performance for a 5-Hz SAM probe was measured in the presence of a second-order SAM masker fluctuating at the probe frequency, as a function of the relative probe phase. Different masker-carrier modulation frequencies were chosen between 32 and 180 Hz to cover the range of modulation frequencies used in earlier studies (Moore et al., 1999; Verhey et al., 2003; Sek and Moore, 2004). Unlike these studies, the sinusoidal carrier was presented within a notched noise to restrict off-frequency listening. To clarify the effects of off-frequency listening, measurements were replicated when the notched-noise masker was removed. The masking study was preceded by a systematic assessment of the listeners' sensitivity to first- and second-order SAM to ensure that the first-order probe and second-order masker modulations were audible in all experimental conditions.
B. First- and second-order TMTFs
1. Listeners
Three listeners aged 20 to 30 years participated in the experiment. All listeners had audiometric thresholds less than 15 dB HL between 0.25 and 8 kHz. One listener was author CF, who had extensive previous experience with psychoacoustic experiments. The other two were volunteers who were paid for their services. Prior to data collection, all listeners received training for about four hours to stabilize thresholds.
2. Stimuli and procedure
All stimuli were generated with a Personal Computer using a 16-bit D/A converter operating at a sampling frequency of 44.1 kHz, and were delivered diotically via Sennheiser HD 25-13 earphones. The carrier was a 5-kHz sinusoid presented at 70 dB SPL within a notched-noise masker. The masker was obtained by adding a low-pass noise (cutoff frequency=2917 Hz; roll-off=90 dB/octave) and a high-pass noise (cutoff frequency=7500 Hz; roll-off=90 dB/octave) presented at 20 and 7 dB (rms) below the carrier level, respectively. The corresponding noise spectrum was chosen so that the carrier-to-noise ratio would have been high only for a limited range of auditory filter center frequencies close to the carrier frequency (Alcántara et al., 2003). In all experiments, the stimulus duration was 2 s, including 50-ms rise/fall times shaped using a raised-cosine function. All listeners were tested individually in a sound-attenuating booth.
For the measurement of first-order TMTFs, listeners had to detect SAM applied to the sinusoidal carrier. On each trial, a standard and a target stimulus were presented in random order with an interstimulus interval (ISI) of 1 s. The standard corresponded to the unmodulated carrier. The target corresponded to the carrier that was sinusoidally amplitude modulated at a modulation frequency fm of 2, 10, 40, 80, or 160 Hz. The target's temporal envelope is given by
| (1) |
where m is the modulation depth (0≤ m≤1), and φ is the starting phase of the modulation, randomized in each interval. The overall power was the same in both intervals.
SAM detection thresholds were obtained using an adaptive two-interval, two-alternative forced-choice (2I, 2AFC) procedure with a two-down, one-up stepping rule that estimates the modulation depth m necessary for 70.7% correct detection (Levitt, 1971). Listeners received visual feedback after each trial. The step size was initially 4 dB (in terms of 20 log m), and was reduced to 2 dB after the first two reversals. The arithmetic mean of the values of m at the last 10 reversals in a block of 16 reversals was taken as the threshold estimate for that block (reported in %). The final threshold is based on three repeated measures.
For the measurement of second-order TMTFs, listeners had to detect sinusoidal modulation of the modulation depth of first-order SAM. Again, on each trial, a standard and a target stimulus were presented in random order with an ISI of 1 s. The standard had first-order SAM of a given modulation frequency fm and a fixed modulation depth m of 0.5 (i.e., 50%). The expression describing the standard's temporal envelope was
| (2) |
where φ represents the starting phase of the modulation, which was randomized for each interval. The target had SAM whose modulation depth was sinusoidally modulated at a (second-order) modulation frequency . The expression describing the target's temporal envelope was
| (3) |
where m′ is the second-order modulation depth (0≤m′≤0.5) and φ represents the starting phase of the modulations, randomized for each interval. The overall power was the same in both intervals. The carrier modulation frequency fm was either 32, 64, or 180 Hz, and the corresponding second-order modulation frequencies were (i) 2, 5, and 10 Hz, (ii) 2, 5, 10, and 20 Hz, and (iii) 2, 5, 10, 20, 40, and 80 Hz, respectively. Second-order SAM detection thresholds (i.e., m′ at threshold) were obtained using an identical 2I, 2AFC psychophysical procedure to that used to determine first-order SAM detection thresholds.
3. Results and discussion
Individual first- (filled squares) and second-order (open symbols) TMTFs for the three listeners are shown in Fig. 1. In agreement with previous experiments using sinusoidal carriers (Viemeister, 1979; Kohlrausch et al., 2000; Lorenzi et al., 2001b; Moore and Glasberg, 2001), first-order SAM detection thresholds show a low- or all-pass characteristic for the range of fm under study. In all listeners, thresholds are roughly constant (m≈6% or −24 dB expressed as 20 log m) at the lowest modulation frequencies; they tend to increase only slightly with fm for two listeners, but more substantially for listener CF (with a clear increase above 40 Hz). Overall, the thresholds required to detect SAM of a sinusoidal carrier presented in a notched noise are increased by a factor of 3 (10 dB) relative to those obtained in identical but unmasked conditions (Lorenzi et al., 2001b). This difference presumably reflects the contribution of off-frequency listening in the absence of masking noise, which is advantageous because there is less cochlear compression on the high-frequency side of the excitation pattern evoked by the carrier, so the effective magnitude of the modulation is greater on the high-frequency side than at its center (Zwicker, 1956). In addition, some energy from the notched-noise masker may have leaked into the auditory filter centered on the carrier. The fact that the cutoff frequency of the average TMTF is somewhat lower than that reported in previous studies may then be attributed to the increasing masking effect of intrinsic random fluctuations of the notched-noise masker at higher modulation frequencies (Dau et al., 1997a).
FIG. 1.
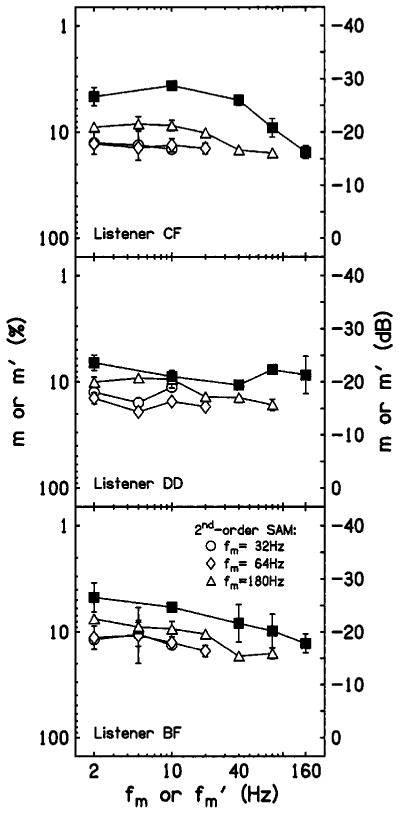
Individual first- (filled squares) and second-order (open symbols) TMTFs for the three listeners using a 5-kHz sinusoidal carrier presented within a notched-noise masker. First- and second-order modulation depths at threshold m and m′ (in %) are plotted as a function of first- and second-order modulation frequency fm and , respectively. The right axis shows detection thresholds in dB (in terms of 20 log m or 20 log m′). The parameter for the second-order TMTFs is the carrier modulation frequency: fm=32 (circles), 64 (diamonds), and 180 Hz (triangles). Error bars represent ± one standard deviation from the mean threshold across three repeated measures.
The second-order TMTFs show roughly constant thresholds for most second-order modulation frequencies, although a low-pass characteristic with a −3 dB cutoff frequency at or above 20 Hz is apparent when fm=180Hz. Moreover, second-order modulation detection thresholds decrease by a factor of 1.5 (3 dB) when fm increases from 32 to 180 Hz. These observations are roughly consistent with data reported by Lorenzi et al. (2001b) for similar carrier modulation frequencies using an unmasked 5-kHz carrier. However, as for first-order SAM detection, the average sensitivity to second-order SAM was consistently poorer by approximately a factor of 3 (10 dB) when off-frequency listening was restricted than when off-frequency listening was possible (Lorenzi et al., 2001b).
C. Detection of a 5-Hz probe modulator in the presence of a 5-Hz, second-order SAM masker: Phase effects
1. Stimuli and procedure
The three listeners used to assess SAM-detection thresholds participated in this experiment. The detectability of a 20%, 5-Hz SAM probe was measured using a 2I, 2AFC procedure with constant stimuli. The probe was applied to a 5-kHz sinusoidal carrier embedded within the notched-noise masker, and presented either:
Alone, without any additional SAM masker (unmasked detection condition).
In the presence of a second-order SAM masker that was applied to the sinusoidal carrier in both intervals. The first-order modulation frequency of the masker was 32, 64, or 180 Hz, while the second-order modulation frequency was fixed at 5 Hz. The first- and second-order modulation depths of the masker modulator were set to 40%. All masker modulation components started in sine phase. Eight phase relationships between the probe and masker modulators were used: 0°, 45°, 90°, 135°, 180°, 225°, 270°, and 315°. In this condition, performance was also assessed without the notched-noise masker.
In the presence of a first-order SAM masker applied to the sinusoidal carrier in both intervals. The probe and masker modulators had identical modulation depths of 20% and modulation frequencies of 5 Hz. As with the second-order masker modulator, the phase relationship between probe and masker modulators was shifted in steps of 45° from 0° to 315°.
The inspection of first- and second-order modulation detection thresholds reported above indicates that in the present experimental conditions, all first- and second-order modulation components were audible when presented individually.
Prior to data collection, listeners received 20 practice trials in each experimental condition. Detection scores presented here are based on 100 trials.
2. Results and discussion
Figure 2 shows individual probe detection scores for the three listeners (columns) as a function of the phase relationship between the probe and the masker modulator. Using a notched-noise masker, detection performance is perfect for all listeners when the 20% probe modulator is presented alone (long-dashed line), and decreases when a second-order masker modulator (open symbols) is added, despite the fact that the individual modulation components of the latter are remote in frequency from the probe modulator. This can be explained in terms of an interaction of the probe modulator with a modulation distortion component produced in response to the second-order modulator: sometimes the probe modulator would have been in-phase with the distortion component, so that they added, and sometimes the two would have been out-of-phase, so that they cancelled. Since no feedback was provided in the masked conditions, a drop of detection performance below chance level for a given phase relationship reflects the fact that listeners tended to choose the standard instead of the target interval as the one containing the more salient 5-Hz SAM, consistent with the notion that the probe modulation was (partially) cancelled.
FIG. 2.
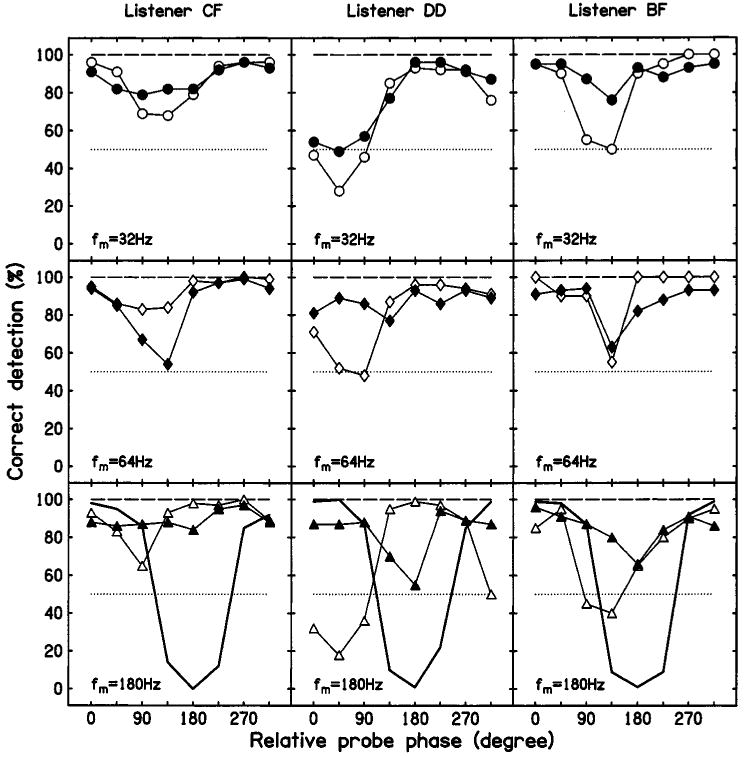
Individual detection scores for 20%, 5-Hz probe modulation of a 5-kHz sinusoidal carrier presented within a notched-noise masker, measured in three listeners (columns). Performance is plotted as a function of the phase relationship between the probe and (i) a 5-Hz, second-order SAM masker for carrier modulation frequencies of 32 (open circles, upper row), 64 (open diamonds, middle row), and 180 Hz (open triangles, lower row); and (ii) a 20%, 5-Hz SAM masker (bold line, lower row). In each panel, unmasked probe detection scores are indicated by the long-dashed line. Filled symbols correspond to masked detection performance when the notched noise was removed. The dotted line represents performance at chance level.
The results show that the phase relationship between the probe and masker modulators leading to the poorest performance does not vary with masker-carrier modulation frequency within the same listener. However, as already observed to a lesser degree in previous studies (Verhey et al., 2003; Sek and Moore, 2004), phase effects do vary across listeners with maximum masking occurring for probe phases of 45° to 135°. Such a shift is not expected if there were a single static nonlinearity, as postulated in the literature (Moore et al., 1999; Verhey et al., 2003), but may be explained by the existence of several static nonlinearities introducing distortion into the internal representation of complex temporal envelopes. The exact contribution of each nonlinearity would have to be listener-specific to account for the observed inter-listener variability.
The replication of the experiment without the notched-noise masker (filled symbols) yields a similar pattern of results for fm=32 Hz in all listeners, but shows important differences for fm=64 and 180 Hz for two out of the three listeners. This suggests that, for the lowest fm under study, the phase effect is not substantially influenced by off-frequency listening. In contrast, but in agreement with recent data reported by Sek and Moore (2004), the maximum decrease in performance for fm=64Hz now occurs consistently around 135°. For listener DD, the phase at which performance is worst is shifted by +45°, relative to what was obtained in the notched-noise condition. An even stronger discrepancy between the results obtained with and without the notched noise is observed for fm=180Hz. Here, two listeners show a clear shift of the phase yielding the poorest performance when the notched-noise masker is removed. The worst detection scores occur at 180° in listeners DD and BF, while no phase-dependent masking effect is observed anymore in listener CF In comparison, Verhey et al. (2003) reported the poorest detection performance systematically occurring at 180° for a wide range of fm, except for the lowest fm under study.
The fact that probe detectability is not only dependent on phase but also varies with fm when the notched noise is removed suggests that listeners use off-frequency listening in certain conditions. Off-frequency listening may influence performance in two ways. First, although there is no modulation component at the second-order frequency in the modulation spectrum of the stimulus, the envelope at the output of an auditory filter tuned away from the signal frequency may contain such a component (e.g., Ewert et al., 2002). Second, basilar-membrane compression is strong for auditory filters tuned close to the signal frequency, but weak for the more remote filters. This might affect the balance between different sources of nonlinearity. This interpretation seems however less likely given the observation that hearing-impaired and cochlear implant listeners show quasi-normal sensitivity to second-order SAM (Tandetnik et al., 2001; Füllgrabe et al., 2003; Lorenzi et al., 2004).
In the present experiment, the clearest indication of conversion via cochlear filtering and off-frequency listening is obtained for two out of the three listeners at fm=180Hz. Here, the phase dependence of probe detectability for a 5-Hz, first-order SAM masker (bold line, lower row) is nearly identical to that measured for the second-order SAM masker.
The present results obtained without a notched-noise masker are at least partially consistent with phase effects previously reported by Verhey et al. (2003) and Sek and Moore (2004), suggesting that off-frequency listening might also have occurred in these studies. This assumption is emphasized by the observation that Verhey et al. (2003) failed to find clear phase-dependent masking effects when a masker modulator with low (i.e., 40 and 45 Hz) components was used. Thus, the masking effects reported by Verhey et al. (2003) and Sek and Moore (2004) may not solely reflect an interaction between the probe and a genuine modulation distortion component.
It is noteworthy that, when a carrier modulation frequency of 64 or 180 Hz and no notched-noise masker was used, listeners reported the presence of a weak high-pitch tone in the standard interval only. Therefore, despite the fact that listeners received instructions to choose the interval containing the most salient 5-Hz modulation, listeners may have used both cues to perform the detection task when no notched noise was used.
III. Experiment 2: Masked and Unmasked Modulation Detection Using Noise Carriers
A. Rationale
The preceding experiment showed that nonlinear mechanisms are indeed involved in the conversion of second-order SAM into a first-order SAM component. However, the results also suggested that, under certain conditions, second-order SAM is converted into a first-order SAM component via cochlear filtering. A similar conversion may occur for broadband-noise carriers, especially when the carrier modulation frequency is high (i.e., greater than the bandwidth of the excited auditory filters). Simulations of the output of cochlear filters were therefore performed to evaluate the existence of this source of conversion for broadband-noise stimuli.
Figure 3 shows the responses of an array of gammatone filters (Patterson et al., 1987) to a 5-Hz, second-order SAM noise (0–20 kHz). Two carrier modulation frequencies [fm=64 (diamonds) and 180 Hz (triangles)] falling within the frequency range of modulation primaries used in previous psychoacoustical studies (Moore et al., 1999; Verhey et al., 2003; Sek and Moore, 2004), and a high carrier modulation frequency of 2 kHz (circles) were used. Modulation depths m and m′ were set to 40%. Also shown are responses to an unmodulated noise (filled squares) and a 8%, 5-Hz (first-order) SAM noise (filled inverted triangles). The magnitude (left panel) and phase (right panel) of the 5-Hz (first-order) SAM component observed at the filter outputs are shown as a function of filter center frequency (CF). For all three carrier modulation frequencies, the data confirm that the responses of cochlear filters (modeled here as linear filters) contain indeed a first-order modulation component at 5 Hz. When fm=2 kHz, a 5-Hz modulation component is observed at all CFs and its magnitude and phase are about the same as those obtained with 8%, 5-Hz (first-order) SAM. In other words, the maxima of this first-order modulation component coincide with the maxima in the envelope beat cycle of the second-order SAM. For the lower carrier modulation frequencies, the 5-Hz modulation component only occurs at the outputs of filters with low CFs (i.e., with ERBs smaller than roughly 2×fm) and its magnitude increases progressively as CF decreases. The 5-Hz modulation component at the outputs of auditory filters with CF-below approximately 300 Hz (when fm=64 Hz) and 1 kHz (whenfm=180 Hz) is roughly in sine phase (i.e., in-phase with the second-order SAM). For filters with higher CFs, the modulation component shifts progressively out-of-phase with the second-order modulator.
FIG. 3.
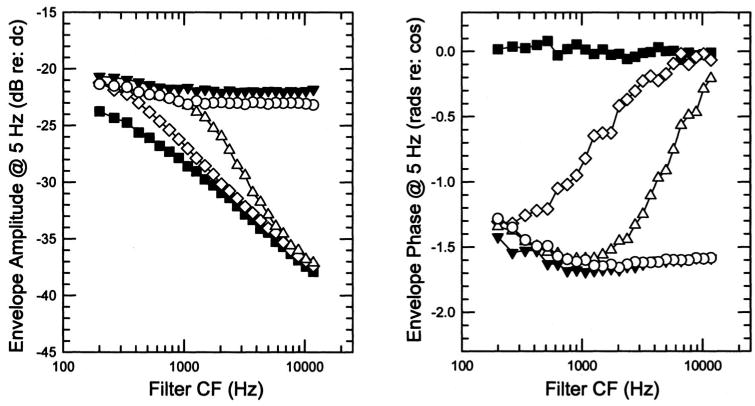
Simulations of outputs of linear auditory filters in response to second-order SAM noise (0–20 kHz) with carrier modulation frequencies of 64 (diamonds), 180 (triangles), and 2000 Hz (circles). Also are shown responses to an unmodulated (filled squares) and a 8%, 5-Hz SAM noise (filled inverted triangles). The magnitude (left panel) and phase (right panel) of the 5-Hz (first-order) SAM component at the outputs of auditory filters are shown as a function of the filter center frequency (CF). Each data point corresponds to the mean of 2500 presentations of each stimulus. Note that, in referencing the measured phase at each frequency to a cosine at that frequency, a sine function would have a phase value of −1.57 (−π/2) rad re:cos.
The following experiments were designed to investigate the relative contribution of each source of conversion (i.e., cochlear filtering and auditory nonlinearities) in the case of broadband-noise carriers. Again, probe detectability was measured behaviorally as a function of the phase relationship between the probe modulator and a second-order SAM masker fluctuating at the probe frequency. The masking data for a carrier modulation frequency of 64 Hz were compared using a white noise and 6-kHz wide bandlimited noise (4–10 kHz). This comparison allowed determining whether cancellation effects could still be observed for broadband-noise carriers, even though conversion through cochlear filtering did not occur in this case (cf. the left panel of Fig. 3). This experiment also allowed assessing the relative phase of the genuine modulation distortion component when using a noise carrier. Additional masking data were collected with the white-noise carrier for the other two carrier modulation frequencies used in the simulations (180 Hz and 2 kHz) for which conversion through cochlear filtering was shown to occur in most or all filters. Finally, probe detectability was assessed as a function of probe modulation depth in the white-noise carrier condition in order to quantify the magnitude of the generated first-order SAM component for each masker-carrier modulation frequency. As in the first experiment, the modulation-masking experiments were preceded by a systematic assessment of the listeners' sensitivity to first- and second-order SAM white noise.
B. First- and second-order TMTFs
1. Listeners
Four listeners ranging in age between 18 and 30 years were tested. One of them was author CF and the other three were paid volunteers. All listeners had absolute thresholds less than 15 dB HL at all audiometric frequencies. Practice of 3 h was given prior to data collection.
2. Stimuli and procedure
The apparatus, procedure, and stimulus parameters were the same as for experiment 1, except that (i) a different set of earphones (Sennheiser HD 565) was used; (ii) SAM was applied to a white-noise carrier; (iii) first-order SAM detection thresholds were obtained for fm=2, 10, 40, 160, and 2000 Hz; and (iv) second-order SAM detection thresholds were obtained for carrier modulation frequencies fm of 64, 180, and 2000 Hz; the second-order modulation frequencies were 2, 5, 10, and 20 Hz when fm=64 Hz, 2, 5, 10, 20, 40, and 80 Hz when fm=180 Hz, and 2, 5, 10, 20, 40, 80, and 160 Hz when fm=2000 Hz.
3. Results and discussion
Figure 4 shows individual first- (filled squares) and second-order (open symbols) TMTFs for the four listeners. Consistent with previous data obtained with broadband-noise carriers (Viemeister, 1979; Bacon and Viemeister, 1985; Lorenzi et al., 2001a), the first-order TMTFs are low-pass in shape with thresholds of about 3% (−30 dB) for the lowest values of fm, and a −3 dB cutoff frequency below 40 Hz. Note that listeners required modulation depths ranging from 45% to 51% (−6.9 dB to −5.8 dB) to reach the threshold criterion of 70.7% correct for 2-kHz SAM. This means that, in the case of second-order SAM with a 50% carrier SAM (as was used to measure second-order TMTFs), the first-order modulation was approximately at threshold.
FIG. 4.
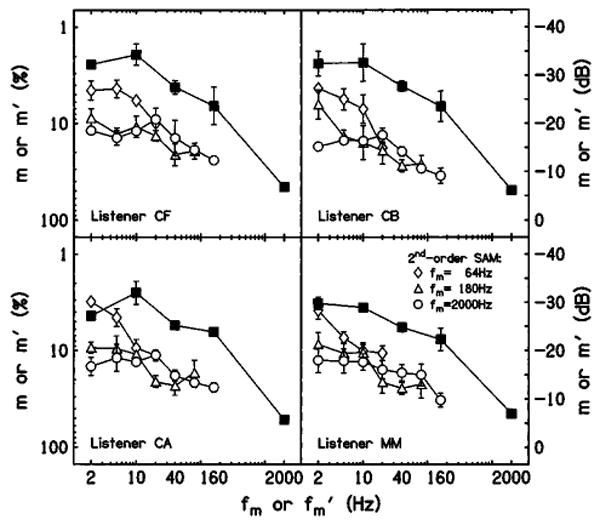
Individual first- (filled squares) and second-order (open symbols) TMTFs for the four listeners using a white-noise carrier. The carrier modulation frequency of the second-order SAM was 64 (diamonds), 180 (triangles), and 2000 Hz (circles). Otherwise as in Fig. 1.
Similar to data reported by Lorenzi et al. (2001a), second-order TMTFs with fm=64 (diamonds) and 180 Hz (triangles) show a low-pass characteristic, with average sensitivity decreasing and cutoff frequency increasing with carrier modulation frequency. Second-order TMTFs obtained with fm=2 kHz (circles) show constant thresholds of about 13% (−18 dB) at the lowest second-order SAM frequencies, and increase progressively beyond . The shapes of these second-order TMTFs mirror quite closely the first-order TMTFs, suggesting that the second-order SAM was detected using the same (but attenuated) cue as used for first-order SAM detection.
C. Detection of a 5-Hz probe modulator in the presence of a 5-Hz, second-order SAM masker: Phase effects
1. Stimuli and procedure
For the same four listeners, the detectability of a 5-Hz SAM probe applied to a white-noise carrier was measured, following the same protocol as in experiment 1, except that (i) Sennheiser HD 565 earphones were used; (ii) the probe modulation depth was fixed at a supra-threshold level of 5%, and therefore the modulation depth of the first-order SAM masker was also 5%; and (iii) the second-order masker-carrier modulation frequency was either 64, 180, or 2000 Hz. As for the experiment conducted with the sinusoidal carrier, the detection data shown in Fig. 4 indicate that all first- and second-order modulation components were audible when presented individually.
Two (CF,CB) out of the four listeners were tested when fm=64 and 2000 Hz using a 6-kHz wide broadband noise as a carrier instead of an unfiltered white noise. The bandlimited-noise carrier was obtained by bandpass filtering a white noise between 4 and 10 kHz (roll-off=120 dB/octave). The spectrum level was fixed at 32 dB. Complementary low and high unmodulated noise flankers (with frequency ranges of 0–4 and 10–22.5 kHz) were added to the modulated bandlimited noise with spectrum levels of 34 and 29 dB, respectively. This was done to prevent listeners from performing the detection task using spectral cues or combination tones (Wiegrebe and Patterson, 1999).
2. Results and discussion
Figure 5 shows individual detection scores for the white-noise (open symbols) and bandlimited-noise (filled symbols) conditions. Data for the three carrier modulation frequencies (rows) are shown as a function of relative probe phase.
FIG. 5.
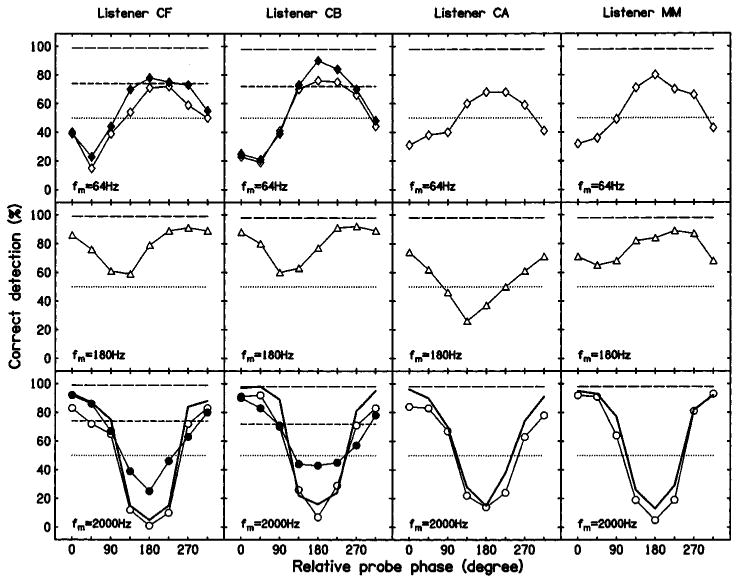
Individual detection scores for 5%, 5-Hz probe modulation of a white-noise (open symbols) and bandlimited-noise (filled symbols) carrier, measured for four listeners (columns). Carrier modulation frequency of the second-order SAM masker was fixed at 64 (diamonds, upper row), 180 (triangles, middle row), or 2000 Hz (circles, lower row). The modulation depth of the 5-Hz SAM masker (bold line, lower row) was set to 5%. Unmasked probe detection scores are indicated for the white-noise (long-dashed line) and bandlimited-noise (short-dashed line) conditions. The dotted line represents performance at chance level.
As expected based on the SAM-detection data (Fig. 4), near-perfect detection performance is observed in the white-noise condition when the 5% probe modulator is presented alone (long-dashed line). Detection performance drops to about 73% correct when the carrier is bandlimited (short-dashed line). Overall, adding a second-order masker modulator to the SAM probe degrades performance for both types of noise carriers. Moreover, as in the previous masking experiment using a sinusoidal carrier, probe detection varies with the phase relationship between the probe and masker modulators, but the probe phases giving maximum and minimum detectability depend on the masker-carrier modulation frequency. In contrast to the previously collected data, all phase effects are highly consistent across listeners.
The upper row shows the data for a second-order SAM masker with fm=64 Hz in the white-noise and bandlimited-noise conditions. In both cases, the detectability of the probe varies in essentially the same way as a function of relative probe phase. Minimum and maximum detectability occur for 0/45° and 180/225°, respectively. The fact that the overall pattern of results is very similar for both noise carriers can be taken as evidence that cochlear filtering does not contribute to the observed phase effects when fm=64Hz. Consequently, the observed cancellation effects demonstrate the existence of a genuine distortion component with a phase of 180/225°. Surprisingly, this phase is neither consistent with previously published data (in which off-frequency may have occurred) nor with the results from experiment 1 (in which off-frequency listening was, however, precluded). This discrepancy concerning the phase of the modulation distortion component between studies using noise and sinusoidal carriers remains unexplained.
The middle row shows the masking data for the white-noise condition when fm is 180 Hz. Maximum and minimum scores occur on average at about 270° and 90/135°, respectively. However, in this case, performance does not fall below chance (except for listener CA). Another pattern is obtained for fm=2kHz (open circles, lower row), where maximum scores are observed for phase relationships of 0°, 45°, and 315°, and performance consistently drops to a minimum at 180°. The fact that performance for the out-of-phase condition approaches closely the worst possible detection score suggests that the probe modulator and the first-order SAM component resulting from conversion are of similar magnitude and approximately in antiphase, so that they almost cancel each other out. In agreement with this idea, the pattern of results for the 5%, first-order SAM masker (bold line, lower row), is nearly identical to that for the second-order SAM white noise with fm=2 kHz. These data appear consistent with what would be predicted if detection performance were mainly determined by the interaction between the probe modulator and the 8%, first-order SAM component appearing at the output of cochlear filters at all CFs (cf. Fig. 3). The progressive change in the phase yielding maximum cancellation with an increase in fm from 64 to 2 kHz is therefore in line with the notion that the contribution of the first-order SAM component resulting from cochlear conversion increases with carrier modulation frequency.1
D. Detection of a 5-Hz probe modulator in the presence of a 5-Hz, second-order SAM masker: Effects of probe modulation depth
1. Stimuli and procedure
Psychometric functions were measured for detecting a 5-Hz SAM probe in the presence of a second-order SAM masker as a function of the probe modulation depth in the white-noise condition. Three of the original four listeners were tested. The apparatus, procedure, and stimuli were identical to those described in Sec. III C, except that, for each masker-carrier modulation frequency, the probe phase was fixed for each listener at the value yielding the poorest performance in the previous experiment (cf. Fig. 5). We assumed that, for this value, the probe modulator and the first-order SAM component resulting from conversion of envelope-beat information were 180° out-of-phase. The modulation depth of the probe modulator was either 1.25%, 2.5%, 5%, 10%, or 20%.
2. Results and discussion
Figure 6 shows individual detection scores for the three listeners as a function of probe modulation depth for each carrier modulation frequency of the second-order masker. The psychometric functions obtained with fm=64 Hz (diamonds) and 2000 Hz (circles) are nonmonotonic and show a u-shape, with worst performance occurring for intermediate probe depths of 5% and 10%. When fm=180 Hz (triangles), the deleterious effect of the masker is generally reduced; the psychometric functions increase monotonically with increasing probe depth with worst performance occurring consistently for probe depths of 1.25% to 5%. Taken together, these patterns of results suggest that the magnitude of the first-order conversion component is strictly below 20%. This upper limit of the estimated magnitude is somewhat higher than the 3% value reported in earlier studies using a sinusoidal audio carrier (Moore et al., 1999; Sek and Moore, 2004).
FIG. 6.
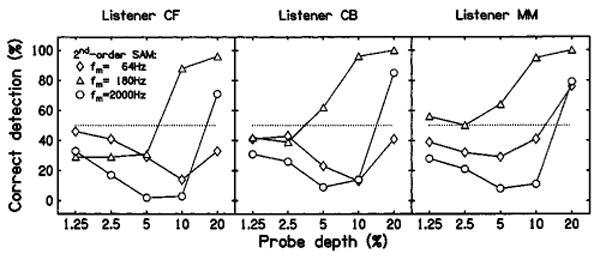
Individual masked detection scores for 5%, 5-Hz probe modulation of a white-noise carrier as a function of probe modulation depth, measured for three listeners. The masker was 5-Hz, second-order SAM with carrier modulation frequency of 64 (diamonds), 180 (triangles), and 2000 Hz (circles). The phase relationship between the probe and each second-order SAM masker was fixed in such a way as to correspond to the phase condition yielding the maximum degradation of performance in Fig. 5. Performance at chance level is indicated by the dotted line.
E. Simulations
Taken together, the empirical results and simulations appear consistent with the notion that for broadband-noise carriers: (i) both cochlear filtering and nonlinear mechanisms can introduce first-order SAM components into the internal representation of the envelope of a second-order SAM stimulus; (ii) these first-order SAM components—when present simultaneously—interact according to their own phase and magnitude, resulting in a “compound” first-order SAM component; and (iii) detectability of a first-order SAM probe in the presence of a second-order SAM masker is determined by the specific interaction of the (compound or not) first-order SAM component and the first-order SAM probe. This “cancellation hypothesis” was further tested using an approach similar to that taken by Sek and Moore (2004) to model their detection data.
This model assumes that listeners perform the probe detection task on the basis of a change in the depth of the 5-Hz modulation. In other words, listeners distinguish the 5-Hz SAM conversion component of depth mc in the standard interval from the 5-Hz SAM in the target interval of magnitude msum, corresponding to the vector sum of the first-order SAM component (of depth mc) and the probe modulation (of depth mp). For some probe phases, the first-order SAM component and the probe modulation tend to cancel, leading to a small value of msum. Since performance is assumed to be monotonically related to msum−mc, poor performance is expected in this condition.
To test this prediction, for each listener a starting value was used for mc. Assuming that the first-order SAM component was 180° out-of-phase with the probe modulation in the last experiment (for each listener, the probe phase was fixed at the value yielding the poorest performance), the value of msum was calculated for each probe modulation depth used to obtain the psychometric functions in Sec. III D. The correlation of the d′ values (computed from the obtained percent correct scores) with the values of msum−mc was then determined, and the value of mc was systematically varied to determine the value giving the highest correlation. The resulting values of mc and correlation coefficients are given in Table I. Scatter plots of the values of d′ against the values of msum−mc were fitted with regression lines, and those lines were used to generate predicted values of d′ for each probe modulation depth (data not shown). There was no evidence of any systematic discrepancy between the predicted and observed d′ values.
TABLE I.
Estimated magnitude mc in % (or in terms of 20 log mc, given in parentheses) of the first-order SAM component, yielding the highest correlation coefficient r between predicted and observed probe detection performance. The masker-carrier modulation frequency fm was 64, 180, or 2000 Hz.
| fm=64 Hz | fm=180 Hz | fm=2000 Hz | ||||
|---|---|---|---|---|---|---|
| mc | r | mc | r | mc | r | |
| CF | 12 (−18.4) |
0.99 | 2 (−34) |
0.94 | 8 (−21.9) |
0.97 |
| CB | 11 (−19.2) |
0.97 | 2 (−34) |
0.95 | 7 (−23.1) |
0.99 |
| MM | 5 (−26) |
0.99 | 2 (−34) |
0.96 | 7 (−23.1) |
0.99 |
As shown in Table I, the values of mc ranged from 2% to 12% (i.e., −34 dB to −18.4 dB expressed as 20 log mc), with correlations between d′ and msum−mc ranging from 0.94 to 0.99). This suggests that, when fm=64 or 2000 Hz, the first-order SAM component is easily detectable (cf first-order SAM detection thresholds shown in Fig. 4). In contrast, when fm=180Hz, the first-order SAM component is barely audible, consistent with earlier estimates of the effective magnitude of the modulation distortion component using a sinusoidal carrier (Moore et al., 1999; Sek and Moore, 2004). Combining these magnitude estimates and the simulated outputs of cochlear filters suggests that the magnitude of the genuine modulation distortion component (i.e., for low carrier modulation frequencies where cochlear filtering does not play a role) ranges from 5% to 12%. In addition, in the case of the 2 kHz carrier modulation frequency, the first-order SAM component seems to result entirely from cochlear conversion since its estimated magnitude corresponds precisely to the magnitude of the first-order SAM component observed at the output of cochlear filters in response to a second-order SAM with fm=2000 Hz.
IV. Conclusions
The following conclusions can be drawn from the reported data.
Consistent with earlier modulation masking studies, the detectability of a SAM probe was degraded in the presence of second-order SAM masker beating at the probe frequency, even though all components in the modulation spectrum of the masker were remote from the probe frequency. The effect depended on the stimulus parameters, such as masker-carrier modulation frequency, phase relationship between the probe modulator and the second-order SAM masker, and probe modulation depth, as well as the type of carrier signal.
When a sinusoidal carrier is used, the results indicate that off-frequency listening influences detection performance, revealing that, for higher carrier modulation frequencies, cochlear filtering is potentially involved in the conversion of the beat of complex envelopes into a first-order modulation component. However, the fact that masking effects were still observed when off-frequency listening was precluded argues for the existence of a genuine modulation distortion component. In this condition, the phase effects varied across listeners from 45° to 135°, suggesting that several nonlinear mechanisms may be involved in the generation of modulation distortion.
When a white-noise carrier is used, combined empirical results and computer simulations of the outputs of auditory filters indicate, again, that cochlear filtering is potentially involved in the conversion of the beat of complex envelopes into a first-order modulation component, but mainly for high carrier modulation frequencies (e.g., 2 kHz). The masking effects observed at lower carrier modulation frequencies when no other sources of conversion play a role (e.g., cochlear filtering or sideband reflection) are in line with the existence of a modulation distortion component with a phase of 180/225° relative to the envelope beat.
When a white-noise carrier is used, the magnitude of the first-order modulation presumably resulting from one or the interaction of several sources of conversion ranges from 1% to 12% when first- and second-order modulation depths are fixed at 40%. This suggests that this component may be largely audible under certain stimulus conditions. The magnitude of the genuine modulation distortion component is estimated between 5% and 12% when the carrier modulation frequency is 64 Hz.
Acknowledgments
This research was supported by a MENRT grant to C. Füllgrabe, and a grant from the Institut Universitaire de France to C. Lorenzi. The work of B. C. J. Moore was supported by the MRC (UK). The work of S. Sheft was supported by the NIH. We thank the editor Neal F. Viemeister and two anonymous reviewers for constructive comments on earlier versions of this manuscript.
Footnotes
Portions of this work were presented at the 27th Annual Midwinter Research Meeting of the Association for Research in Otolaryngology, Daytona Beach, FL, February 2004.
In addition to cochlear filtering, conversion may also occur physically for broadband-noise carriers through intermodulation introduced by sideband reflection. Modulation adds upper and lower sidebands to each spectral component of the carrier with a carrier-to-sideband frequency separation equal to the frequency of the specific modulator component. When sideband placement is either below dc or above the Nyquist frequency of a digital signal, the sidebands mirror about those respective points. A consequence of this sideband reflection is intermodulation in the modulation domain. That is, components are added to the modulation spectrum at the sum and the difference terms between integer multiples of the component frequencies of the modulator. In the case of second-order SAM, this includes a significant component at the second-order modulation frequency. With a white-noise carrier and a relatively high frequency of the first-order SAM carrying the second-order modulation, noticeable sideband reflection can occur. However, since the overall patterns of results in the bandlimited-noise condition, in which reflected sidebands were removed and/or masked (Fig. 5, filled symbols), are similar to those obtained in the white-noise condition (Fig. 5, open symbols), it may be concluded that sideband reflection did not influence the present results obtained with the white-noise carrier.
Contributor Information
Christian Füllgrabe, Laboratoire de Psychologie Expérimentale—UMR CNRS 8581, Université René Descartes—Paris 5, 71 avenue Edouard Vaillant, 92774 Boulogne-Billancourt, France.
Brian C. J. Moore, Department of Experimental Psychology, University of Cambridge, Downing Street, Cambridge CB2 3EB, United Kingdom
Laurent Demany, Laboratoire de Neurophysiologie—UMR CNRS 5543, Université Victor Segalen—Bordeaux 2, France.
Stephan D. Ewert, Centre for Applied Hearing Research, Acoustic Technology, Ørsted—DTU, Technical University of Denmark, Denmark
Stanley Sheft, Parmly Hearing Institute, Loyola University of Chicago, 6525 N. Sheridan Road, Chicago, Illinois 60626.
Christian Lorenzi, Institut Universitaire de France, Laboratoire de Psychologie Expérimentale—UMR CNRS 8581, Université René Descartes—Paris 5, France.
References
- Alcántara JI, Moore BCJ, Glasberg BR, Wilkinson AJK. Phase effects in masking: Within-Versus across-channel processes. J Acoust Soc Am. 2003;114:2158–2166. doi: 10.1121/1.1608959. [DOI] [PubMed] [Google Scholar]
- Bacon SP, Viemeister NF. Temporal modulation transfer functions in normal-hearing and hearing-impaired subjects. Audiology. 1985;24:117–134. doi: 10.3109/00206098509081545. [DOI] [PubMed] [Google Scholar]
- Dau T, Kollmeier B, Kohlrausch A. Modeling auditory processing of amplitude modulation: I. Modulation detection and masking with narrow-band carriers. J Acoust Soc Am. 1997a;102:2892–2905. doi: 10.1121/1.420344. [DOI] [PubMed] [Google Scholar]
- Dau T, Kollmeier B, Kohlrausch A. Modeling auditory processing of amplitude modulation: II. Spectral and temporal integration in modulation detection. J Acoust Soc Am. 1997b;102:2906–2919. doi: 10.1121/1.420345. [DOI] [PubMed] [Google Scholar]
- Ewert SD, Verhey JL, Dau T. Spectro-temporal processing in the envelope-frequency domain. J Acoust Soc Am. 2002;112:2921–2931. doi: 10.1121/1.1515735. [DOI] [PubMed] [Google Scholar]
- Füllgrabe C, Lorenzi C. The role of envelope beat cues in the detection and discrimination of second-order amplitude modulation. J Acoust Soc Am. 2003;113:49–52. doi: 10.1121/1.1523383. [DOI] [PubMed] [Google Scholar]
- Füllgrabe C, Meyer B, Lorenzi C. Effect of cochlear damage on the detection of complex temporal envelopes. Hear Res. 2003;178:35–43. doi: 10.1016/s0378-5955(03)00027-3. [DOI] [PubMed] [Google Scholar]
- Kohlrausch A, Fassel R, Dau T. The influence of carrier level and frequency on modulation and beat-detection thresholds for sinusoidal carriers. J Acoust Soc Am. 2000;108:723–734. doi: 10.1121/1.429605. [DOI] [PubMed] [Google Scholar]
- Levitt H. Transformed up-down methods in psychoacoustics. J Acoust Soc Am. 1971;49:467–477. [PubMed] [Google Scholar]
- Lorenzi C, Soares C, Vonner T. Second-order temporal modulation transfer functions. J Acoust Soc Am. 2001a;110:1030–1038. doi: 10.1121/1.1383295. [DOI] [PubMed] [Google Scholar]
- Lorenzi C, Simpson MIG, Millman RE, Griffiths TD, Woods WP, Rees A, Green GGR. Second-order modulation detection thresholds for pure-tone and narrow-band noise carriers. J Acoust Soc Am. 2001b;110:2470–2478. doi: 10.1121/1.1406160. [DOI] [PubMed] [Google Scholar]
- Lorenzi C, Sibellas J, Füllgrabe C, Gallégo S, Fugain C, Meyer B. Effects of amplitude compression on first- and second-order modulation detection thresholds in cochlear implant listeners. Int J Audiol. 2004;43:264–270. doi: 10.1080/14992020400050035. [DOI] [PubMed] [Google Scholar]
- Moore BCJ, Glasberg BR. Temporal modulation transfer functions obtained using sinusoidal carriers with normally hearing and hearing-impaired listeners. J Acoust Soc Am. 2001;110:1067–1073. doi: 10.1121/1.1385177. [DOI] [PubMed] [Google Scholar]
- Moore BCJ, Sek A, Glasberg BR. Modulation masking produced by beating modulators. J Acoust Soc Am. 1999;106:908–918. doi: 10.1121/1.427106. [DOI] [PubMed] [Google Scholar]
- Moore BCJ, Glasberg BR, Plack CJ, Biswas AK. The shape of the ear's temporal window. J Acoust Soc Am. 1988;83:1102–1116. doi: 10.1121/1.396055. [DOI] [PubMed] [Google Scholar]
- Patterson RD, Nimmo-Smith J, Holdsworth J, Rice P. An efficient auditory filterbank based on the gammatone function. paper presented at a Meeting of the IOC Speech Group on Auditory Modelling at RSRE.1987. [Google Scholar]
- Sek A, Moore BCJ. Estimation of the level and phase of the simple distortion tone in the modulation domain. J Acoust Soc Am. 2004;116:3031–3037. doi: 10.1121/1.1795331. [DOI] [PubMed] [Google Scholar]
- Sheft S, Yost WA. Modulation detection interference with two-component masker modulators. J Acoust Soc Am. 1997;102:1106–1112. doi: 10.1121/1.419862. [DOI] [PubMed] [Google Scholar]
- Shofner WP, Sheft S, Guzman SJ. Responses of ventral cochlear nucleus units in the chinchilla to amplitude modulation by low-frequency, two-tone complexes. J Acoust Soc Am. 1996;99:3592–3605. doi: 10.1121/1.414957. [DOI] [PubMed] [Google Scholar]
- Strickland EA, Viemeister NF. Cues for discrimination of envelopes. J Acoust Soc Am. 1996;99:3638–3646. doi: 10.1121/1.414962. [DOI] [PubMed] [Google Scholar]
- Tandetnik S, Garnier S, Lorenzi C. Measurement of first- and second-order modulation detection thresholds in listeners with cochlear hearing loss. Br J Audiol. 2001;35:355–364. doi: 10.1080/00305364.2001.11745253. [DOI] [PubMed] [Google Scholar]
- Verhey JL, Ewert SD, Dau T. Modulation masking produced by complex tone modulators. J Acoust Soc Am. 2003;114:2135–2146. doi: 10.1121/1.1612489. [DOI] [PubMed] [Google Scholar]
- Viemeister NF. Temporal modulation transfer functions based upon modulation thresholds. J Acoust Soc Am. 1979;66:1364–1380. doi: 10.1121/1.383531. [DOI] [PubMed] [Google Scholar]
- Viemester, N. F. (2003) (personal communication).
- Wiegrebe L, Patterson RD. Quantifying the distortion products generated by amplitude-modulated noise. J Acoust Soc Am. 1999;106:2709–2718. doi: 10.1121/1.428099. [DOI] [PubMed] [Google Scholar]
- Zwicker E. Die elementaren Grundlagen zur Bestimmung der Informationskapazität des Gehörs (The foundations for determining the information capacity of the auditory system) Acustica. 1956;6:356–381. [Google Scholar]