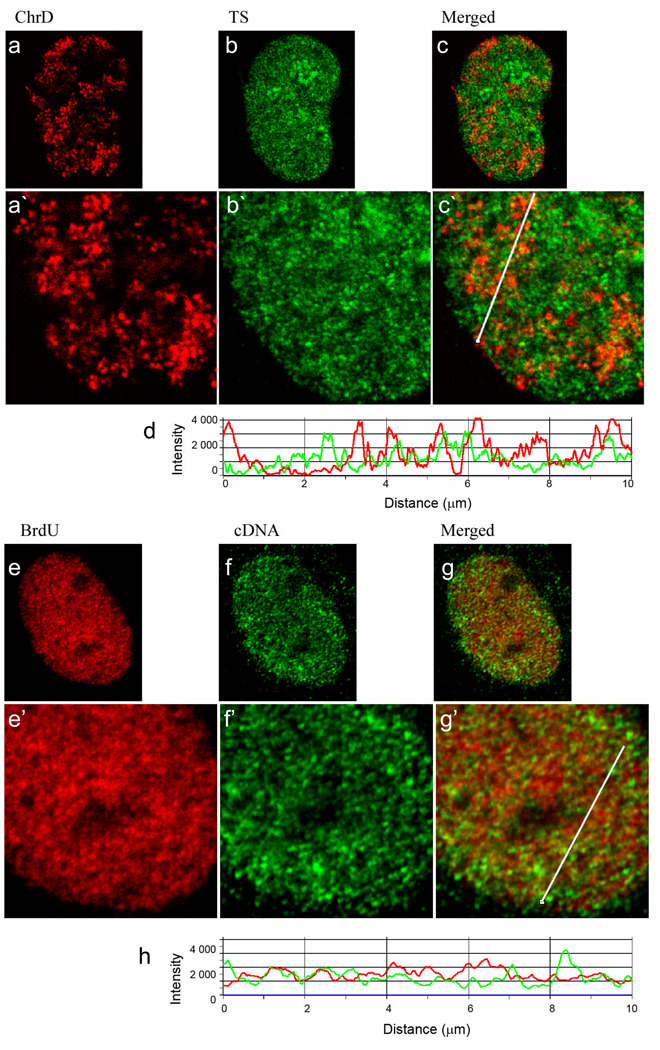
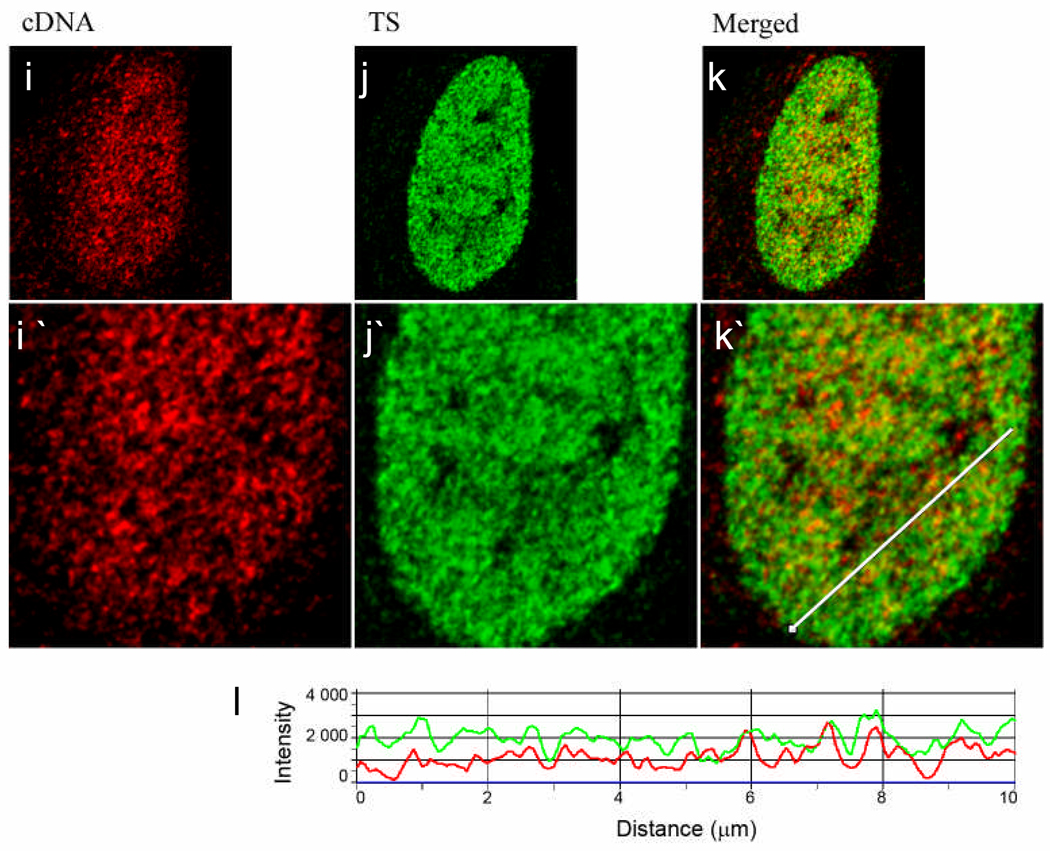
Fig. 4. Visualization of the transcription sites, cDNA and early S-labeled chromatin indicates association of transcription with relaxed chromatin surrounding the discrete chromatin domains (ChrD).
Single confocal optical sections (0.5 µm) are presented. (a) Cells were labeled for early S replicated DNA by microinjection and chased for 3 days (red, left panel) followed by in vivo labeling of transcription sites (Tsukamoto, et al.) with fluorouridine (green, middle panel) (b). (c) Displays the merged images (a) and (b). (d) A line profile through (c) with ChrD in red and TS in green. Red arrowheads point to ChrD that do not overlap with TS. Intensity peaks corresponding to ChrD foci which co-localize with TS are marked by yellow arrowheads. As is demonstrated by the virtual absence of yellow signal in the merged image and the line profile, little colocalization was seen of the TS with the discrete ChrD. Instead, the TS were enriched within the lower intensity, relaxed chromatin found between the discrete ChrD (see also Fig 1). (e,f) Cells were double labeled for ChrD (red, left panel) and chromatin enriched in transcribed sequences with a cDNA FISH probe, (green, middle panel). In this case the ChrD was labeled by in vivo pulsing with BrdU (20 min) followed by a 150 min chase to ensure that all of the labeled ChrD have finished replication (see Ma et al. 1998). (g) Displays the merged images (e) and (f); (h) shows a line profile through (g) with ChrD in red and TS in green. Similar to the results with TS, the majority of ChrD foci do not co-localize with the cDNA. (i, j) Cell was double labeled for cDNA (red, left panel) and TS (green, middle panel). (k) Displays the merged images (i) and (j). (l) A line profile through (k) demonstrates a high degree of association of cDNA intensity peaks with TS peaks. Scale bar is 5 µm. Average Pearson Coefficients calculated for experiments demonstrated in Figure 4 (c, g, kj, i) are~ 0.30, 0.24 and 0.62, respectively; n=15 (see also Fig S1). All lines used for intensity profiles (Fig 4 c, g, k) were artificially thickened to enhance their visibility.


