Abstract
Observations of individual virions in live cells have led to the characterization of their attachment, entry and intracellular transport1. However, the assembly of individual virions has never been observed in real-time. Insights into this process have come primarily from biochemical analyses of populations of virions or from microscopic studies of fixed infected cells. Thus, some assembly properties, such as kinetics and location, are either unknown or controversial2–5. Here, we quantitatively describe the genesis of individual virions in real-time, from initiation of assembly to budding and release. We studied fluorescently tagged derivatives of Gag, the major structural component of HIV-1 which is sufficient to drive assembly of viral-like-particles (VLPs)6, using fluorescence resonance energy transfer (FRET), fluorescence recovery after photobleaching (FRAP) and total internal reflection fluorescent microscopy (TIR-FM) in living cells. Virions appeared individually at the plasma membrane, their assembly rate accelerated as Gag protein accumulated in cells and typically five to six minutes was required to complete the assembly of a single virion. These approaches allow a previously unobserved view of the genesis of individual virions and the determination of parameters of viral assembly that are inaccessible using conventional techniques.
We monitored HeLa cells coexpressing untagged Gag and Gag fused to green fluorescent protein (GFP). This avoids the reported morphologic defect seen when Gag-GFP is expressed alone7 and electron microscopic studies confirmed that VLPs containing Gag and Gag-GFP were morphologically indistinguishable from VLPs containing Gag only (data not shown). Gag was detected as a diffuse signal at 5–6 hours after transfection and discrete puncta that apparently localized at the plasma membrane began to appear at 6–7 after transfection (Supplementary Fig. 1a)4. However, the signal from puncta at the plasma membrane was partially masked by the strong diffuse fluorescence emitted by cytoplasmic Gag-GFP (Supplementary Fig. 1b). This diffuse fluorescence diminished relative to the intensity of the fluorescent puncta when imaged with TIR-FM, whose illumination decays exponentially from the coverslip/medium interface with a space constant of ~70 nm8, (Supplementary Fig. 1b). Thus, TIR-FM is well suited to monitor appearance of VLPs at the plasma membrane.
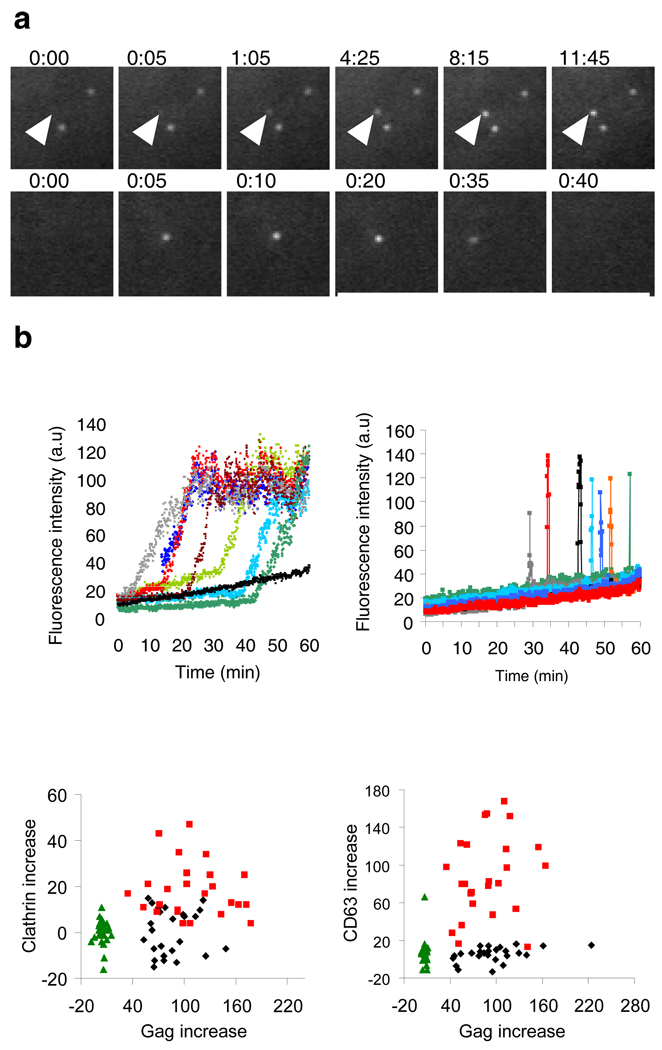
Cells that had generated few (less than 20) Gag puncta at 5 to 6 after transfection were observed over the ensuing 30 to 60 min (Supplementary Fig. 1c). Typically, 50 to 150 puncta per cell appeared during this period (movie 1). Their behavior fell into two discrete classes. One class appeared over several minutes (Fig. 1a top, b left and movie 2) and showed little lateral movement during and after emergence (average lateral velocity = 0.007 µm/sec, n=25, Supplementary Fig. 2a). Almost all (99%) of these slowly-appearing puncta remained in the TIR field until the end of the imaging period. A second class of Gag puncta behaved differently, emerging in the TIR field in 5 to 15 seconds, remaining there for an average of 33 seconds (n=25), displaying lateral motility (average velocity = 0.195 µm/sec, n=25), and, in every case, disappearing from the field as rapidly as they appeared (Fig. 1a bottom, b right and movie 3). When the Gag-GFP puncta first appeared (5–6 h after transfection), slowly-appearing puncta represented the majority of events (74%, n=306), whereas at later time points (14–15 after transfection), the rapidly appearing/disappearing population predominated (75%, n=166) (Supplementary Fig. 2b). When Gag was co-expressed with the viral protein Vpu, which reduces virions’ surface tethering and subsequent appearance in late endosomes9–11, the fraction of rapidly appearing/disappearing puncta fell both at early (from 26% to 3%) and late (from 75% to 34%, p<0.001) time points (Supplementary Fig. 2b).
Figure 1. Two distinct behaviors of HIV-1 Gag puncta at the plasma membrane.
a, Images illustrating slowly (top panels, arrowheads) and rapidly (bottom panels) appearing Gag-GFP puncta. Fields are 5.5×5.5µm. b, Fluorescence intensity in arbitrary units (a.u.) plotted over time for 7 slowly appearing puncta (left, colored lines) and for 7 rapidly appearing puncta (right) and 7 random areas where no puncta appeared (left, black line). c, The change in CD63 or clathrin fluorescence is plotted against the corresponding change in Gag-GFP during the appearance of 25 rapidly and slowly emerging puncta, as well as against the corresponding changes at random areas where no puncta appeared.
Virions can appear in late endosomes as a result of active antiviral tethering9–11 and subsequent internalization4,9–12. Further, endosomes marked with fluorescently tagged versions of resident proteins, such as CD6313, or coat proteins, such as clathrin14,15, have previously been observed moving in the TIR field. To examine whether the Gag puncta were associated with endosomes, Gag-GFP together with CD63-mCherry or with dsRed-clathrin light chain were visualized with simultaneous dual-color TIR-FM (movie 4). Most of the rapidly appearing/disappearing, laterally motile Gag puncta were positive for CD63 (88%, n=25) and clathrin (72%, n=25). The appearance, movement and disappearance of these puncta were indistinguishable from the CD63-positive or clathrin-positive vesicles (supplementary Fig. 3a, movie 5 and movie 6). On average, the fluorescence of CD63 and clathrin increased 16- and 50-fold respectively, coincident with the rapidly appearing Gag puncta, as compared to randomly chosen, equivalently sized areas of observation containing only diffuse Gag (p < 0.001) (Fig. 1c). In contrast, none of the slowly-appearing puncta were associated with detectable increase of CD63 (n=25) or clathrin (n=25) and in this respect were indistinguishable from areas of the plasma membrane containing only diffuse Gag (p = 0.43 and 0.98, respectively) (supplementary Fig. 3b, movie 7 and movie 8). Because the rapidly appearing/disappearing puncta were indistinguishable from endosomes, we focused on the slowly-appearing puncta as the population that might represent genuine VLP assembly events.
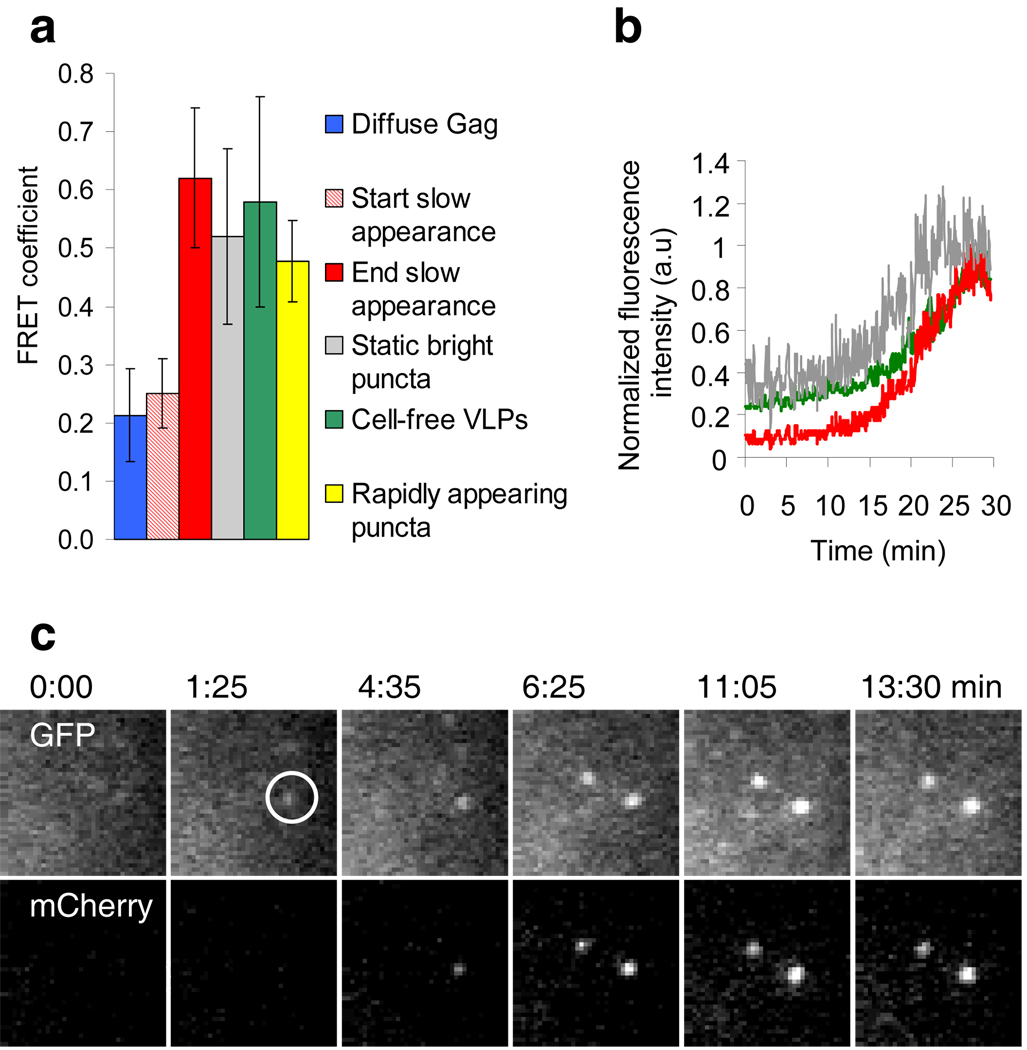
During virion assembly, Gag molecules become move sufficiently close to one another that FRET can occur. Indeed, FRET has been demonstrated between retroviral Gag-CFP and Gag-YFP molecules in whole cells16–18. To monitor the assembly of individual particles we chose the comparatively weak FRET pair of GFP/mCherry19, precisely because their absorption and emission spectra overlap less than those of CFP and YFP. FRET should thus be more dependent on the high density of ~5000 Gag molecules20 found within a single virion. FRET was detected between Gag-GFP and Gag-mCherry, both within Gag-expressing cells and within individual cell-free VLPs (the FRET is characterized in supplementary Fig 4). When single Gag puncta first became visible, the FRET coefficient (the ratio of mCherry:GFP) within them was similar to the FRET coefficient measured in areas containing only diffuse Gag (Fig. 2a). Then, both the GFP and mCherry fluorescence increased, with mCherry fluorescence increasing relatively more rapidly until they reached their maxima synchronously (Fig. 2b, c and supplementary Fig. 5). Thus, the FRET in appearing Gag puncta increased 2.5 fold to the level in cell-free VLPs (Fig. 2a). Bleaching the mCherry increased the GFP emission, confirming that FRET occurred in VLPs (Supplementary Fig 4d). Thus, during the slow emergence, Gag molecules achieve greater proximity, the expected signature of an assembly event, and ultimately are as closely packed as in VLPs released into the extracellular milieu.
Figure 2. FRET analysis of individual Gag puncta.
Untagged Gag, Gag-mCherry and Gag-GFP were co-expressed and the cells illuminated with a 488 nm laser. a, FRET coefficients measured at the beginning and the end of the slow appearance of individual puncta (n=30), compared to FRET coefficients at randomly chosen areas containing diffuse Gag (n=30), in static bright puncta (n=30), in cell-free VLPs (n=100) or in rapidly appearing puncta (n=30). b, Plots of the normalized fluorescence intensity of GFP, corrected mCherry and the FRET coefficient during appearance of the punctum shown in (c). Additional examples are shown in supplementary fig 5. c, Images of GFP and corrected mCherry fluorescence (due to FRET) during slow appearance of a punctum. Fields are 5.5×5.5µm.
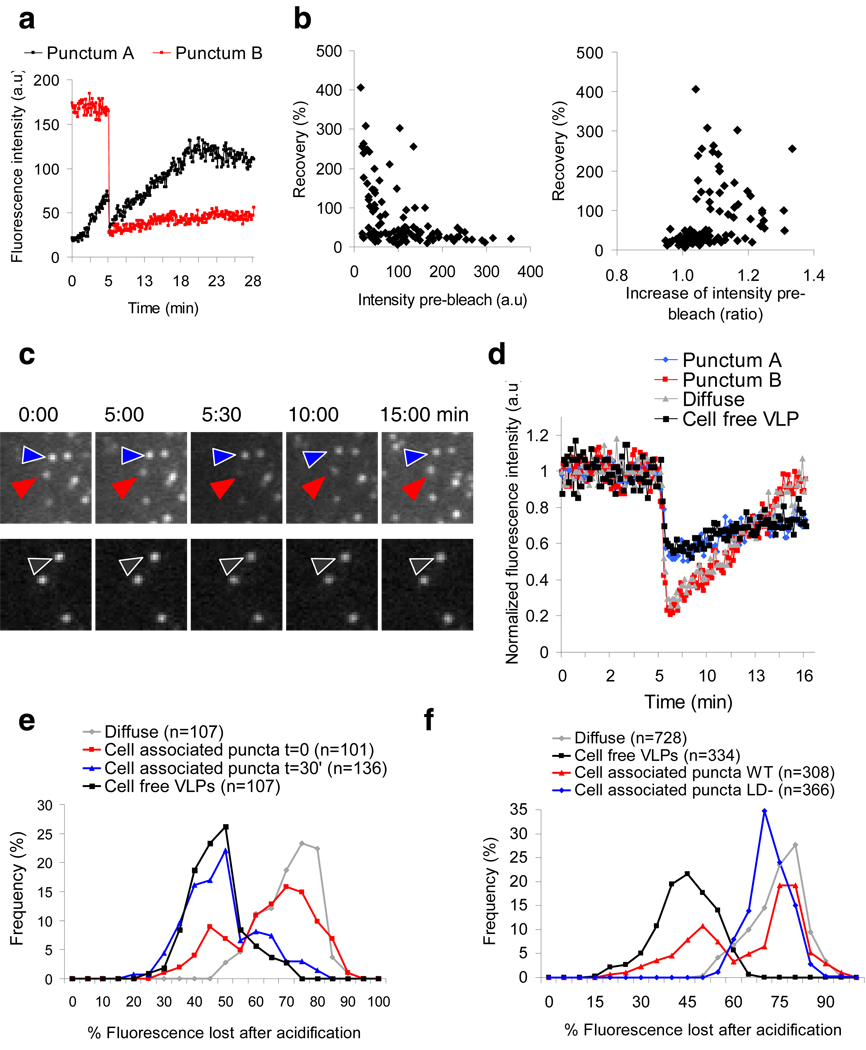
The stable fluorescence ultimately achieved by each slowly-appearing punctum (Fig. 1b, left) could reflect a steady state where Gag-GFP is exchanging with the cytoplasmic pool or may represent the completion of the assembly of a VLP whose Gag molecules are segregated from the cytoplasmic pool. To distinguish between these possibilities, the puncta were examined with FRAP. This analysis revealed that puncta with a low but rising intensity during the pre-bleach period recovered well during the post-bleach period. Conversely, puncta whose intensity was high and stable during the pre-bleach period did not recover (Fig. 3a,b and supplementary fig 6). Thus, most puncta recruiting Gag molecules before the bleach continued to recruit new Gag molecules after the bleach; those with steady fluorescence represented puncta in which Gag recruitment was completed and irreversible.
Figure 3. FRAP analysis of individual Gag puncta.
a, Plots of Gag-GFP fluorescence intensity over time for the red and black puncta shown in supplementary fig 6. b, Fluorescence recovery of 100 puncta plotted as a function of either their absolute pre-bleach intensity (left panel) or the fold increase in their intensity before bleaching (1 means no increase, >1 means increasing, right panel). c, Images showing Gag-pHluorin puncta before and after the CO2-mediated acidification. Cells (top panels) or cell-free VLPs (bottom panels) were incubated with pCO2 after 5 min of imaging, for 30 sec. The arrows indicate one pCO2-‘sensitive’ punctum (red), one pCO2-‘insensitive’ punctum (blue) and one cell-free VLP (black). Fields are 3.5×3.5µm. d, Plots of normalized fluorescence intensity over time for the 3 Gag-pHluorin puncta indicated in (d) (bearing the same color coding), as well as for a diffuse Gag area. e, Loss of fluorescence immediately following pCO2 mediated acidification for diffuse Gag, cell-free VLPs and Gag puncta at t=0 and t=30’ of imaging. f, Loss of fluorescence immediately following pCO2 mediated acidification of diffuse Gag, cell-free VLPs and Gag with a late domain mutation.
The final step in the genesis of an HIV-1 particle is the fission of virion and cell membranes21. At this point, the virion interior should not be able to exchange any molecules – even protons – with the cell cytoplasm. To test if this final step occurred in the Gag puncta we were observing, we expressed Gag fused to pHluorin22, a variant of GFP not fluorescent at acidic pH, then varied the pCO2 in the media23. Raising the pCO2 produces acidification as a result of the reaction CO2 + H2O ↔ H+ + HCO3 −. This should acidify the cytosol more rapidly than the interior of cell-free VLPs as result of the cytosolic enzyme carbonic anhydrase23. Thus, increasing the pCO2 should quench the fluorescence of cytosol-exposed Gag-pHluorin more than Gag-pHluorin in a VLP whose lipid envelope has separated from the cell. As expected, after a brief pulse of higher pCO2 the fluorescence of the cytosolic-exposed diffuse Gag-pHluorin was quenched more than the Gag-pHluorin in cell-free VLPs (Fig. 3c–f). After the pCO2 pulse, the fluorescence of the diffuse Gag-pHluorin returned to normal more quickly than the isolated VLPs (Fig. 3d). The fluorescence of one population of cell-associated puncta responded indistinguishably from the diffuse Gag to a pulse of pCO2 (Fig. 3e, f). Conversely, a minority of Gag puncta showed the lower sensitivity to pCO2 of the budded, cell-free VLPs. However, 30’ later, most of the cell-associated Gag puncta had shifted to the less pCO2 sensitive state of the budded VLPs (Fig. 3e). Also, after the pulse of pCO2, the fluorescence of the diffuse Gag and the more pCO2 responsive population of Gag-puncta returned to normal more quickly than did the less responsive puncta or the cell-free VLPs (Fig. 3d). Thus, the population of Gag-puncta that was as sensitive as diffuse Gag to cytosolic acidification probably consisted of nascent VLPs whose interiors were continuous with the cytosol, whereas the population relatively resistant to pCO2 probably consisted of budded VLPs. Moreover, when a Gag-pHluorin protein lacking a functional late-budding domain24 was used to generate puncta, only the pCO2 sensitive population was seen (Fig. 3f), showing that fission of the VLP and cell membranes was needed to generate pCO2-resistant (budded) VLPs.
Despite the conclusion that these VLPs have budded and are separate from the cell, they do not move away. This is a confluence of at least two factors. The VLPs are about 100 nm in diameter and their movement is limited by the distance from the cell to the coverslip (20–40 nm). Second, a large fraction of virions remain associated with the cell surface after assembly11.
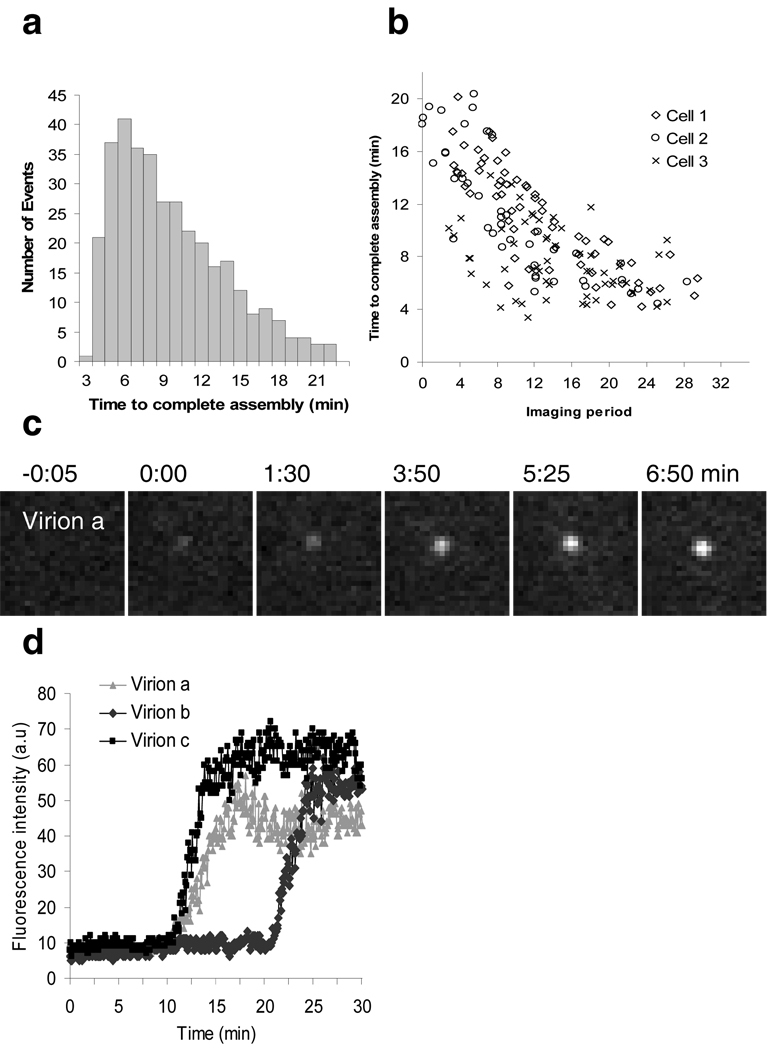
We have observed a population of laterally non-motile VLPs that appear over several minutes at the plasma membrane, whose emergence is accompanied by a recruitment of Gag molecules that become progressively closer to each other until they segregate from the cytoplasmic pool and detach from the plasma membrane. These slowly appearing VLPs are not associated with endosomes that approach and retreat from the plasma membrane and represent the vast majority of those that appear at the plasma membrane within the first few hours after Gag expression, particularly in the presence of Vpu. We conclude that this population of slowly-appearing puncta represents the genesis of VLPs through de novo assembly. Analysis of 370 such assembly events revealed that individual VLPs assembled over an average of 8.5 minutes, with 5 to 6 minutes per VLP being the most frequent rate of assembly (Fig. 4a). Assembly was slower for VLPs that appeared early in the observation period, but accelerated thereafter as Gag concentration increased, stabilizing at 5–6 minutes (Fig. 4b). Gag concentration influences both the interaction between Gag molecules and the interaction between Gag and the plasma membrane25 and is very probably a key determinant of assembly kinetics. It is possible that some VLP assembly also takes place on internal membranes that are out of field of view afforded by TIR-FM, although some previous work argues strongly against this notion4,5,12. In examining tens of thousands of VLPs assembling in hundreds of cells, we never observed an organelle reaching the surface and discharging multiple VLPs. Thus, if there is any assembly on internal organelles it does not contribute significantly to the population of VLPs appearing at the basal surface of the cell during the first day of expression or infection
Figure 4. Variation in HIV-1 assembly kinetics.
a, Distribution of the time to complete assembly for 370 individual VLPs in 11 HeLa cells expressing Gag/Gag-GFP. Time to complete assembly was defined as the interval between the points of inflection on plots of fluorescence intensity against time, for each VLP (for instance Figs 1b, c). b, Time to complete assembly is plotted against the time at which assembly commenced in 3 cells imaged for 40 minutes. T=0 is defined as the time at which observation began, i.e. when >1 but < 20 VLPs were visible in the TIR field for each cell. c–d. Assembly of HIV-1 particles from full-length proviral plasmids. c, Images of an individual HIV-1 virion assembly event. Fields are 5.5×5.5µm. d, Plots of the fluorescence intensity over time for 3 assembly events, including the one shown in (c).
Altering the expression of Gag-GFP relative to Gag, between 1:1 and 1:10, did not affect the kinetics of VLP assembly, indicating that their genesis was not influenced by the presence of a GFP-tag (Supplementary Fig. 6). Moreover, when Gag was fused to mCherry, which matures more slowly than GFP26,27, VLPs assembled with kinetics indistinguishable from those containing Gag/Gag-GFP (Supplementary Fig. 7), indicating the kinetics were not affected by the maturation time of the fluorophore. Significantly, in cells transfected with full-length proviral plasmids in which YFP was inserted into the stalk region of matrix4 (Supplementary Fig.8), the assembly of HIV-1 virions was completed with similar kinetics to those of Gag-GFP containing VLPs (Fig. 4c,d and supplementary Fig. 7c). Thus, neither the location nor nature of the fluorophore linked to Gag, nor the presence of other viral proteins, affected the kinetics of particle assembly.
These studies have allowed the observation and quantitative analysis of the assembly of individual virions in living cells. Elaboration of these approaches should permit characterization of the recruitment of other viral and cellular components to nascent virions, and could address many questions difficult to tackle using conventional techniques.
Methods summary
Expression vectors
Plasmids expressing HIV-1 Gag and Gag-GFP, Vpu-YFP, CD63-Cherry proteins were previously described4,9 as was an HIV-1 proviral plasmid that carries YFP embedded within Gag4. Derivatives were constructed using standard molecular biology techniques.
Cells and transfection
HeLa cell clones expressing CD63-mCherry or Ds-Red clathrin were derived by retroviral transduction. For imaging, cells plated in glass-bottomed dishes, were transfected using Lipofectamine2000. VLPs isolated from the supernatant of transfected cells were adhered to polylysine-coated dishes and imaged under the same conditions as VLP-producing cells.
Image acquisition and analysis
Through-the-objective TIR-FM was done using an inverted Olympus IX-70 microscope with a 60x, N.A. 1.45 TIR objective. Imaging of GFP, mCherry or DsRed was achieved by excitation with a 488-nm laser line of an argon laser or a 543-nm HeNe laser, as appropriate. Simultaneous dual color imaging was achieved with a dual emission splitter equipped with a 515/30 bandpass filter and a 580lp filter. For FRET analysis, experimentally determined GFP emission bleed-through and direct excitation of mCherry by the 488-nm laser was subtracted from the raw mCherry fluorescence values to yield a corrected mCherry fluorescence that was due to FRET. The FRET coefficient was calculated by dividing the intensity of the corrected mCherry emission by the intensity of the GFP emission in the area of interest. For the analysis of fluorescence recovery, cells were imaged at 5hpt for 5’, photobleached for 3’ and observed for an additional 20’. During the bleach, the opening of an iris placed in front of the TIR-FM laser was reduced to bleach only a part of the cell. To test the pCO2-sensitivity of VLPs assembled with Gag-pHluorin, cultures were perfused with 100% CO2 for 30 seconds. All image analysis was done using MetaMorph software.
Full Methods and associated references are given in the supplementary section.
Supplementary Material
Acknowledgements
We thank Trinity Zang for sharing the HeLa cell line stably expressing DsRed-clathrin-light-chain, Anthony Baraff for statistical analysis, and members of the Bieniasz and Simon laboratories for discussions. We are grateful to R. Y. Tsien, Tomas Kirchhausen and Gero Miesenböck (Yale University, New Haven, CT) for plasmids. This work was supported by grants from the NIH (to PDB and SMS) and NSF (to SMS). NJ is supported by an amfAR Mathilde Krim Fellowship in Basic Biomedical Research.
References
- 1.Brandenburg B, Zhuang X. Virus trafficking-learning from single-virus tracking. Nat Rev Microbiol. 2007;5:197–208. doi: 10.1038/nrmicro1615. [DOI] [PMC free article] [PubMed] [Google Scholar]
- 2.Pelchen-Matthews A, Kramer B, Marsh M. Infectious HIV-1 assembles in late endosomes in primary macrophages. J Cell Biol. 2003;162:443–455. doi: 10.1083/jcb.200304008. [DOI] [PMC free article] [PubMed] [Google Scholar]
- 3.Sherer NM, et al. Visualization of retroviral replication in living cells reveals budding into multivesicular bodies. Traffic. 2003;4:785–801. doi: 10.1034/j.1600-0854.2003.00135.x. [DOI] [PubMed] [Google Scholar]
- 4.Jouvenet N, et al. Plasma membrane is the site of productive HIV-1 particle assembly. PLoS Biol. 2006;4:e435. doi: 10.1371/journal.pbio.0040435. [DOI] [PMC free article] [PubMed] [Google Scholar]
- 5.Welsch S, et al. HIV-1 buds predominantly at the plasma membrane of primary human macrophages. PLoS Pathog. 2007;3:e36. doi: 10.1371/journal.ppat.0030036. [DOI] [PMC free article] [PubMed] [Google Scholar]
- 6.Gottlinger HG. The HIV-1 assembly machine. Aids. 2001;15 suppl 5:S13–S20. doi: 10.1097/00002030-200100005-00003. [DOI] [PubMed] [Google Scholar]
- 7.Larson DR, Johnson MC, Webb WW, Vogt VM. Visualization of retrovirus budding with correlated light and electron microscopy. Proc Natl Acad Sci U S A. 2005;102:15453–15458. doi: 10.1073/pnas.0504812102. [DOI] [PMC free article] [PubMed] [Google Scholar]
- 8.Jaiswal JK, Simon SM. Imaging single events at the cell membrane. Nat Chem Biol. 2007;3:92–98. doi: 10.1038/nchembio855. [DOI] [PubMed] [Google Scholar]
- 9.Neil SJ, Eastman SW, Jouvenet N, Bieniasz PD. HIV-1 Vpu promotes release and prevents endocytosis of nascent retrovirus particles from the plasma membrane. PLoS Pathog. 2006;2:e39. doi: 10.1371/journal.ppat.0020039. [DOI] [PMC free article] [PubMed] [Google Scholar]
- 10.Neil SJ, Sandrin V, Sundquist W, Bieniasz PD. An Interferon-α-Induced Tethering Mechanism Inhibits HIV-1 and Ebola Virus Particle Release but Is Counteracted by the HIV-1 Vpu Protein. Cell Host and Microbe. 2007;2:193–203. doi: 10.1016/j.chom.2007.08.001. [DOI] [PMC free article] [PubMed] [Google Scholar]
- 11.Neil SJ, Zang T, Bieniasz PD. Tetherin inhibits retrovirus release and is antagonized by HIV-1 Vpu. Nature. 2008;451:425–430. doi: 10.1038/nature06553. [DOI] [PubMed] [Google Scholar]
- 12.Finzi A, Orthwein A, Mercier J, Cohen EA. Productive human immunodeficiency virus type 1 assembly takes place at the plasma membrane. J Virol. 2007;81:7476–7490. doi: 10.1128/JVI.00308-07. [DOI] [PMC free article] [PubMed] [Google Scholar]
- 13.Jaiswal JK, Andrews NW, Simon SM. Membrane proximal lysosomes are the major vesicles responsible for calcium-dependent exocytosis in nonsecretory cells. J Cell Biol. 2002;159:625–635. doi: 10.1083/jcb.200208154. [DOI] [PMC free article] [PubMed] [Google Scholar]
- 14.Keyel PA, Watkins SC, Traub LM. Endocytic adaptor molecules reveal an endosomal population of clathrin by total internal reflection fluorescence microscopy. J Biol Chem. 2004;279:13190–13204. doi: 10.1074/jbc.M312717200. [DOI] [PubMed] [Google Scholar]
- 15.Rappoport JZ, Taha BW, Simon SM. Movement of plasma-membrane-associated clathrin spots along the microtubule cytoskeleton. Traffic. 2003;4:460–467. doi: 10.1034/j.1600-0854.2003.00100.x. [DOI] [PubMed] [Google Scholar]
- 16.Derdowski A, Ding L, Spearman P. A novel fluorescence resonance energy transfer assay demonstrates that the human immunodeficiency virus type 1 Pr55Gag I domain mediates Gag-Gag interactions. J Virol. 2004;78:1230–1242. doi: 10.1128/JVI.78.3.1230-1242.2004. [DOI] [PMC free article] [PubMed] [Google Scholar]
- 17.Hubner W, et al. Sequence of human immunodeficiency virus type 1 (HIV-1) Gag localization and oligomerization monitored with live confocal imaging of a replication-competent, fluorescently tagged HIV-1. J Virol. 2007;81:12596–12607. doi: 10.1128/JVI.01088-07. [DOI] [PMC free article] [PubMed] [Google Scholar]
- 18.Larson DR, Ma YM, Vogt VM, Webb WW. Direct measurement of Gag-Gag interaction during retrovirus assembly with FRET and fluorescence correlation spectroscopy. J Cell Biol. 2003;162:1233–1244. doi: 10.1083/jcb.200303200. [DOI] [PMC free article] [PubMed] [Google Scholar]
- 19.Tramier M, Zahid M, Mevel JC, Masse MJ, Coppey-Moisan M. Sensitivity of CFP/YFP and GFP/mCherry pairs to donor photobleaching on FRET determination by fluorescence lifetime imaging microscopy in living cells. Microsc Res Tech. 2006;69:933–939. doi: 10.1002/jemt.20370. [DOI] [PubMed] [Google Scholar]
- 20.Briggs JA, et al. The stoichiometry of Gag protein in HIV-1. Nat Struct Mol Biol. 2004;11:672–675. doi: 10.1038/nsmb785. [DOI] [PubMed] [Google Scholar]
- 21.Pornillos O, Garrus JE, Sundquist WI. Mechanisms of enveloped RNA virus budding. Trends Cell Biol. 2002;12:569–579. doi: 10.1016/s0962-8924(02)02402-9. [DOI] [PubMed] [Google Scholar]
- 22.Miesenbock G, De Angelis DA, Rothman JE. Visualizing secretion and synaptic transmission with pH-sensitive green fluorescent proteins. Nature. 1998;394:192–195. doi: 10.1038/28190. [DOI] [PubMed] [Google Scholar]
- 23.Simon S, Roy D, Schindler M. Intracellular pH and the control of multidrug resistance. Proc Natl Acad Sci U S A. 1994;91:1128–1132. doi: 10.1073/pnas.91.3.1128. [DOI] [PMC free article] [PubMed] [Google Scholar]
- 24.Bieniasz PD. Late budding domains and host proteins in enveloped virus release. Virology. 2006;344:55–63. doi: 10.1016/j.virol.2005.09.044. [DOI] [PubMed] [Google Scholar]
- 25.Perez-Caballero D, Hatziioannou T, Martin-Serrano J, Bieniasz PD. Human immunodeficiency virus type 1 matrix inhibits and confers cooperativity on gag precursor-membrane interactions. J Virol. 2004;78:9560–9563. doi: 10.1128/JVI.78.17.9560-9563.2004. [DOI] [PMC free article] [PubMed] [Google Scholar]
- 26.Pedelacq JD, Cabantous S, Tran T, Terwilliger TC, Waldo GS. Engineering and characterization of a superfolder green fluorescent protein. Nat Biotechnol. 2006;24:79–88. doi: 10.1038/nbt1172. [DOI] [PubMed] [Google Scholar]
- 27.Shaner NC, Steinbach PA, Tsien RY. A guide to choosing fluorescent proteins. Nat Methods. 2005;2:905–909. doi: 10.1038/nmeth819. [DOI] [PubMed] [Google Scholar]
Associated Data
This section collects any data citations, data availability statements, or supplementary materials included in this article.


