

Abstract
Context: Understanding the role of insulin resistance in type 1 diabetes may lead to new prevention strategies. Estimates of insulin resistance in first-degree relatives of those with type 1 diabetes may be obtained using the minimal model of glucose kinetics incorporating a population approach.
Objective: The objective of the study was to explore parameters contributing to glucose homeostasis in a cross-sectional study of first-degree relatives across a wide age range.
Design: Insulin sensitivity (SI) was assessed using the minimal model of glucose kinetics after an oral glucose tolerance test combined with nonlinear mixed-effects modeling. β-Cell function was measured from the insulinogenic index at 30 min (IGI30). Disposition index (DI) was estimated as the product of SI and IGI30.
Setting: The study was conducted at an academic center.
Subjects: Subjects included 1241 first-degree relatives (aged 2–75 yr).
Results: SI was found to be negatively correlated with age, whereas IGI30 increased until young adulthood. The increase IGI30 was apparently insufficient to compensate for the insulin resistance because DI decreased linearly at the rate of 0.035 (10−2 min−1 mmol−1 liter per year) after young adulthood. Both IGI30 and DI were significantly lower in those with vs. without autoantibodies, whereas there was no difference between these groups with respect to SI.
Conclusions: β-Cell function, adjusted for age-related insulin resistance, decreases throughout life in first-degree relatives. This deterioration may be exacerbated in the presence of autoantibodies. Oral glucose tolerance test data combined with a nonlinear mixed-effect modeling population approach may be a useful technique to evaluate SI and secretion in a population.
β-cell function, adjusted for age-related insulin resistance, decreases throughout life in first-degree relatives, as indicated by analyses using population kinetics and minimal modeling of oral glucose tolerance test data.
Type 1 diabetes is a chronic autoimmune disease that results in the permanent destruction of insulin producing pancreatic β-cells. There is progressive impairment of β-cell function and decline in β-cell mass years before the onset of the disease, accompanied by the formation of autoantibodies that are the markers of the underlying immune damage to β-cells and disease progression (1,2,3,4,5).
Recent analysis of data from the Diabetes Prevention Trial (DPT-1) indicates progression from normal glucose tolerance to dysglycemia before the onset of clinical disease (6). Furthermore, several analysis have now suggested that both insulin resistance and insulin secretion impact the progression of disease (7,8,9). Whereas large data sets such as the DPT-1 are invaluable in identifying those at risk for disease, prospective follow-up is most often selective, including only those first-degree relatives that are multiple antibody positive or within a limited age range (through midadulthood).
The Pittsburgh Family Project performed oral glucose tolerance tests (OGTTs) on more than 1200 first-degree relatives aged 2–75 yr. Data obtained from the OGTT include measures of insulin and glucose at multiple time points over 2–4 h, thus allowing for derivation of parameter estimates representing both insulin sensitivity and β-cell function. In this study, we describe the relationship of these derived indices using population based estimates to age and autoantibody status, with the aim of better understanding the natural history of these parameters among first-degree relatives.
Subjects and Methods
Subjects
The study population was part of the Pittsburgh Family Project, originally conceived as an epidemiology study of glucose tolerance in relatives of individuals with diabetes before the availability of autoantibody assays. Over time, study procedures changed to address specific scientific aims. Thus, only about 60% of subjects underwent antibody testing. Once autoantibody assays became available, all antibody-positive individuals were specifically encouraged to undergo oral glucose tolerance testing. Thus, the cohort used consisted of 1241 first-degree relatives of type 1 diabetic patients who underwent OGTT within the 1973–2001 period, including 599 male (48.3%) and 642 female (51. 7%) individuals. Participants ranged in age from 2 to 75 yr (mean ± sd: 26.46 ± 15.20). The age distribution is illustrated in Fig. 1.
Figure 1.

The age distribution of subjects. Male, □; female, ▪.
OGTT
OGTTs were performed in subjects after written informed consent was obtained. After fasting, blood samples were drawn at time points 0, 15, 30, 60, 120, 180, and 240 min after glucose dose for the measurements of plasma glucose and insulin concentrations.
Autoantibody assays
Among 1241 subjects, results for Islet Cell Cytoplasmic Autoantibodies (ICAs), insulin autoantibodies (IAAs), Glutamic Acid Decarboxylase Autoantibody (GADA), and Insulinoma-Associated-2 Autoantibodies (IA-2A) were available in 734 subjects. Positive results for all biochemical autoantibodies and ICAs were confirmed in subsequent assays. In some with low-titer autoantibodies, the assay was repeated a third time to confirm a positive result. The cutoff point for a positive ICA sample in this study was set at ≥10 Juvenile Diabetes Foundation units or greater. This assay had 90–100% specificity and 70–100% sensitivity in Immunology of Diabetes Society proficiency workshops 1991–1996 (10).
IAAs were assayed in triplicate using a RIA as previously described (11). In the 2000 Diabetes Autoantibody Standardization Program workshop, 16% of patients with type 1 diabetes mellitus were found positive (consistent with the average results of the workshop) and there was 100% specificity.
Serum samples were assayed for autoantibodies against, glutamic acid decarboxylase 65-kDa isoform and IA-2A in triplicate using in vitro-transcribed/translated 35S-[Met]-labeled recombinant human glutamic acid decarboxylase 65-kDa isoform as previously described (12,13). Proficiency workshops results, under IDS auspices (University of Florida in Gainesville, 1995, 1996, and 1997) and the Diabetes Autoantibody Standardization Program (2000, 2002, 2003), are summarized as follows: 76–100% sensitivity, 96–100% specificity, and 100% validity for glutamic acid decarboxylase autoantibodies; 48–78.5% sensitivity, 98–100% specificity, 87.5% validity and 91.6% consistency in the 1996, 2000, 2002, and 2003 workshops for IA-2 autoantibodies.
Among these 734 relatives with OGTT results, 628 subjects were autoantibody negative, 73 subjects had a single autoantibody, 18 subjects had two positive autoantibodies, seven subjects had three positive antibodies, and eight had all four positive autoantibodies.
Calculations and statistics
Insulin sensitivity (SI)
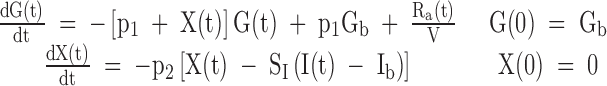
SI was estimated from the minimal model of glucose kinetics applied to the plasma glucose and insulin concentrations obtained from the OGTT (14,15). The model assumes that insulin action emanates from a compartment remote from plasma, which is usually identified as the interstitium. The equations for our implementation of the oral minimal model are listed below:
 |
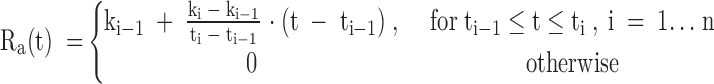 |
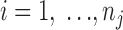
where k is the rate parameters, t is the breakpoints in the model, n is the number of data points, G and I are plasma glucose (milligram per deciliter) and insulin concentrations (microunits per milliliter−1), Gb and Ib are their basal values, and X is insulin action (min−1) . Ra(t) is the time varying absorption rate described by a piecewise linear model. Because of the identifiability properties of this model, the parameters glucose effectiveness (p1), volume of distribution of glucose (V), and insulin action parameter (p2) were set to their population means of 0.014 (min−1), 1.45 (deciliter per kilogram), and 0.011 (minute−1), respectively (14,15). Additionally, it is assumed that the fraction of ingested glucose (f) reaching the circulation is 0.9 (15).
Population approach
Although the large population of 1241 subjects in the present data set afforded us the opportunity to assess comprehensively these measures of glucose homeostasis in first-degree relatives, given the sparseness of the available data, it would be impossible to recover individual estimates in a large portion of subjects. In addition, the conventional approach, such as the standard two-stage method, requires model identification in each individual separately when analyzing the data and ignoring knowledge about the population as a whole. Thus, a population approach, which combines the minimal model with nonlinear mixed-effects model to account for between-subject variation (BSV), was adopted to estimate population parameters and subsequently achieve individual estimates in all individuals via empirical Bayesian estimation.
The general form of a nonlinear mixed effects model is given by  , where
  (
( ) are the observed data of the
  subjects
  .
.  is the minimal model for predicting the
  response in the
  subject. The vector
  incorporates fixed values of covariates for each individual.
  is the vector of the model parameters for the
  subject. The parameter is composed of a fixed effect that is the same for all individuals
  and the random effect that varies quantitatively among individuals, BSV. This BSV was modeled with an exponential distribution to constrain the parameter values to be positive. A proportional error model was assumed for the residual error
  . The nonlinear mixed effects model was applied using the first-order estimation method of NONMEM version V (The NONMEM Project Group, University of California, San Francisco, San Francisco, CA, and Globomax ICON, Hanover, MD), and using the POSTHOC option to obtain individual empirical Bayesian post hoc model parameter estimates.
Insulin secretion index (IGI30) and disposition index (DI)
The β-cell function index was evaluated using the early-phase insulin response to glucose quantified with the insulinogenic index, which is defined as the ratio of the increment of insulin to that of plasma glucose 30 min after glucose load: IGI30 = (I30 − I0)/(G30 − G0), where I30, I0, G0, and G30 are insulin and glucose concentrations at time 0 and 30 min, respectively (16). To determine whether insulin secretion was appropriate for the degree of insulin resistance, the DI was calculated by multiplying the indexes of insulin secretion by insulin sensitivity, DI = SI × IGI30.
All data were expressed as mean ± sem unless specified otherwise. One subject, at age 32 yr, was removed as an obvious outlier. Comparisons of SI, IGI30, and DI between genders and between groups with different number of positive autoantibodies were performed using Student’s two-tailed t tests for unpaired data. For all comparisons, P < 0.05 was considered significant.
Results
In all 1241 relatives taken together, the estimated SI from the oral glucose minimal model is 7.25 ± 0.32 10−4 min−1μU−1 · ml. Insulinogenic index at 30 min IGI30 is 138 ± 4.6 pmol · mmol−1. DI, defined as the product of SI and IGI30, is 1.46 ± 0.07 10−2 min−1 · mmol−1 · liter.
All indices were compared between males and females. No significant differences were observed in age and insulin sensitivity index, but β-cell function and disposition index were significantly higher in females than males, as summarized in Table 1. These gender differences were seen in the autoantibody-negative population only.
Table 1.
SI, insulinogenic index, and DI in male vs. female (mean ± sem)
| Gender | Male (n = 599) | Female (n = 642) | P value |
|---|---|---|---|
| Age (yr) | 26.85 ± 0.63 | 26.90 ± 0.57 | 0.9530 |
| SI (10−4 min−1 · μU−1 · ml) | 7.85 ± 0.62 | 6.70 ± 0.24 | 0.0753 |
| IGI30 (pmol · mmol−1) | 119. 8 ± 5.36 | 154.4 ± 7.3 | 0.0002a |
| DI (10−2 min−1 mmol−1 · liter) | 1.29 ± 0.07 | 1.62 ± 0.12 | 0. 0204a |
Values less than 0.05.
SI decreases with age throughout the age spectrum. As shown in Fig. 2A, before age 15 yr, SI rapidly diminishes from greater than 35 to less than 5 (10−4 min−1μU−1 · ml), which is comparable with the value observed in healthy adults (17). SI showed a flattening pattern, with a slight increase during later teenage/early adult years (age 15 to 23 yr). After then, SI continued declining gradually until later in life.
Figure 2.

The relationship between SI (A), insulin secretion (B), DI (C), and age among first-degree relatives. Diamonds and error bars represent mean ± sem at individual ages.
Associated with the decrease in SI, insulin secretion measured as IGI30 was dramatically enhanced to around 200 pmol/mmol−1 and appears to peak at around age 15 yr. During the later teenage and young adult years (age 15 to 25 yr), insulin secretion showed a clear drop. An age-related pattern in insulin secretion was less clear after age 25 yr and BSVs also become larger in the older subject cohort (Fig. 2B).
The DI relative to age is illustrated in Fig. 2C. Except the very low value at age 2 yr, DIs increase slightly before the approximate time of puberty. After then, DI decreases linearly with age.
The hyperbolic relationship between SI and IGI30 has been well established in previous studies, and DI has been shown to be constant given a certain level of glucose tolerance (18). The hyperbolic relationship in our population grouped by 10-yr age cohorts is illustrated in Fig. 3. The relationship between insulin action and IGI30 was shifted to the lower left in the elderly groups when compared with the younger groups. The migration of the hyperbolae toward the origin is another way to show the inverse linear decrease in disposition index with age, indicating that compensatory insulin secretion becomes insufficient for the gradually deteriorating SI, and thus, glucose tolerance becomes gradually impaired with increasing age.
Figure 3.

Hyperbolic relationships between SI and insulin secretion in 10-yr age group cohorts. Each of the age groups was fitted to the hyperbolic curve separately using nonlinear least-squares estimation.
The 734 subjects for which results for ICA, IAA, GADA, and IA-2A were available were further divided into those with and without autoantibodies. There was no difference in age between these groups, although there were no autoantibody-positive subjects over age 55 yr. As shown in Table 2, insulin secretion as measured by IGI30 is significantly lower in those with positive antibodies, whereas SI is not significantly different between groups. Thus, the DI is significantly lower in those with positive antibodies. Because previous studies indicated that positivity for a single specific autoantibody is not associated with an increased risk of progression to type 1 diabetes (2,3,4,5), we also divided the subjects among those with none/single autoantibody vs. two or more autoantibodies. Both IGI30 and DI were significantly lower in those with 0 or 1 vs. two or more antibodies, whereas there was no difference between these groups with respect to SI (data not shown).
Table 2.
Metabolic indices according to autoantibody status (mean ± sem)
| Number of positive autoantibodies | No autoantibodies (n = 628) | One or more autoantibodies (n = 106) | P value |
|---|---|---|---|
| Male/female | 310/318 | 53/53 | |
| Age (yr) | 27.12 ± 0.59 | 25.30 ± 1.29 | 0.2342 |
| SI (10−4 min−1μU−1 · ml) | 6.79 ± 0.22 | 5.85 ± 0.52 | 0.1098 |
| IGI30 (pmolmmol−1) | 129.12 ± 3.39 | 104.87 ± 7.04 | 0.0057a |
| DI (10−2 min−1mmol−1 · liter) | 1.32 ± 0.05 | 0.92 ± 0.08 | 0.0020a |
Values less than 0.05.
Discussion
We applied a population modeling approach to assess SI in a large population of first-degree relatives by adopting the oral glucose minimal model combined with a nonlinear mixed-effects model. We reported the effect of age and autoantibodies on changes of SI, insulin response, and DI in a wide range of ages. Our analysis revealed that the decay of SI with age is accompanied by a lower-than-expected compensatory insulin response in these first-degree relatives. As a result, the DI linearly decreases with age after young adulthood. Furthermore, no differences were seen in SI according to the presence or absence of autoantibodies. In contrast, both IGI30 and DIs were lower in subjects with islet autoantibodies, thus suggesting that both age and autoantibodies impact glucose homeostasis in first-degree relatives.
Studies on the effect of age on glucose tolerance indices have been done previously in both healthy subjects and individuals with diabetes. A majority of such studies were carried out either to identify the effect of aging by comparing an elderly group with a young adult group (19,20,21) or to investigate changes during puberty among three or four Tanner groups (18,22). In contrast to the limited sample size in these studies, we evaluated more than 1200 subjects and applied modeling and data mining to a wide age spectrum, thus demonstrating the analytical and quantitative relationship between age and parameters pertaining to glucose homeostasis among first-degree relatives from 2 to 75 yr of age. Furthermore, the present population also comprises several subjects at each individual age value. Both very young and old subjects at both ends of the spectrum provided abundant information for the effect of age on glucose tolerance during the process of both puberty and aging.
A majority of reports have confirmed that glucose tolerance may be affected by age, either due to diminished sensitivity to insulin at its target tissues or gradually impaired pancreatic β-cell response. In the current population of relatives, SI was lower in elderly than young subjects, similar to what has been found in healthy or type 2 diabetic subjects (19,20,23). We found that SI rapidly diminishes before age 15 yr. After 15 yr of age, SI only slightly recovers until age 23 yr and then keeps diminishing, with a much slower rate but persistently, until later in life. Correspondingly, insulin secretion increases dramatically before age 15 yr and drops from age 15 to 23 yr, after which it keeps close to a plateau. These data are consistent with the use of differing values of first-phase insulin secretion according to age in trials aimed to identify those at risk (24,25).
Although the reasons for the development of insulin resistance along the entire age spectrum are not fully understood, it can be safely stated that different mechanisms likely contribute to insulin resistance during puberty and during aging. It has been well documented that SI is highest before the onset of puberty, reaches its nadir midway through maturation, and recovers to a near prepubertal level at the end of maturation (26,27). The insulin resistance is accompanied by a large compensatory enhancement of insulin secretion before age 15 yr. As others have suggested, the vulnerability of children at puberty to develop overtly clinical disease is likely due to the insufficient increase of insulin secretion to compensate for the sharp drop in SI. At the end of puberty in our study, SI did not return to prepubertal levels, as shown in many previous studies in healthy children (27,28). This may be due to the cross-sectional rather than prospective nature of our analysis. Alternatively, this may reflect a fundamental difference between first-degree relatives and healthy individuals.
Beyond puberty, the reduction in SI is persistent but relatively slow, and there are minimal changes in insulin secretion. In adults, the gradual development of insulin resistance with the increase of age has been ascribed to obesity and level of fitness (19). A slowly progressive immune assault on the β-cell combined with a slow but progressive development of insulin resistance with age is likely to underlie latent autoimmune diabetes of adults. The bimodality of type 1 diabetes incidence rate proposed by Karjalainen et al. (29), in which one peak occurs close to puberty and the other in the fifth decade of life, fits well with our observations. Our study also provides some evidence for the hypothesis proposed by Beyan et al. (30) that there exists an age-related spectrum of decreasing insulin secretory capacity and increasing severity of insulin resistance within autoimmune diabetes.
Type 1 diabetes is characterized as the selective destruction of the insulin-producing β-cells in the islets of Langerhans instead of being linked to insulin resistance, which is the hallmark of type 2-diabetes. However, the maintenance of normoglycemia is the result of the interplay of islet β-cell secretion and SI of the peripheral tissues and liver (31). Using the IGI30 as a measure of β-cell function without simultaneously considering the diminishing insulin sensitivity along age might misleadingly suggest an improved β-cell response in the current study. Thus, the DI, calculated as the product of SI and insulin secretion, provides a more accurate measure of actual β-cell function. In our population, the DI increases slightly from birth, peaks at around 15 yr, and decreases linearly and continuously at the rate of 1% per year throughout life. This is similar to that reported in healthy subjects (32) but much lower than that in individuals with type 2 diabetes (5% per year) (33).
The autoimmune destruction of pancreas β-cells in type 1 diabetes is associated with T cell-mediated immunity marked by the development of autoantibodies. In our study, we found that IGI30 is significantly lower in relatives with positive autoantibodies, suggesting impaired pancreatic β-cell mass or function in this group, whereas as expected, our analyses show that SI is not significantly different between groups. As a result, the DI was also significantly lower in relatives with, compared with without, autoantibodies. Together with the impact of age on DI, it would be expected that these subjects would become gradually unable to maintain normal glucose tolerance. Whereas our study did not have sufficient information about subsequent diabetes status to determine whether this is the case, several studies, using other measures associated with SI, have indicated that insulin sensitivity is an important contributory factor in the development of type 1 diabetes among antibody-positive relatives (7,8,9).
The inclusion of a wide age spectrum and the rich information about the estimation of glucose tolerance indices from a population minimal model are clear strengths of this study. Our study reinforces the concept that glucose metabolic parameters, including SI, β-cell function, and DI change with age and that the presence of autoantibodies influences on β-cell function and DI. Like all retrospective clinical studies, our study has limitations because the original study was not designed to evaluate new tools for modeling of glucose and insulin response after an oral challenge. Another significant limitation is the lack of C-peptide data, which would allow a more precise assessment of prehepatic insulin secretion using the oral minimal models depicting the control of glucose on insulin secretion (20). We tried to obviate to this by using a surrogate of the acute insulin response, the IGI30 of the test. Whereas this is just an approximation, the fact that the pattern of β-cell response thus determined reflects existing knowledge strengthens our conclusions. A consequence of the lack of C-peptide measurements is that our version of the DI may not be the most accurate determination of this important parameter. Furthermore, whereas our results describing the impact of autoantibodies on disease status are consistent with numerous previous studies, because some of the data were obtained more than 30 yr ago, the autoantibody measures do not reflect the current state of the art and reflect one-time cross-sectional assessment of autoantibody status. Unfortunately, a complete set of samples were not available; thus, reevaluation of autoantibody status was not possible. Moreover, the population that underwent OGTT was biased toward those with positive autoantibodies, thus accounting for the high percentage of autoantibody positivity in the data set.
Our data mining analysis should therefore be viewed as a feasibility study for this type of approach and as a starting point for future studies. For example, application of these techniques to data sets such the DPT-1 may provide important information about the natural history of disease. It would also be important to test whether these measures would be useful to understand changes in secretion and sensitivity that may occur over time in a general population; however, we are unaware of large data sets of OGTTs across a wide age range in such a cohort.
The population analysis method is a powerful tool to obtain individual assessments of indices of insulin sensitivity from OGTT measurements, especially in studies with such large numbers of subjects. A possible concern with the method is that having combined all subjects in one population runs the risk of flattening the individual estimates against the population mean (sometimes referred to as shrinkage). However, the relatively rich sampling schedule and the large variability among subjects (which gives rise to rather diffuse parameter priors, with between-subject coefficients of variation in excess of 100%) would minimize bias in estimates due to the use of the population method because available individual data would contribute to an accurate subject-specific estimate more than the highly variable population prior.
In conclusion, we successfully estimated SI in 1241 first-degree relatives by adopting the oral glucose minimal model combined with nonlinear mixed-effect modeling population approach. Our study assessed the influence of age on patterns of insulin resistance and β-cell function in first-degree relatives, established a quantitative relationship between age and glucose tolerance, and demonstrated the deterioration of insulin action and β-cell function with age. Both impaired β-cell function and age-related insulin resistance appear to contribute to disease pathogenesis. Our study detected additional impairment of β-cell function in the presence of autoantibodies, suggesting that the well-known risk of antibodies among those younger than 45 yr may carry into late adulthood. In conclusion, our results show that OGTT data combined with a nonlinear mixed-effect modeling population approach may be a useful technique to evaluate SI and secretion in a population. Applied to prospective or specifically selected sets of relatives, this technique may improve the accuracy of risk assessments by combining disease-associated autoantibodies with a measure of age-related deterioration in β-cell function considered in the context of SI.
Acknowledgments
The GADA and IA-2A autoantibody assays were performed by Dr. Massimo Pietropaolo (Childrens Hospital of Pittsburgh).
Footnotes
The data analysis component of this study was partially supported by National Institutes of Health (NIH) Grant 2 P41 EB001975, Resource Facility for Population Kinetics. Data collection was supported by Grant NIH 5 R01 DK024021-27, Etiology and epidemiology of juvenile onset diabetes; the Childrens Hospital of Pittsburgh General Clinical Research Center Grant MO1 RR00084; and The Renziehausen Fund.
Current address for P.V.: Pfizer Global Research and Development, San Diego, California.
Disclosure Summary: The authors have nothing to disclose.
First Published Online April 28, 2009
Abbreviations: BSV, Between-subject variation; DI, disposition index; DPT-1, Diabetes Prevention Trial; GADA, glutamic acid decarboxylase autoantibody; IA-2A, insulinoma-associated-2 autoantibodies; IAA, insulin autoantibody; ICA, islet cell cytoplasmic autoantibody; IGI30, insulin secretion index; OGTT, oral glucose tolerance test; SI, insulin sensitivity.
References
- Achenbach P, Bonifacio E, Koczwara K, Ziegler AG 2005 Natural history of type 1 diabetes. Diabetes 54(Suppl 2):S25–S31 [DOI] [PubMed] [Google Scholar]
- Haller MJ, Atkinson MA, Schatz D 2005 Type 1 diabetes mellitus: etiology, presentation, and management. Pediatr Clin North Am 52:1553–1578 [DOI] [PubMed] [Google Scholar]
- Kimpimäki T, Kulmala P, Savola K, Vähäsalo P, Reijonen H, Ilonen J, Akerblom HK, Knip M 2000 Disease-associated autoantibodies as surrogate markers of type 1 diabetes in young children at increased genetic risk. Childhood Diabetes in Finland Study Group. J Clin Endocrinol Metab 85:1126–1132 [DOI] [PubMed] [Google Scholar]
- Eisenbarth GS, Gianani R, Yu L, Pietropaolo M, Verge CF, Chase HP, Redondo MJ, Colman P, Harrison L, Jackson R 1998 Dual-parameter model for prediction of type I diabetes mellitus. Proc Assoc Am Physicians 110:126–135 [PubMed] [Google Scholar]
- Bingley PJ, Christie MR, Bonifacio E, Bonfanti R, Shattock M, Fonte M, Bottazzo GF, Gale EA 1994 Combined analysis of autoantibodies improves prediction of IDDM in islet cell antibody positive relatives. Diabetes 43:1304–1310 [DOI] [PubMed] [Google Scholar]
- Sosenko JM, Palmer JP, Greenbaum CJ, Mahon J, Cowie C, Krischer JP, Chase HP, White NH, Buckingham B, Herold KC, Cuthbertson D, Skyler JS 2006 Patterns of metabolic progression to type 1 diabetes in the Diabetes Prevention Trial-Type 1. Diabetes Care 29:643–649 [DOI] [PubMed] [Google Scholar]
- Fourlanos S, Narendran P, Byrnes GB, Colman PG, Harrison LC 2004 Insulin resistance is a risk factor for progression to type 1 diabetes. Diabetologia 47:1661–1667 [DOI] [PubMed] [Google Scholar]
- Xu P, Cuthbertson D, Greenbaum C, Palmer JP, Krischer JP 2007 Role of insulin resistance in predicting progression to type 1 diabetes. Diabetes Care 30:2314–2320 [DOI] [PubMed] [Google Scholar]
- Bingley PJ, Mahon JL, Gale EA 2008 Insulin resistance and progression to type 1 diabetes in the European Nicotinamide Diabetes Intervention Trial (ENDIT). Diabetes Care 31:146–150 [DOI] [PubMed] [Google Scholar]
- Pilcher CC, Elliott RB 1990 A sensitive and reproducible method for the assay of human islet cell antibodies. J Immunol Methods 129:111–117 [DOI] [PubMed] [Google Scholar]
- Pietropaolo M, Becker DJ, LaPorte RE, Dorman JS, Riboni S, Rudert WA, Mazumdar S, Trucco M 2002 Progression to insulin-requiring diabetes in seronegative prediabetic subjects. the role of two HLA-DQ high risk haplotype2. Diabetologia 45:66–76 [DOI] [PubMed] [Google Scholar]
- Grubin CE, Daniels T, Toivola B, Landin-Olsson M, Hagopian WA, Li L, Karlsen AE, Boel E, Michelsen B, Lernmark A 1994 A novel radioligand binding assay to determine diagnostic accuracy of isoform-specific glutamic acid decarboxylase antibodies in childhood IDDM. Diabetologia 37:344–350 [DOI] [PubMed] [Google Scholar]
- Pietropaolo M, Peakman M, Pietropaolo SL, Zanone MM, Foley Jr TP, Becker DJ, Trucco M 1998 Combined analysis of GAD65 and ICA512 (IA-2) autoantibodies in organ and non-organ specific autoimmune diseases confers high specificity for insulin-dependent diabetes mellitus. J Autoimmun 11:1–10 [DOI] [PubMed] [Google Scholar]
- Dalla Man C, Caumo A, Cobelli C 2002 The oral glucose minimal model: estimation of insulin sensitivity from a meal test. IEEE Trans Biomed Eng 49:419–429 [DOI] [PubMed] [Google Scholar]
- Dalla Man C, Caumo A, Basu R, Rizza R, Toffolo G, Cobelli C 2004 Minimal model estimation of glucose absorption and insulin sensitivity from oral test: validation with a tracer method. Am J Physiol Endocrinol Metab 287:E637–E643 [DOI] [PubMed] [Google Scholar]
- Phillips DI, Clark PM, Hales CN, Osmond C 1994 Understanding oral glucose tolerance: comparison of glucose or insulin measurements during the oral glucose tolerance test with specific measurements of insulin resistance and insulin secretion. Diabet Med 11:286–292 [DOI] [PubMed] [Google Scholar]
- Dalla Man C, Yarasheski KE, Caumo A, Robertson H, Toffolo G, Polonsky KS, Cobelli C 2005 Insulin sensitivity by oral glucose minimal models: validation against clamp. Am J Physiol Endocrinol Metab 289:E954–E959 [DOI] [PubMed] [Google Scholar]
- Stumvoll M, Tataranni PA, Bogardus C 2005 The hyperbolic law—a 25-year perspective. Diabetologia 48:207–209 [DOI] [PubMed] [Google Scholar]
- Basu R, Breda E, Oberg AL, Powell CC, Dalla Man C, Basu A, Vittone JL, Klee GG, Arora P, Jensen MD, Toffolo G, Cobelli C, Rizza RA 2003 Mechanisms of the age-associated deterioration in glucose tolerance: contribution of alterations in insulin secretion, action, and clearance. Diabetes 52:1738–1748 [DOI] [PubMed] [Google Scholar]
- Basu R, Dalla Man C, Campioni M, Basu A, Klee G, Toffolo G, Cobelli C, Rizza RA 2006 Effects of age and sex on postprandial glucose metabolism: differences in glucose turnover, insulin secretion, insulin action, and hepatic insulin extraction. Diabetes 55:2001–2014 [DOI] [PubMed] [Google Scholar]
- Pacini G, Beccaro F, Valerio A, Nosadini R, Crepaldi G 1990 Reduced β-cell secretion and insulin hepatic extraction in healthy elderly subjects. J Am Geriatr Soc 38:1283–1289 [DOI] [PubMed] [Google Scholar]
- Hannon TS, Janosky J, Arslanian SA 2006 Longitudinal study of physiologic insulin resistance and metabolic changes of puberty. Pediatr Res 60:759–763 [DOI] [PubMed] [Google Scholar]
- Fritsche A, Madaus A, Stefan N, Tschritter O, Maerker E, Teigeler A, Haring H, Stumvoll M 2002 Relationships among age, proinsulin conversion, and β-cell function in nondiabetic humans. Diabetes 51(Suppl 1):S234–S239 [DOI] [PubMed] [Google Scholar]
- Skyler JS, Krischer JP, Wolfsdorf J, Cowie C, Palmer JP, Greenbaum C, Cuthbertson D, Rafkin-Mervis LE, Chase HP, Leschek E 2005 Effects of oral insulin in relatives of patients with type 1 diabetes: the Diabetes Prevention Trial-Type 1. Diabetes Care 28:1068–1076 [DOI] [PubMed] [Google Scholar]
- Diabetes Prevention Trial Study Group 2002 Effects of insulin in relatives of patients with type 1 diabetes mellitus. N Engl J Med 346:1685–1691 [DOI] [PubMed] [Google Scholar]
- Goran MI, Gower BA 2001 Longitudinal study on pubertal insulin resistance. Diabetes 50:2444–2450 [DOI] [PubMed] [Google Scholar]
- Ball GD, Huang TT, Gower BA, Cruz ML, Shaibi GQ, Weigensberg MJ, Goran MI 2006 Longitudinal changes in insulin sensitivity, insulin secretion, and β-cell function during puberty. J Pediatr 148:16–22 [DOI] [PubMed] [Google Scholar]
- Leslie RD, Taylor R, Pozzilli P 1997 The role of insulin resistance in the natural history of type 1 diabetes. Diabet Med 14:327–331 [DOI] [PubMed] [Google Scholar]
- Karjalainen J, Salmela P, Ilonen J, Surcel HM, Knip M 1989 A comparison of childhood and adult type I diabetes mellitus. N Engl J Med 320:881–886 [DOI] [PubMed] [Google Scholar]
- Beyan H, Ola T, David R, Leslie G 2006 Progression of autoimmune diabetes: slowly progressive insulin-dependent diabetes mellitus or latent autoimmune diabetes of adult. Ann NY Acad Sci 1079:81–89 [DOI] [PubMed] [Google Scholar]
- Greenbaum CJ 2002 Insulin resistance in type 1 diabetes. Diabetes Metab Res Rev 18:192–200 [DOI] [PubMed] [Google Scholar]
- Chiu KC, Lee NP, Cohan P, Chuang LM 2000 β-Cell function declines with age in glucose tolerant Caucasians. Clin Endocrinol (Oxf) 53:569–575 [DOI] [PubMed] [Google Scholar]
- Chiu KC, Martinez DS, Chu A 2005 Comparison of the relationship of age and β cell function in three ethnic groups. Clin Endocrinol (Oxf) 62:296–302 [DOI] [PubMed] [Google Scholar]