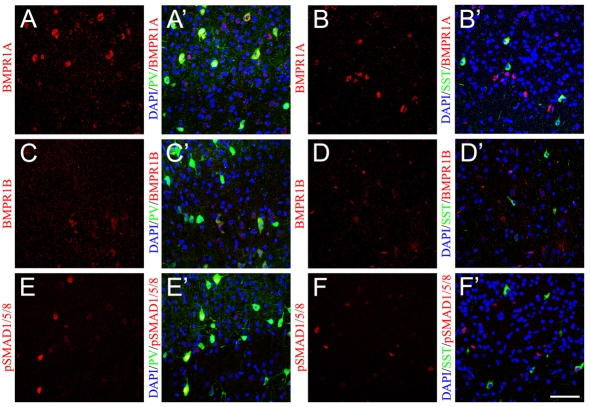
Fig. 6.
A subpopulation of PV+ interneurons is exposed to strong BMP4 signaling in vivo. (A-B′) BMPR1A (red) is expressed at high levels in PV+ (green, A′) and SST+ (green, B′) interneurons at P14. (C-D′) BMPR1B (red) is expressed at lower levels and is restricted to subpopulations of PV+ (C′) and SST+ (D′) interneurons at P14. (E-F′) Strong nuclear pSMAD1/5/8 (red) staining is present in a subpopulation of PV+ (E′) but is rarely seen in SST+ (F′) interneurons. A′-F′ are merged images. Scale bar: 50 μm.

