

Abstract
The accessory olfactory system (AOS) in mammals detects and processes information from liquid-phase environmental odorants, including pheromones. The AOS carries out tasks such as individual recognition, learning, and decision-making with relatively few stages of neural processing; it thus represents an attractive system for investigating the neural circuits that carry out these functions. Progress in understanding the AOS has long been impeded by its relative inaccessibility to standard physiological approaches. In this report, we detail a novel dissection and tissue perfusion strategy that improves access to the accessory olfactory bulb (AOB) while maintaining afferent connections from sensory neurons in the vomeronasal organ (VNO). Mitral cells demonstrated spontaneous and evoked firing patterns consistent with recent in vivo reports. We assayed cell degradation in the AOB tissue using Fluoro-Jade C and found that the VNO and AOB glomerular, external plexiform, and mitral cell layers showed minimal signs of degeneration for up to 6 hours. Whereas histology indicated some degeneration in the deep inhibitory granule cell layer over time, electrophysiological assays demonstrated intact inhibitory function on mitral cells. Pharmacological blockade of GABAA receptors with 3 μM SR95531 (gabazine) resulted in increased evoked mitral cell activity. Furthermore, mitral cells displayed suppression of responses to preferred urine stimuli when preferred and non-preferred stimuli were mixed, an effect thought to involve functional laterally-connected inhibition. These results demonstrate the utility of whole mount ex vivo preparations for studying sensory processing in the AOS, and suggest that similar strategies may improve experimental access to other difficult-to-study neural circuits.
Keywords: vomeronasal, accessory olfactory bulb, ex vivo, mitral cell, pheromone, mouse, inhibition, electrophysiology
1. Introduction
Pheromone signalling through the accessory olfactory system (AOS) in mammals guides several behaviors, including territorial aggression, mating, estrous cycling, individual recognition, and pregnancy maintenance. Despite its strong role in guiding behavior, the AOS remains one of the most poorly-understood sensory modalities in mammals. The obstacles to progress in the mammalian AOS are many, key among them the anatomical inaccessibility of the vomeronasal organ (VNO) and its long, fragile connections to the first brain region in AOS, the accessory olfactory bulb (AOB). The ability to record activity across connected AOS brain regions will be important for increasing our understanding of pheromonal sensory processing.
The study of central sensory areas separated in space from upstream neurons has typically occurred in vivo or in slice preparations that maintain portions of the axonal connectivity. Slice preparations have been an invaluable tool for increasing our understanding of elementary neuronal networks, but are clearly restricted by the complexity and non-planar nature of axonal and dendritic projections. Awake, behaving in vivo electrophysiological recordings have advantages when stimuli can be adequately controlled during self-guided behavior, but are limited when self-guided behavior interferes with stimulus control. Anesthetized in vivo methods can increase experimental control by removing active locomotion and behavioral variance, but introduce the caveats of systemically-altered synaptic and intrinsic activity due to anesthetic actions (Richards, 1983; Krnjevic, 1992; Ishizawa, 2007). Both slice (Hayashi et al., 1993; Dudley and Moss, 1995; Jia et al., 1999) and in vivo (Meredith and O'Connell, 1979; Reinhardt et al., 1983; Luo et al., 2003; Zhang et al., 2007; Hendrickson et al., in press) approaches have been used to study the AOS previously. We envisioned that an intermediate approach, one that attempts to maintain the connectivity benefits of in vivo studies while improving optical and electrophysiological access, would improve our capacity to study AOS processing in the AOB.
Ex vivo strategies have allowed neurophysiological and optical studies of mammalian circuit function to progress substantially over the past decades. Among the most well-known ex vivo preparations are retinal explants (Ames and Gurian, 1960). Retinal explants and Organ of Corti preparations (Flock and Strelioff, 1984) maintain circuits housed within a contained physical structure. In the AOS, maintenance of the circuit homologous to the retina requires dissection of two neural structures connected via ∼ 1 cm long axonal projections that pass through the cribriform plate. Ex vivo preparations of somatosensory neurons and the spinal cord have maintained the primary afferents and targets in the spinal cord in the face of similar obstacles (Ritter et al., 2000; Woodbury et al., 2001). The potential for maintaining even very large structures ex vivo exists via perfusion of oxygenated aCSF through the vasculature (Llinás and Mühlethaler, 1988; Mühlethaler et al., 1993; Babalian et al., 1997).
In this report, we present a novel ex vivo strategy for studying the AOS that maintains functional VNO-AOB connectivity. We describe an acute dissection method that quickly isolates the connected VNO and AOB within a single hemisphere of the mouse skull. We constructed a tissue chamber that allows fast superfusion and local oxygenation of the perfusate to extend the electrophysiological viability of the AOB. We found that AOB mitral cell responses to ectopic and natural stimuli are similar to those observed in vivo. We found histological evidence, using Fluoro-Jade C staining for dead and degenerating neurons, that the VNO and the AOB glomerular and mitral cell layers were protected from degeneration up to 6 hours post-dissection. We observed an increase in Fluoro-Jade C staining in the deeper AOB granule cell layer, but subsequent experiments indicated that GABAA-mediated inhibition onto AOB mitral cells remained intact. We conclude that this ex vivo strategy maintains functional VNO-AOB connectivity, allows for precise stimulus control, and improves optical and electrophysiological access to the AOB.
2. Materials and Methods
2.1. Ex vivo dissection and VNO cannulation
Male B6D2F1 mice (F1 hybrid between C57BL/6 and DBA/2 strains, Jackson Laboratories, Bar Harbor, ME) aged 8-12 weeks postnatal were anesthetized using isofluorane and decapitated. The dissection procedure is diagrammed in Figure 1. Throughout the initial dissection, the tissue is submerged in ice-cold artificial cerebrospinal fluid (aCSF) containing (in mM): NaCl 125, KCl 2.5, CaCl2 2, MgCl2 1, NaHCO3 25, NaH2PO4 1.25, Na-ascorbate 0.4, Na-pyruvate 2, myo-inositol 3, glucose 25. During initial dissection an additional 7 mM MgCl2 is added to the ice-cold aCSF to limit potential excitotoxicity. Following decapitation, the lower jaw is removed, and the scalp, facial skin, and orbital cavities are stripped (Fig. 1B). The brain and skull caudal to the frontal cortex is removed, leaving a small portion of the frontal cortical lobes attached to the olfactory bulbs (brain tissue shown in tan color in diagram; Fig. 1C, D1). The soft palate is removed from the ventral surface, allowing direct visualization of the vomeronasal organs (Fig. 1D2, red ovals on schematic diagram). Following soft palate removal, bones attached to the vomeronasal capsule are broken rostral and caudal to the contralateral VNO (gray lines in diagram, Fig. 1D2). Subsequently, the skull is divided at the midline by advancing a straight-edge razor from the caudal surface (i.e. first through the frontal cortical lobe) just contralateral to the midline (Fig. 1E1, E2). At this point, the maintained hemisphere contains both VNOs (Fig. 1E2, red ovals), bilateral septal tissue, the septal cartilage and bone, the ipsilateral olfactory bulb including the AOB (Fig. 1E2, pink oval at right) and a small portion of the frontal cortical lobe. Depending on the angle of the straight edge razor, a small section of contralateral olfactory bulb and frontal cortical lobe may overlie the ipsilateral tissue.
Figure 1. Ex vivo dissection strategy.
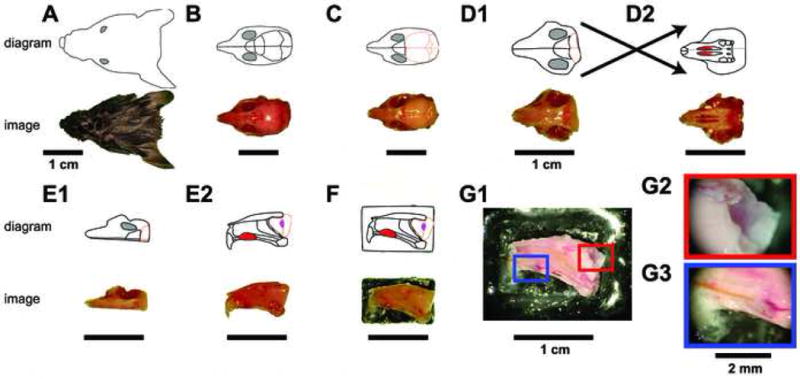
The connected VNO and AOB of adult male B6D2F1 mice were isolated by performing the diagrammed steps in ice-cold aCSF. For each step, a digital image is shown at the bottom, and a schematic diagram shown on top. Following decapitation (A), the lower jaw, scalp, and external sensory structures are removed from the skull (B). The skull overlying the cerebral cortex and cerebellum is then removed (C), followed by removal of the majority of the brain posterior to the olfactory bulbs (D1). The soft palate is then detached, revealing the two vomeronasal organs (D2 top, red oval structures). The bone surrounding the VNO capsule is broken on the contralateral hemisphere (not shown) using a scalpel point, followed by a careful hemispherectomy of the contralateral portion of the skull (E1). Upon turning the hemisphere on its lateral edge, the VNO can be seen from its medial face (E2 top, red oval), along with the septal cartilage and bone. The olfactory bulb (E2 top, peach outline) containing the accessory olfactory bulb (E2 top, magenta oval) can be visualized. The lateral face of the hemisphere is then affixed to a plastic plank via tissue adhesive (F) and placed into the perfusion chamber. (G) The final dissection steps are performed in the perfusion chamber at room temperature. Following removal of all contralateral tissue, attached ipsilateral frontal cortex, and the septal bone and cartilage (G1), the AOB becomes visible (G2) and a stimulus cannula is threaded under visual control into the VNO lumen (G3).
After one intact hemisphere has been removed, the lateral surface of the snout is adhered to a small, flat delrin plastic platform with tissue glue (Fig. 1F). The platform is then immediately adhered inside a custom delrin plastic tissue chamber (see Fig. 2) using a small volume of silicone grease. Once inside the tissue chamber, oxygenated, room-temperature (23 – 25 °C) aCSF is actively perfused around the tissue at 7-8 mL/min. The final dissection procedures are especially delicate, and the additional support afforded by placement within the tissue chamber improves experimental outcome greatly. In the tissue chamber, remaining contralateral olfactory bulb and cortex is removed, followed by careful separation of the ipsilateral frontal cortex from the AOB (Fig. 1G1, G2). Then, the contralateral septal tissue, septal cartilage, septal bone, and contralateral VNO capsule are removed (Fig. 1G1, G3). At this stage, a small-diameter (0.0057 inch internal diameter) polyimide cannula attached to a pressure-driven solution-switching device (Automate Scientific, Berkeley, CA) is threaded into the VNO capsule, and pH-buffered, oxygenated Ringer's solution is perfused into the VNO lumen at a rate of 0.2-0.4 mL/min. Our superfusion strategy (see Materials and Methods Section 2 and Figure 2) ensured little chance of spill-over of stimuli from the VNO cannula to the AOB. At average flow rates, stimulus solution is diluted at least 20-fold in the superfusing aCSF. Additionally, the high-flow rate superfusion solution enters the recording chamber very near the AOB surface and the exit channel is near the VNO, meaning any VNO stimulus dilution happens against prevailing superfusion currents. To visualize the pattern of fluid flow, we injected Chicago Sky Blue diluted in Ringer's solution into the VNO through our stimulus cannula and observed dye diffusion via the dissection microscope. This verified that the majority of injected dye was immediately flushed into the exit channel by the bulk solution flow (data not shown). Some dye became caught in eddy currents, but did not visibly accumulate near the AOB over 5 minutes of observation. VNO Ringer's solution contained (in mM): NaCl 115, KCl 5, CaCl2 2, MgCl2 2, NaHCO3 25, HEPES 10, glucose 10. All reagents were purchased from Sigma (St. Louis, MO) unless otherwise noted. Animal protocols were approved by the Washington University Animal Studies Committee.
Figure 2. Ex vivo perfusion chamber schematic.
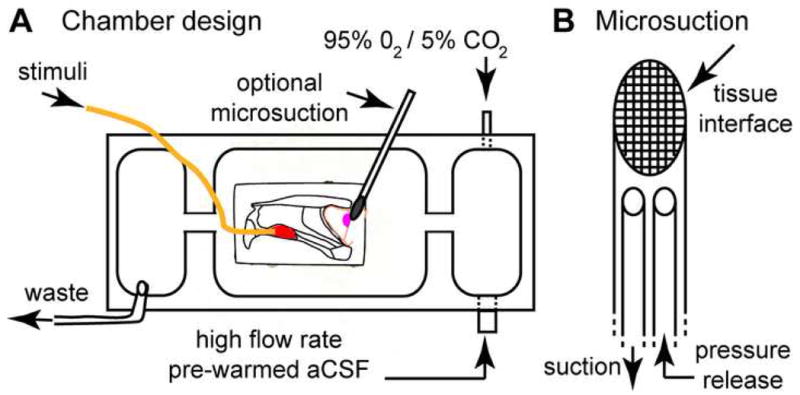
(A) VNO-AOB ex vivo preparations were placed in a custom tissue perfusion chamber designed per this schematic. Warmed, oxygenated aCSF is driven at ∼7.5 mL/min via a peristaltic perfusion pump (not shown) into a small antechamber (right). In this antechamber, the perfusion aCSF was re-oxygenated with 95% O2/5% CO2. This oxygen-rich aCSF entered the main chamber via an opening near the AOB (magenta oval). In some experiments, a small microsuction device was placed at the lateral face (i.e. the surface facing downward into the page) of the main olfactory bulb to encourage deep tissue perfusion. Stimuli were delivered into the VNO (red oval) through a polyimide cannula (orange line) at 0.2-0.4 mL/min. Waste solution was removed from a third chamber physically separated from the main chamber to reduce surface vibrations. (B) Detailed diagram of micro-suction device design. A series of fine nylon mesh screens (10-50 μm in diameter, with smallest pore size at tissue interface) were affixed to a polyimide suction wand. A pressure release cannula was threaded into the lumen of the device and left open to the superfusion solution in order to normalize suction pressure at the tissue interface over time.
2.2. Physiology chamber construction
A custom tissue chamber for electrophysiology was constructed from black delrin polymer (McMaster-Carr, Santa Fe Springs, CA). A schematic for this chamber is shown in Fig. 2. Inlet solution was pre-heated to 35−40 °C and pre-oxygenated (not shown). The pre-warming and pre-oxygenation step served to reduce the burden on the in-line temperature controllers and prevent outgassing inside the perfusion tubing. Perfusion solution temperature was then controlled very near the chamber inlet via parallel in-line heater elements under control of a digital temperature controller (Multichannel Systems, Reutlingen, Germany). The temperature in the chamber was monitored every hour via a digital thermometer (Omega Engineering, Stamford, CT) and adjustments made via the temperature controller as necessary. The tissue chamber is built with an initial 95% O2/5%CO2 bubbling chamber to maximize solution oxygenation and maintain proper pH (Fig. 2). Following a series of channels to limit transmission of fluid waves, the solution enters the main chamber containing the VNO-AOB ex vivo preparation. The volume of this main chamber (∼ 4 mL) was minimized to increase the rate of total solution exchange directly around the tissue. At 7-8 mL/min flow rates, this allows for 1-2 complete exchanges of fluid volume per minute. A suction tube is placed at the fluid surface within a suction well separated from the main chamber by a series of channels to remove spent aCSF.
In order to encourage flow of oxygenated aCSF through deep layers of the AOB, in a subset of experiments we applied suction to the lateral face of the MOB using a microsuction device (Fig. 2B). This device was constructed of multi-wall polyimide tubing (0.039-0.042 inches in diameter). The tube end was beveled and a series of nylon meshes (10-50 μm pore size, with the finest mesh at the tissue interface) was adhered to the beveled surface. In order to limit suction build-up, a pressure release cannula was attached near the suction device head. This design resulted in a maximum pressure difference of 7.2 kPa at the device head as measured by a digital manometer (Dwyer Instruments, Michigan City, IN). Typical pressure values during operation were between 1.5 and 2.5 kPa. Following the dissection procedure (Methods, Section 1), the device was placed at the dorsal/lateral surface, with the mesh face parallel to the tissue surface. We found this microsuction device to be sufficient to draw perfusing aCSF through the tissue as evidenced by observing injected Chicago Sky Blue (Sigma, St. Louis, MO) diffusion profiles through the stereomicroscope (data not shown).
2.3. Fluoro-Jade C histochemistry
Following dissection and incubation in the ex vivo chamber or in a petri dish warmed to 33 °C, the VNO or entire olfactory bulb was removed and fixed in 4% paraformaldehyde for 8-24 hours. The tissue was embedded in 5% agarose and 50-70 μm sections were cut using a vibratome (Vibratome, St. Louis, MO). Sections were mounted on gelatinized slides, rinsed, and allowed to dry overnight. The slides were rehydrated into 100% H2O through an ethanol dilution series (100%, 70%, 30%, 0%) for two minutes in each dilution. Slides were then immersed in a 0.06% solution of KMnO4 for 20 minutes, followed by 3 rinses in 100% H2O. The slides were then exposed to a 0.001% solution of Fluoro-Jade C (Millipore/Chemicon, Temecula, CA) for 30 minutes, followed by 3 final rinses in 100% H2O.
We quantified Fluoro-Jade C staining using custom software in MatLab (Math-works, Natick, MA). Analysis was conducted blind with respect to treatment condition. We counted the total number of fluorescent puncta in each section demonstrating >2-fold greater fluorescence intensity than background. We then identified cellular regions (the vomeronasal epithelium in the VNO, and the glomerular, mitral and granule layers in the AOB) using a drawing tool in MatLab. We divided the total number of cells in the region by the region area. At least three sections per sample were counted, and the mean numbers of puncta per section were pooled for cross-condition comparisons. We repeated experiments in triplicate for all conditions except the 4-hour chamber + microsuction condition in the AOB, for which 5 samples were analyzed. Statistical significance was determined using the unpaired, two-tailed Student's t-test, with significance threshold set to p < 0.05.
2.4. Electrophysiology
Borosilicate glass capillary tubes (1.0 mm outer diameter, World Precision Instruments, Sarasota, FL) were pulled on a horizontal microelectrode puller (Sutter Instrument Co., Novato, CA) with a thin shank to a tip diameter of 1-2 μm (5-10 MΩ resistance in bath). Electrodes were advanced into the AOB using a motorized single axis micromanipulator with attached digital micrometer (Siskiyou Design Instruments, Grants Pass, OR). Electrodes were advanced at ∼50 μm/min through the superficial 100 μm of tissue (mostly axonal and glomerular layers). Subsequently, advancement proceeded more slowly, <25 μm/min, to avoid tissue compression and to minimize tissue creep during recordings. During electrode advancement, 10s pulses of 50 mM KCl-containing Ringer's solution were delivered to the VNO every 1-2 minutes in order to encourage AOB neurons to spike. Large, wide (>1 ms) positive-polarity spikes were typical of neurons in the mitral cell layer as seen in example waveforms in Fig. 4A. Upon encountering a putative mitral cell, electrode advancement was stopped, and the cell waveform monitored for > 5 minutes before beginning stimulus paradigms.
Figure 4. Mitral cell responses to VSN stimulation with High K+ solution.

(A) Extracellular mitral cell recording configuration. An extracellular glass electrode was advanced into the AOB (magenta oval) while stimuli were applied to the VNO lumen (red oval) via a polyimide cannula. (B) Recording from a single trial stimulus pair. Top: stimulation of VSNs with 50 mM K+ Ringer's solution (“high K+”, solid black bar) induced spiking in the mitral cell. Inset: sorted spike waveforms from this trial. (C) Peristimulus time histograms in baseline (C1) and following 10 minutes of superfusion with 3 μM SR95531 (gabazine, C2). Exposure to gabazine increased the evoked activity in this cell by an average of 3.1 Hz over the 7-second integration window. Stimulus time: 5 s (solid black bar). (D) Mitral cell spontaneous activity did not significantly increase during exposure to 3 μM gabazine (p = 0.52, n = 7). (E) Mitral cell responses to VNO stimulation was significantly increased during exposure to 3 μM gabazine (p < 0.05, n = 7), indicating inhibitory activity remains present in ex vivo preparations over the 6-hour recording period.
Extracellular spikes were recorded using a Dagan BVC-700A amplifier with an extracellular headstage and pre-amplification module (Dagan Instruments, Minneapolis, MN) and digitized at 10 kHz using an analog-digital converter (National Instruments, Austin, TX). Stimuli were delivered using a 16-valve pneumatic delivery system (AutoMate Scientific, Berkeley, CA). Stimulation paradigms consisted of 5-or 10-second stimuli followed by 25 or 50 second delay periods during which Ringer's solution was delivered continuously. Cells that did not respond to any stimuli, including 50 mM KCl-containing Ringer's solution, with an augmentation of their firing rate were not further analyzed (∼10% of cells encountered). To quantify firing rate over the time course of repeated trials, the average firing rate in 1 second bins was calculated using custom routines in MatLab. The overall change in firing rate, , was computed as the average firing rate during the stimulus plus two seconds following the stimulus minus the baseline firing rate (averaged over 5 seconds preceding the stimulus, ). We quantified the selectivity of individual mitral cells by calculating a selectivity index similarly to Hendrickson et al. (in press):
where and represent the changes in firing rate to the “preferred” stimulus and “non-preferred” stimulus, respectively. is the standard deviation of the basal firing rate. Only cells which responded to either male or female urine dilutions with significant values (p < 0.05 compared to Ringer's controls, unpaired two-tailed Student's t-test) were subsequently analyzed for selectivity. We quantified the degree of mixture suppression when male/female urine mixtures were applied similarly to Hendrickson et al. (in press). Mixture suppression was calculated as:
where is the change in firing rate when the preferred and non-preferred stimuli were presented simultaneously at equal dilutions. Bootstrap 95% confidence intervals were calculated for selectivity values, and only cells which had 95% confidence intervals which did not contain zero were considered for mixture suppression analysis.
Male and female mouse urine was collected as previously described (Nodari et al., 2008). Balb/c (Jackson Laboratories) mice were suspended in cages with fine wire mesh bottoms above liquid nitrogen. Urine passing through the screen was flash frozen and stored at −80 °C until pooling. Frozen urine from 30-40 mice of each sex was thawed, pooled, and centrifuged at 500-1000 RPM for 1 minute to remove particulate impurities at the end of the 2-3 week collection period. Pooled samples were aliquoted at small volumes and maintained frozen at −80 °C until use. Urine stimulus solutions were made by diluting liquid urine samples into pH-buffered, oxygenated Ringer's solution.
3. Results
3.1. VNO-AOB functional connectivity is maintained and AOB tissue health is preserved
Because VSN axons remain ipsilateral and superficial to the midline along their paths to the AOB (see Belluscio et al., 1999) we envisioned that a dissection could be developed to acutely isolate a single hemisphere of the anterior portion of the mouse skull containing the connected VNO and AOB. By separating the dissection procedure into an initial, rapid dissection of the anterior hemisphere and a secondary, more meticulous dissection of tissue overlaying the VSN axons, we were able to produce electrophysiologically-connected preparations on ∼ 90% of attempts. Because the maximal depth of the AOB is ∼ 700 μm, only slightly greater than the thickness of many slice preparations, we hypothesized that a superfusion-only approach may be sufficient to maintain the AOB circuit over the course of the acute (∼ 6 hour) experimental time frame.
To assess the health of the tissue, we utilized the Fluoro-Jade C method for labeling dead and degenerating neurons (Schmued et al., 2005; Fig. 3). Fluoro-Jade C is reported to label dead and dying neurons and their processes independently of the mechanism of cell death (Schmued et al., 2005). VNO-AOB preparations were maintained in the recording chamber for up to six hours post-sacrifice at 33 – 35 °C. We quantified the number of labeled puncta in sections from the VNO and AOB. We found no significant increase in the number of Fluoro-Jade C positive cells in the VNO or in the AOB glomerular and mitral cell layers compared to samples fixed immediately following the hemispherectomy step (Fig. 1E, Fig. 3B, E, G-H). In contrast, when the tissue was not superfused and left in ACSF at 33°C for 4-6 hours, we saw an increase in Fluoro-Jade puncta in all tissue regions (Fig. 3C, F, G-I). These results indicate the dissection procedure and superfusion strategy protect against cell death in the VNO and AOB glomerular and mitral layers for up to 6 hours post-sacrifice.
Figure 3. Fluoro-Jade C staining reveals trends in tissue health.

Fluoro-Jade C staining labels dead and degenerating neurons regardless of the type of degeneration process (Schmued et al., 2005). (A-F) Montage images of VNO (A-C) and AOB (D-F) sections taken from dissection-only (A, C), physiology chamber plus microsuction (B, E), and unoxygenated, warmed aCSF (C, F, “unperfused”) conditions are shown for reference. (A, D) In control sections, very few bright, punctate areas were present in the vomeronasal epithelium (A) or the AOB glomerular, mitral, or granule cell layers (D). (B, E) Following 6 (VNO, panel B) or 4 (AOB, panel E) hours in the physiology chamber at 33 – 35 °C, relatively few punctate areas were visible in the glomerular and mitral cell layers. (C, F) When VNO-AOB ex vivo preparations were placed in unperfused, unoxygenated aCSF at 33 – 35 °C, we saw substantial global increases in Fluoro-Jade C staining, indicative of widespread neuronal death and degeneration. (G) Quantification of punctate staining in the vomeronasal epithelium after 6 hours showed no increase in cell degeneration in the perfusion chamber compared to dissection-only controls. (H) Quantification of punctate staining in the AOB glomerular and mitral cell layers indicated the perfusion chamber provided significant protection from damage (blue symbols) compared with the unoxygenated tissue (green symbols), especially at the 4 and 6 hour time points (p < 0.001, n = 3). (I) We encountered evidence of degeneration in the granule cell layer under normal superfusion conditions (blue symbols). To encourage perfusion through deeper tissue layers, we drew solution through the tissue using a microsuction device (E). Microsuction for 4 hours in the tissue chamber reduced mean staining in the granule cell layer to a level intermediate between “unperfused” (p = 0.2, n = 5) and “dissection only” (p = 0.5, n = 5; (H, I, red symbols). Abbreviations: VE, vomeronasal epithelium; L, vomeronasal lumen; GL, glomerular layer; MCL, mitral cell layer; GCL, granule cell layer; LOT, lateral olfactory tract.
Although we found no histological evidence for cellular degeneration in the AOB glomerular and mitral cell layers from tissue maintained in the perfusion chamber, we did observe an increase in the number of Fluoro-Jade C positive puncta in the granule cell layer (Fig. 3I). This suggested that despite the high flow rate through the tissue chamber, passive diffusion may not be completely able to supply oxygen and nutrients to deeper cell layers. Therefore, in order to encourage perfusion of aCSF through deeper AOB layers, we constructed a microsuction device comprised of a series of fine nylon meshes attached to suction via a rigid polyimide cannula (Fig. 2). This light suction was able to cause directional diffusion of Chicago Sky Blue through the AOB towards the suction device (data not shown). We performed Fluoro-Jade C staining on AOB sections following 4 hours in the ex vivo chamber utilizing microsuction (Fig. 3E, H-I; red symbols). We found significantly lower Fluoro-Jade C staining in the glomerular/mitral region (Fig. 3H; p < 0.02, n = 5) and lower mean staining values in the granule cell layer, although these values did not reach statistical significance (Fig. 3I; p = 0.2, n = 5).
To directly test the functional connectivity between VSNs and their targets in the AOB in the ex vivo preparation, we recorded from mitral cells using borosilicate glass electrodes while stimulating VSNs with Ringer's solution containing 50 mM KCl (Fig. 4). This high K+ solution has been shown to rapidly depolarize VSNs, eliciting sustained spiking in VSNs and downstream AOB mitral cells over 5-10s stimulation times (Holy et al., 2000; Stowers et al., 2002; Hendrickson et al., in press). Mitral cells responded to KCl stimulation with values of 5.3 ± 1.5 Hz (N = 23 cells). Mitral cell spontaneous activity (1.4 ± 0.2 Hz) was similar to awake in vivo (2.8 ± 0.2 Hz; Luo et al., 2003) and anesthetized in vivo (0.6-2.3 Hz interquartile range; Hendrickson et al., in press) reports. Thus, we find that mitral cells in this ex vivo preparation are excited by VSN stimulation and have similar spontaneous and evoked response properties to previous in vivo reports.
3.2. AOB mitral cells receive inhibitory input in the VNO-AOB ex vivo preparation
Mitral cells are driven to fire action potentials by pheromones contained in urine and often show a high selectivity for either male or female urine (Luo et al., 2003; Zhang et al., 2007; Hendrickson et al., in press). As in previous in vivo studies, we found that mitral cells in the VNO-AOB ex vivo preparation responded strongly to stimulation of VSNs with male and female urine diluted in normal Ringer's solution (Fig. 5). We found 43 of 53 mitral cells (81%) recorded during male and female urine stimulation responded significantly to either 1:100 diluted Balb/c male or female mouse urine (Fig. 5B-C). The majority of cells fell in to 3 broad categories: strongly male-selective (selectivity index < -0.5, 12/43 or 28%), strongly female-selective (selectivity index > 0.5; 12/43 or 28%), and non-selective (-0.25 < selectivity index < 0.25; 11/43 or 26%) (Fig. 5C).
Figure 5. Mitral cell responses to VSN stimulation with dilute male and female mouse urine.
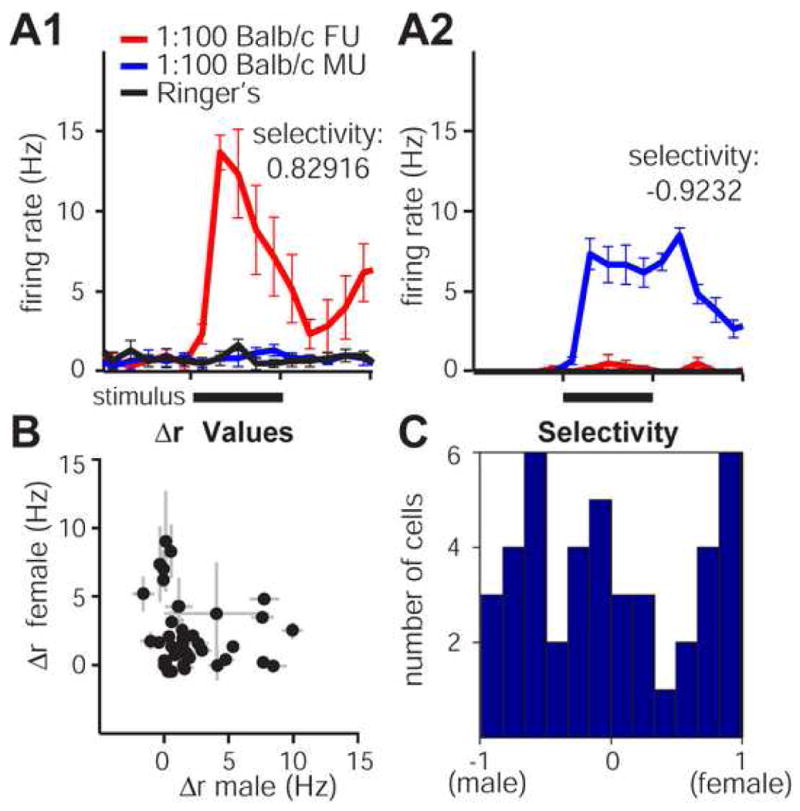
(A) Mitral cells in ex vivo preparations respond to dilute conspecific male and female urine. (A1) This mitral cell responded strongly to 5 s VNO stimulation with 1:100 diluted Balb/c strain female urine (red trace, stimulus indicated by solid black bar) but not 1:100 dilute male urine (blue trace) or Ringer's control (black trace). The selectivity index for this response was 0.82916, indicating that this cell was “strongly female-selective”. (A2) Example of a strongly male-selective cell from a separate recording. (B) profiles from 43 mitral cells that responded significantly to either 1:100 Balb/c male or female urine. (C) Histogram of selectivity values for the 43 cells in (B). 24 of the 43 cells met our criteria for classification as “strongly-selective” (selectivity index > |0.5|). 11 of the 43 cells were considered “non-selective” for urine based on sex of origin (selectivity index < |0.25|). Error bars represent standard errors of the mean.
Although we found that mitral cell activity in the VNO-AOB ex vivo preparation correlates well with previous results, the increase in Fluoro-Jade C staining in the deeper granule cell layers caused concerns about inhibitory function in the AOB. Reciprocal and laterally-connected inhibitory synapses are formed between AOB granule, periglomerular, and mitral cells (Brennan and Keverne, 1997; Luo and Katz, 2004). Recent in vivo studies indicate that laterally-connected inhibition shapes the responses of AOB mitral cells to the naturally-occurring pheromone combinations found in conspecific male and female urine (Hendrickson et al., in press).
In order to test for functional GABAA receptor-mediated inhibition, we first recorded mitral cell responses before and after treatment with 3 μM SR95531 (gabazine), a selective inhibitor of GABAA receptors (Fig. 4C-E). Mitral cell firing rates in response to KCl stimuli increased significantly following 10 minutes of exposure to gabazine in the perfusing solution (an increase of 1.5 ± 0.6 Hz, p < 0.05, n = 7 cells; Fig. 4). Gabazine had no significant effect on mitral cell spontaneous activity (0.5 ± 0.2 Hz baseline versus 0.8 ± 0.5 Hz following gabazine exposure, p = 0.5, n = 7). We found that increasing gabazine concentration from 3 to 10 μM caused mitral cells to become rhythmic in their spontaneous activity and inconsistent in their responses to VSN stimulation, suggesting that more complete blockade of spontaneous GABAA conductances may induce seizure-like activity in the intact AOB (data not shown).
We did occasionally encounter mitral cells which were directly inhibited by urine, but because most cells had relatively low spontaneous rates, in these cells was low compared to excitatory responses (see 5B). Recent studies indicated that a hallmark of laterally-connected inhibition in the AOB is so-called “mixture suppression”, where a cell's response to its preferred stimulus is dampened by mixing preferred with non-preferred stimuli (Hendrickson et al., in press). To determine whether AOB mitral cells in the VNO-AOB ex vivo preparation demonstrate mixture suppression, we delivered 1:200 diluted male and female urine as well as 1:200 male + 1:200 female urine mixtures to VSNs while recording from AOB mitral cells (Fig. 6). We calculated mixture suppression as described in the Materials and Methods section. The mixture suppression metric produces negative values when the mixture (preferred + non-preferred stimuli) reduces compared to the preferred stimulus alone. We found that the majority of mitral cells (6 of 9 or 67%) showed some evidence of mixture suppression, further indicating that mitral cells in the VNO-AOB ex vivo preparation respond similarly to those observed in vivo and receive functional inhibition.
Figure 6. Mitral cell responses to VSN stimulation with male and female mouse urine mixtures.
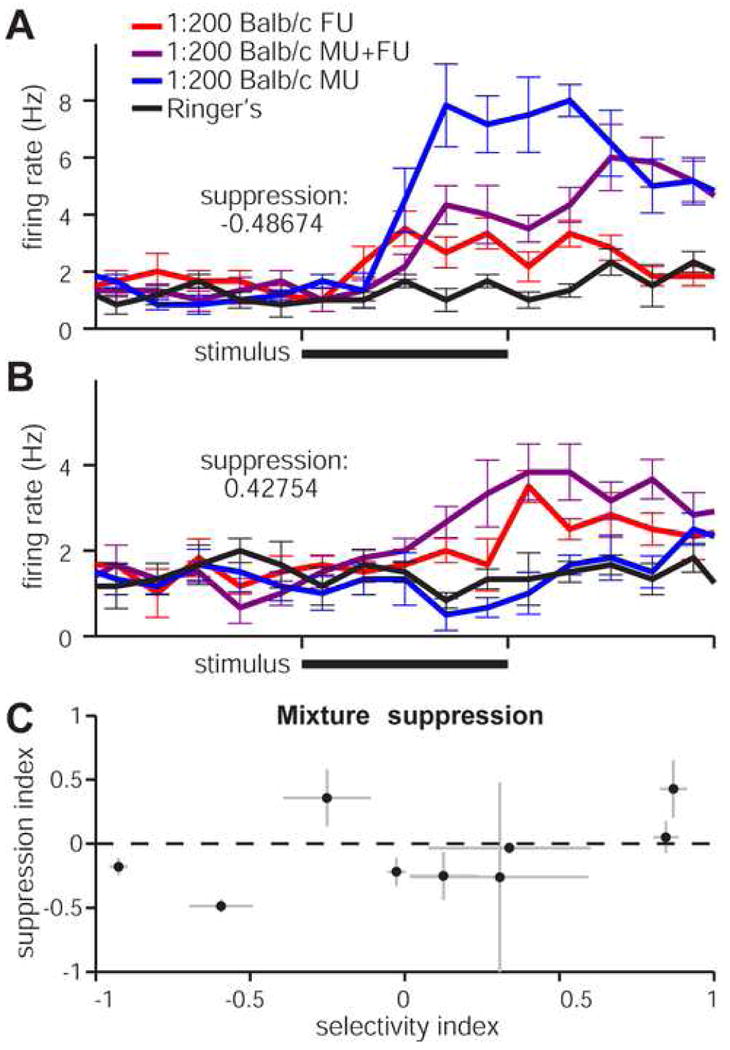
(A) Peristimulus time histograms for a cell that was suppressed by stimulating the VNO for 5s (solid black bars) with a mix of preferred (1:200 male urine, blue trace) and non-preferred (1:200 female urine, red trace) stimuli. The 1:200 mixture (purple trace) induced firing rates below those seen for the preferred stimulus alone, indicating intact laterally-connected inhibition within the ex vivo circuit. 6 of 9 cells exposed to these stimuli had suppression indices below zero. (B) An example mitral cell that did not undergo mixture suppression. The mixed stimulus (purple trace) elicited higher firing rates than the preferred stimulus alone (female urine, red trace). (C) Scatter plot of the 9 cells in this study. Suppression index, ranging from -1 (most suppressed) to +1 (enhanced), is plotted against the selectivity index (-1 = male-selective, +1 = female-selective).
4. Discussion
4.1. Development of a stable, acute ex vivo preparation for studying AOS network function
Acute preparations of brain tissue have predominated in small circuit-level neuroscience for decades. Acute preparations from mammalian CNS tissues have typically reduced the volume of brain tissue studied via subdissection and slicing of a particular brain region, damaging neurons at the cut surface, and severing many important intrinsic and extrinsic connections. In crustaceans, (Hartline and Maynard, 1975; Marder, 1976), fish (Tomizawa et al., 2001), amphibians (Werblin, 1974), and reptiles (Baylor and Fuortes, 1970; Kriegstein, 1987; Rosenberg and Ariel, 1990), ex vivo methods have been used for decades to study intact neural subsystems. However, the neurons and neural systems of these animals are functional under low perfusion rates and at low temperatures, unlike mammalian neural systems. Despite the experimental challenges associated with studying mammalian neurons, ex vivo methods continue to be developed to study mammalian sensory processing across brain regions and in intact CNS structures (Llinás and Mühlethaler, 1988; Mühlethaler et al., 1993; Lo and Mize, 1999; Ritter et al., 2000; Woodbury et al., 2001). Studying the AOS in vivo and ex vivo is particularly challenging due to the relative inaccessibility of the VNO and the long and delicate projections between the VNO and AOB.
We developed a novel dissection which isolates the VNO and AOB within a single hemisphere of the anterior portion of the mouse head without compromising the delicate VSN axons (Fig. 1). We constructed a custom physiology chamber capable of rapidly superfusing richly-oxygenated, body-temperature aCSF around the AOB and, at the same time, continuously perfusing the vomeronasal epithelium with fresh oxygenated Ringer's-based stimuli. We found that the histological integrity of the AOB was maintained, especially in the more superficial mitral and glomerular layers, for at least 6 hours at 33 – 35 °C (Fig. 3). Moreover, mitral cells recorded in ex vivo preparations showed similar behaviors to awake and anesthetized in vivo reports in all the stimulus paradigms we tested (Figs. 4, 5, 6).
Although histological studies indicated that the deeper inhibitory granule cell layer may undergo degeneration over the time course of ex vivo experiments, we found physiological evidence of intact inhibition (Figs. 4, 6) and were able to reduce histological signs of degeneration using microsuction (Fig. 3). The histological data are somewhat difficult to interpret, as the correlation between Fluoro-Jade C staining and electrophysiological function is not known. The presence of functional inhibition onto mitral cells suggests that the neural degeneration detected by Fluoro-Jade C over the time course of several hours does not eliminate spontaneous or stimulus-driven inhibition in the AOB ex vivo. We therefore conclude that AOB mitral cell function retains the key known physiological hallmarks observed in vivo, and is an appropriate platform for studying sensory processing between the VNO and AOB. Regardless, the potential for changes in inhibitory tone over the acute experimental time frame should be taken into consideration, and ex vivo experiments exceeding 6 hours should be approached with caution. In the future, recordings from granule cells in ex vivo preparations may clarify the extent of any deep-layer degeneration over time.
4.2. Potential utility of ex vivo approaches for mammalian CNS function
In this report, we detail the basic procedures necessary to extract the intact VNO-AOB portion of the AOS. Although the dissection procedure is complicated and delicate, it is possible to achieve ∼90% success rates. Because the procedure does not require maintaining the experimental animal alive under anesthesia, the geometrical/space constraints often involved in CNS surgeries are greatly reduced. The physiological chamber we designed is relatively simple and replicable. There are relatively few theoretical limitations to extending this ex vivo approach to other sensory or central neural networks. Based on our results, one major limitation will be limiting the absolute depth/thickness of intact tissues. The deep layers of the AOB sensitive to degeneration are > 500 μm from the tissue surface. Therefore we estimate superfusion-only approaches must limit tissue depth to < ∼1 mm. Our attempts to increase deep tissue perfusion using microsuction were encouraging, but will likely need to be further refined to increase their efficacy. Cannulation and perfusion of nearby arterioles was not achieved as has been accomplished in guinea pig (Llinás and Mühlethaler, 1988; Mühlethaler et al., 1993; Babalian et al., 1997), but would certainly aide in deep-layer perfusion if methods continue to improve.
Many current in vivo methodologies require maintaining animals under deep anesthesia due to the extreme methods needed to expose brain regions, introducing difficult-to-interpret changes in network function by altering intrinsic excitability, inhibitory function and excitatory function (Richards, 1983; Krnjevic, 1992; Ishizawa, 2007). Our ex vivo approach removes the potential confounds of systemic anesthesia, and improves pharmacological access to the CNS via fast-flowing superfusion. For this reason, data acquired using ex vivo approaches should provide a basis for comparison with anesthetized data, and in some cases may more accurately reflect awake in vivo conditions than anesthetized preparations. Although ex vivo approaches in mammals have not yet achieved the astounding ex vivo capabilities of neural systems in invertebrates and lower vertebrates, we believe that this approach in mammals may help to bridge existing gaps between single neuron and intact network function.
Acknowledgments
We thank members of the lab, namely Rebecca Hendrickson, Xiaoyan Fu, Hannah Arnson, Illya Tolokh, Diwakar Turaga, and Zhongsheng Guo, for their continuous advice and support. This work was supported by a grant from the Mathers Foundation (TEH) and support from the W.M. Keck Fellowship in Molecular Medicine (JPM).
Footnotes
Publisher's Disclaimer: This is a PDF file of an unedited manuscript that has been accepted for publication. As a service to our customers we are providing this early version of the manuscript. The manuscript will undergo copyediting, typesetting, and review of the resulting proof before it is published in its final citable form. Please note that during the production process errors may be discovered which could affect the content, and all legal disclaimers that apply to the journal pertain.
References
- Ames A, Gurian BS. Measurement of function in an in vitro preparation of mammalian central nervous tissue. J Neurophysiol. 1960 Nov;23:676–691. doi: 10.1152/jn.1960.23.6.676. [DOI] [PubMed] [Google Scholar]
- Babalian A, Vibert N, Assie G, Serafin M, Mühlethaler M, Vidal PP. Central vestibular networks in the guinea-pig: functional characterization in the isolated whole brain in vitro. Neuroscience. 1997 Nov;81(2):405–426. doi: 10.1016/s0306-4522(97)00069-9. [DOI] [PubMed] [Google Scholar]
- Baylor DA, Fuortes MG. Electrical responses of single cones in the retina of the turtle. J Physiol. 1970 Mar;207(1):77–92. doi: 10.1113/jphysiol.1970.sp009049. [DOI] [PMC free article] [PubMed] [Google Scholar]
- Belluscio L, Koentges G, Axel R, Dulac C. A map of pheromone receptor activation in the mammalian brain. Cell. 1999 Apr;97(2):209–220. doi: 10.1016/s0092-8674(00)80731-x. [DOI] [PubMed] [Google Scholar]
- Brennan PA, Keverne EB. Neural mechanisms of mammalian olfactory learning. Prog Neurobiol. 1997 Mar;51(4):457–481. doi: 10.1016/s0301-0082(96)00069-x. [DOI] [PubMed] [Google Scholar]
- Dudley CA, Moss RL. Electrophysiological evidence for glutamate as a vomeronasal receptor cell neurotransmitter. Brain Res. 1995 Mar;675(12):208–214. doi: 10.1016/0006-8993(95)00075-2. [DOI] [PubMed] [Google Scholar]
- Flock A, Strelioff D. Graded and nonlinear mechanical properties of sensory hairs in the mammalian hearing organ. Nature. 1984;310(5978):597–599. doi: 10.1038/310597a0. [DOI] [PubMed] [Google Scholar]
- Hartline DK, Maynard DM. Motor patterns in the stomatogastric ganglion of the lobster panulirus argus. J Exp Biol. 1975 Apr;62(2):405–420. doi: 10.1242/jeb.62.2.405. [DOI] [PubMed] [Google Scholar]
- Hayashi Y, Momiyama A, Takahashi T, Ohishi H, Ogawa-Meguro R, Shigemoto R, Mizuno N, Nakanishi S. Role of a metabotropic glutamate receptor in synaptic modulation in the accessory olfactory bulb. Nature. 1993 Dec;366(6456):687–690. doi: 10.1038/366687a0. [DOI] [PubMed] [Google Scholar]
- Hendrickson RC, Krauthamer S, Essenberg JM, Holy TE. Inhibition shapes sex-selectivity in the mouse accessory olfactory bulb. J Neurosci. doi: 10.1523/JNEUROSCI.2715-08.2008. in press. [DOI] [PMC free article] [PubMed] [Google Scholar]
- Holy TE, Dulac C, Meister M. Responses of vomeronasal neurons to natural stimuli. Science. 2000 Sep;289(5484):1569–1572. doi: 10.1126/science.289.5484.1569. [DOI] [PubMed] [Google Scholar]
- Ishizawa Y. Mechanisms of anesthetic actions and the brain. J Anesth. 2007;21(2):187–199. doi: 10.1007/s00540-006-0482-x. [DOI] [PubMed] [Google Scholar]
- Jia C, Chen WR, Shepherd GM. Synaptic organization and neurotransmitters in the rat accessory olfactory bulb. J Neurophysiol. 1999 Jan;81(1):345–355. doi: 10.1152/jn.1999.81.1.345. [DOI] [PubMed] [Google Scholar]
- Kriegstein AR. Synaptic responses of cortical pyramidal neurons to light stimulation in the isolated turtle visual system. J Neurosci. 1987 Aug;7(8):2488–2492. [PMC free article] [PubMed] [Google Scholar]
- Krnjevic K. Cellular and synaptic actions of general anaesthetics. Gen Pharmacol. 1992 Nov;23(6):965–975. doi: 10.1016/0306-3623(92)90274-n. [DOI] [PubMed] [Google Scholar]
- Llinás R, Mühlethaler M. Electrophysiology of guinea-pig cerebellar nuclear cells in the in vitro brain stem-cerebellar preparation. J Physiol. 1988 Oct;404:241–258. doi: 10.1113/jphysiol.1988.sp017288. [DOI] [PMC free article] [PubMed] [Google Scholar]
- Lo FS, Mize RR. Retinal input induces three firing patterns in neurons of the superficial superior colliculus of neonatal rats. J Neurophysiol. 1999 Feb;81(2):954–958. doi: 10.1152/jn.1999.81.2.954. [DOI] [PubMed] [Google Scholar]
- Luo M, Fee MS, Katz LC. Encoding pheromonal signals in the accessory olfactory bulb of behaving mice. Science. 2003 Feb;299(5610):1196–1201. doi: 10.1126/science.1082133. [DOI] [PubMed] [Google Scholar]
- Luo M, Katz LC. Encoding pheromonal signals in the mammalian vomeronasal system. Curr Opin Neurobiol. 2004 Aug;14(4):428–434. doi: 10.1016/j.conb.2004.07.001. [DOI] [PubMed] [Google Scholar]
- Marder E. Cholinergic motor neurones in the stomatogastric system of the lobster. J Physiol. 1976 May;257(1):63–86. doi: 10.1113/jphysiol.1976.sp011356. [DOI] [PMC free article] [PubMed] [Google Scholar]
- Meredith M, O'Connell RJ. Efferent control of stimulus access to the hamster vomeronasal organ. J Physiol. 1979 Jan;286:301–316. doi: 10.1113/jphysiol.1979.sp012620. [DOI] [PMC free article] [PubMed] [Google Scholar]
- Mühlethaler M, de Curtis M, Walton K, Llinás R. The isolated and perfused brain of the guinea-pig in vitro. Eur J Neurosci. 1993 Jul;5(7):915–926. doi: 10.1111/j.1460-9568.1993.tb00942.x. [DOI] [PubMed] [Google Scholar]
- Nodari F, Hsu FF, Fu X, Holekamp TF, Kao LF, Turk J, Holy TE. Sulfated steroids as natural ligands of mouse pheromone-sensing neurons. J Neurosci. 2008 Jun;28(25):6407–6418. doi: 10.1523/JNEUROSCI.1425-08.2008. [DOI] [PMC free article] [PubMed] [Google Scholar]
- Reinhardt W, MacLeod NK, Ladewig J, Ellendorff F. An electrophysiological study of the accessory olfactory bulb in the rabbit–ii. input-output relations as assessed from analysis of intra- and extracellular unit recordings. Neuroscience. 1983 Sep;10(1):131–139. doi: 10.1016/0306-4522(83)90087-8. [DOI] [PubMed] [Google Scholar]
- Richards CD. Actions of general anaesthetics on synaptic transmission in the cns. Br J Anaesth. 1983 Mar;55(3):201–207. doi: 10.1093/bja/55.3.201. [DOI] [PubMed] [Google Scholar]
- Ritter AM, Woodbury CJ, Albers K, Davis BM, Koerber HR. Maturation of cutaneous sensory neurons from normal and ngf-overexpressing mice. J Neurophysiol. 2000 Mar;83(3):1722–1732. doi: 10.1152/jn.2000.83.3.1722. [DOI] [PubMed] [Google Scholar]
- Rosenberg AF, Ariel M. Visual-response properties of neurons in turtle basal optic nucleus in vitro. J Neurophysiol. 1990 May;63(5):1033–1045. doi: 10.1152/jn.1990.63.5.1033. [DOI] [PubMed] [Google Scholar]
- Schmued LC, Stowers CC, Scallet AC, Xu L. Fluoro-jade c results in ultra high resolution and contrast labeling of degenerating neurons. Brain Res. 2005 Feb;1035(1):24–31. doi: 10.1016/j.brainres.2004.11.054. [DOI] [PubMed] [Google Scholar]
- Stowers L, Holy TE, Meister M, Dulac C, Koentges G. Loss of sex discrimination and male-male aggression in mice deficient for trp2. Science. 2002 Feb;295(5559):1493–1500. doi: 10.1126/science.1069259. [DOI] [PubMed] [Google Scholar]
- Tomizawa K, Kunieda J, Nakayasu H. Ex vivo culture of isolated zebrafish whole brain. J Neurosci Methods. 2001 May;107(12):31–38. doi: 10.1016/s0165-0270(01)00349-1. [DOI] [PubMed] [Google Scholar]
- Werblin FS. Control of retinal sensitivity. ii. lateral interactions at the outer plexi form layer. J Gen Physiol. 1974 Sep;63(1):62–87. doi: 10.1085/jgp.63.1.62. [DOI] [PMC free article] [PubMed] [Google Scholar]
- Woodbury CJ, Ritter AM, Koerber HR. Central anatomy of individual rapidly adapting low-threshold mechanoreceptors innervating the “hairy” skin of newborn mice: early maturation of hair follicle afferents. J Comp Neurol. 2001 Jul;436(3):304–323. [PubMed] [Google Scholar]
- Zhang JJ, Huang GZ, Halpern M. Firing properties of accessory olfactory bulb mitral/tufted cells in response to urine delivered to the vomeronasal organ of gray short-tailed opossums. Chem Senses. 2007 May;32(4):355–360. doi: 10.1093/chemse/bjm005. [DOI] [PubMed] [Google Scholar]