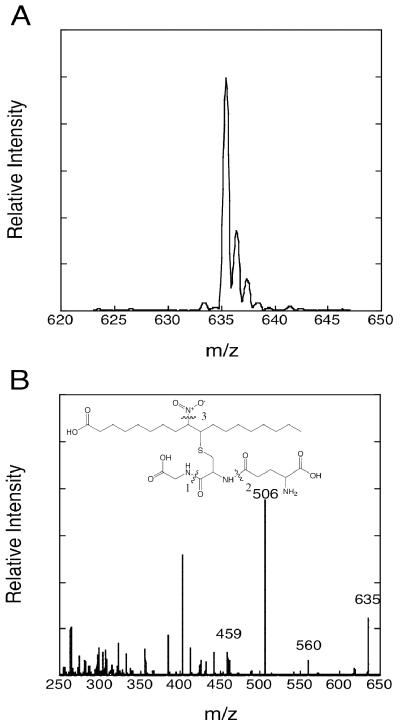
Figure 2. Mass spectrometry analysis of the glutathione conjugate of NO2-OA, NO2-OA-SG.
Shown are spectra of the parent ion M+H at m/z = 635 (panel A) and daughter ions generated by collision-induced dissociation (panel B). Evident in panel B are peaks corresponding to the parent ion and the daughter ions: m/z 506 [M-glutamate], m/z 560 [M-glycine], and m/z 459 [M-glutamate-NO2].

