

Abstract
OBJECTIVE
We sought to identify genes with differential expression in cerebral cavernous malformations (CCMs), arteriovenous malformations (AVMs), and control superficial temporal arteries (STAs) and to confirm differential expression of genes previously implicated in the pathobiology of these lesions.
METHODS
Total ribonucleic acid was isolated from four CCM, four AVM, and three STA surgical specimens and used to quantify lesion-specific messenger ribonucleic acid expression levels on human gene arrays. Data were analyzed with the use of two separate methodologies: gene discovery and confirmation analysis.
RESULTS
The gene discovery method identified 42 genes that were significantly up-regulated and 36 genes that were significantly down-regulated in CCMs as compared with AVMs and STAs (P = 0.006). Similarly, 48 genes were significantly up-regulated and 59 genes were significantly down-regulated in AVMs as compared with CCMs and STAs (P = 0.006). The confirmation analysis showed significant differential expression (P < 0.05) in 11 of 15 genes (angiogenesis factors, receptors, and structural proteins) that previously had been reported to be expressed differentially in CCMs and AVMs in immunohistochemical analysis.
CONCLUSION
We identify numerous genes that are differentially expressed in CCMs and AVMs and correlate expression with the immunohistochemistry of genes implicated in cerebrovascular malformations. In future efforts, we will aim to confirm candidate genes specifically related to the pathobiology of cerebrovascular malformations and determine their biological systems and mechanistic relevance.
Keywords: Arteriovenous malformations, Cavernous malformations, Gene arrays, Gene expression
Cerebrovascular malformations (CVMs) are lesions with an abnormal vessel phenotype that predisposes patients to hemorrhagic strokes, seizures, focal neurological deficits, and other clinical manifestations (4, 22). They include arteriovenous malformations (AVMs) and cerebral cavernous malformations (CCMs) and have distinct clinicopathological radiological profiles (14, 30). The AVMs are tangled complexes of tortuous vessels representing fistulous connections between arteries and veins, and they lack an intervening capillary bed. They reveal preserved features of mature vessel wall phenotype altered by high flow and hemodynamic stress, including arterial, nidal, and venous aneurysms (5, 6, 28). The CCMs are characterized by caverns filled with blood or thrombus and are lined with a single layer of endothelial cells. These low-flow lesions are associated with brittle vasculature and repetitive oozing (5, 6). The CCMs lack inter-endothelial cell tight junctions and mature vessel wall angio-architecture (8, 37).
Little is known about the mechanisms of genesis or the progression of these lesions. Several proteins are abnormally expressed in AVMs and CCMs. Our group and others have demonstrated by performing immunohistochemical analysis that vascular endothelial growth factor (VEGF) and the VEGF receptors VEGF-r1 (flt1) and VEGF-r2 (flk1) are overexpressed in both AVMs and CCMs compared with normal brain vessels (21, 35). Fibronectin is expressed to a greater extent in CCMs than in AVMs, consistent with the proliferative immature vessel phenotype (21). Laminin and smoothelin, both of which reflect mature vessel wall phenotype, are underexpressed in CCMs as compared with AVMs (21, 34). Distinct genes have been identified that predispose individuals to familial manifestations of these lesions, which is related to transforming growth factor-β receptor binding proteins (1, 13, 18, 19) and the Krev Interaction Trapped 1 (krit1) signaling pathway (9, 17, 23, 26, 32) for AVMs and CCMs, respectively.
We hypothesize that different groups of genes are involved in the pathogenesis of AVMs and CCMs and that other genes are nonspecifically associated with both lesion types. In the experiments described in this article, we applied gene microarray analysis to correlate alterations in ribonucleic acid (RNA) transcription in AVMs and CCMs to the previously published abnormal protein expression in these lesions. In addition, we found numerous other genes differentially expressed in one or both lesion types, which has not been reported previously.
PATIENTS AND METHODS
Patients and Lesions
A total of 11 specimens, including 8 CVMs (4 AVMs and 4 CCMs) and 3 normal vessels (superficial temporal arteries [STAs]), were obtained from 10 patients between November 2000 and December 2001. We obtained Institutional Review Board approval to perform our experiments. Each of the patients had unambiguous clinicopathological radiological characteristics of AVM or CCM without features of mixed lesions (14, 30). The relevant clinical and lesion features of the cases are summarized in Table 1.
TABLE 1.
Summary of patients and lesionsa
| Patient no. | Age (yr)/sex | Diagnosis | Indications for excision | Lesion size (cm) | Lesion location | Fragment weight (g) | Isolated RNA (μg) |
|---|---|---|---|---|---|---|---|
| 1 | 41/M | AVM | Headache | 2.5 | L temporal | 0.2 | 5 |
| 2 | 18/F | AVM | Hemorrhage | 0.6 | L frontal | 0.04 | 1.4 |
| 3 | 28/M | AVM | Hemorrhage | 4 | L corpus callosum | 1 | 28 |
| 4 | 50/F | AVM | Neurological deficit | 4 | R temporal | 5 | 246 |
| 5 | 26/F | CCM | Seizure disorder | 2.5 | L frontal | 0.8 | 30 |
| 6 | 33/F | CCM | Hemorrhage | 2.5 | L temporal | 0.2 | 50 |
| 7 | 26/M | CCM | Seizure disorder | 1.5 | R temporal | 0.3 | 29 |
| Control | 1 | STA | 0.3 | 5 | |||
| 8 | 9/F | CCM | Seizure disorder | 4 | R temporal | 2 | 610 |
| 9 | 68/F | Aneurysm | Control | 1 | STA | 0.3 | 8.3 |
| 10 | 56/F | Meningioma | Control | 1 | STA | 0.3 | 4.3 |
RNA, ribonucleic acid; AVM, arteriovenous malformation; L, left; R, right; CCM, cerebral cavernous malformation; STA, superficial temporal artery.
Preparation of RNA
At the time of surgical excision, a small fragment of the CCM, AVM, or STA specimen (0.04–5 g) was snap-frozen in liquid nitrogen. The RNA was isolated from these specimens with the use of a modification of the method of Chomczynski and Sacchi (7). Briefly, TRI Reagent (Molecular Research Center, Inc., Cincinnati, OH) was added at a volume of 1 ml/100 mg lesion, which immediately froze when it contacted the snap-frozen lesion specimen. Immediately after thawing, the lesion was homogenized three times for 20 seconds on ice with the use of a Polytron PT 1200 homogenizer (Kinematica AG, Littau, Switzerland), with 10-second rest intervals between pulses. The homogenate was incubated for 10 minutes at 58°C and was homogenized a second time as described above. After the addition of 0.1 vol 1-bromo-3-chloropropane, the homogenate was vortexed for 15 seconds and incubated on ice for 1 hour. After centrifugation at 6000 × g for 30 minutes, the upper aqueous phase was transferred to a new tube. One-half volume of isopropanol was added. After mixing, the solution was incubated on ice for 1 hour. After centrifugation at 12,000 × g for 30 minutes, the supernatant was removed. The RNA pellet was washed with 80% ethanol and resuspended in diethylpyrocarbonate-treated water. The RNA was affinity column-purified with the use of an RNeasy Mini Kit (Qiagen, Inc., Valencia, CA) according to the manufacturer’s protocol. The amount of RNA isolated is indicated in Table 1. First-strand complementary deoxyribonucleic acid (cDNA) was synthesized from the poly-A containing messenger RNA (mRNA) as indicated below.
Synthesis of Double-stranded cDNA
First-strand cDNA was synthesized from 1.4 to 5 μg total RNA with Superscript Choice System (Life Technologies, Inc., Gaithersburg, MD), using an oligo-deoxyribothymidine primer containing a T7 RNA polymerase promoter (Genset Corp., Kents Store, VA). After second-strand synthesis, double-stranded cDNA was purified with phenol/chloroform extraction and ethanol precipitation.
Synthesis of Biotin-labeled complementary RNA and Hybridization
Biotin-labeled complementary RNA (cRNA) was synthesized by performing in vitro transcription with the use of the Bioarray High Yield RNA Transcript Labeling Kit (ENZO, Farmingdale, NY). The cRNA was purified by using an RNeasy Mini Kit (Qiagen, Inc.) and fragmented to between 50 and 200 bases in length by incubation at 94°C for 35 minutes in a fragmentation buffer containing 40 mmol/L Tris-acetate, pH 8.1, 100 mmol/L potassium acetate, and 30 mmol/L magnesium acetate. The cRNA was added at a concentration of 0.05 μg/μl to a hybridization solution containing 100 mmol/L morpholinoethanesulfonic acid, 1 mol/L sodium cation, 20 mmol/L ethylenediamine tetra-acetic acid, and 0.01% Tween 20.
Hybridization, Washing, and Staining of the Test Chip and the GeneChip
The sample of 200 μl was hybridized to the Affymetrix GeneChip test chip arrays (Affymetrix, Inc., Santa Clara, CA) by incubation at 45°C for 16 hours with the use of a GeneChip Hybridization Oven 640 (Affymetrix, Inc.). The arrays were washed, and then they were stained with streptavidin-phycoerythrin with the use of a GeneChip Fluidics Station Number 400 (Affymetrix, Inc.). Arrays were read at a resolution of 3 μm with an HP Gene Array Scanner (Affymetrix, Inc.). The sample was considered to have passed the test chip if the ratios of the relative expression of the 3′ end over the 5′ end were less than 3 for both the β-actin and the glyceraldehyde phosphate dehydrogenase genes that were present on the test chip. If the test chip passed, the sample was hybridized to the Affymetrix GeneChip Hu95a arrays containing 12,625 genes as described above for the test chip. Scanned chips produced an image data (*.dat) file.
Data Preprocessing
Detailed protocols for data analysis of Affymetrix microarrays were described previously (15, 16, 24). Expression of transcripts from each of 12,625 genes was assessed in each of the specimens and analyzed with the use of Microarray Suite version 5 software (Affymetrix, Inc.) (Fig. 1). The data from the 16 to 22 perfectly matched probes for each gene contained in the *.dat file were averaged to derive the data for the cell intensity (*.cel) file. A scaling factor was applied to the normalized data from the *.cel files to bring the average intensity for all probes on the array to 500, forming the analysis output (*.chp) file with the use of Microarray Suite version 5 software. This procedure allowed any sample to be normalized for comparison with other samples.
FIGURE 1.

Flow chart illustrating the data analysis of differential gene expression on Affymetrix gene chips. The data were averaged to obtain a mean intensity value of expression for each gene. This mean value was multiplied by a scaling factor to equalize the average intensity across all chips. Files containing scaled data were entered into Matlab version 6.00 release 12 software for gene discovery to identify differentially expressed genes. Files containing scaled data were also entered into GeneSpring software for confirmation analysis. Select genes were chosen and entered into GraphPad InStat version 2.04a program for statistical analysis.
Data Analysis for Unbiased Gene Discovery
The data contained in the *.chp file were loaded into the Matlab version 6.00 release 12 software (The MathWorks, Natick, MA) for statistical analysis. The Affymetrix control probes and the genes, which were called Absent by Microarray Suite across all samples, were removed. A median filter was applied to the remaining genes to remove genes that did not vary statistically across the samples. This filter computed a statistic W for each gene, where W = (n − 1) × (variance) ÷ median (variance), n is the number of samples, and median (variance) is the median value of all the variances calculated for each gene.
Assuming that most genes do not vary significantly across all samples, the genes in general demonstrate low variance across samples. Therefore, the W statistic uses the variance to determine the genes that vary significantly. A greater W value means greater variation. Assuming that the variances are random and that the noise is distributed normally, the W statistic is approximately χ2 with n − 1 df. Hence, a P value for each gene can be determined, capturing the probability that null hypothesis of no significant variation is rejected. A multiple comparison correction was conducted on the basis of the false discovery rate (FDR), which controls the expected fraction of the null hypotheses rejected mistakenly (10), where FDR = (number of mistaken H0 rejections) ÷ (total number of H0 rejections). An FDR of 10% was used with the P values for the χ2 statistic W.
We separately assessed the groups of genes in which the intensities of gene transcription from the CCM or AVM samples were higher or lower than the intensities of the other lesion type or the STA samples and that were determined to be significant according to the Kruskal-Wallis rank-sum test. The groups were combined to yield the statistically significant genes for each combination. We catalogued these genes according to potential function whenever possible with the use of GeneSpring version 4.1 software (Silicon Genetics, Redwood City, CA).
Fold change was calculated by using the formula [(I − R) ÷ min(I,R)] + A, where I is the median of all values for gene expression in the specimens of interest, R is the median of all values for gene expression in the remaining specimens with which the specimens of interest were compared, min(I,R) is the minimum of I and R, and A = 1 if I is greater than or equal to R or A = −1 if I is less than R.
Heritable forms of CCM mapped to 7p13-15 and 3q25.2-27 result from genes that are yet to be identified. The GeneSpring software program was used to identify genes on the Affymetrix chip that mapped to these physical locations on the human chromosomes. These mapped genes were examined to determine whether they were differentially expressed between groups of specimens.
Data Analysis for the Confirmation of Differential Expression of Known Genes
The *.chp file, which contained the scaled data, was converted to an Excel file. GeneSpring version 4.1 software (Silicon Genetics, Redwood City, CA) was used to find the genes of interest. We initially considered the transcription levels of genes known to affect vasculogenesis, angiogenesis, or vascular wall maturity; genes related to familial AVM and CCM disease; and genes related to proteins previously shown by our group and others to be expressed abnormally in these lesions.
The GraphPad InStat version 2.04a software program (GraphPad Software, San Diego, CA) was used on a DOS platform. Initially, the F distribution was used to determine whether the difference between the two standard deviations from the relative expression of a gene from a group of similar lesions was significant. If this difference was not significant, the unpaired t test was used. If the difference was significant (P < 0.05), either the nonparametric Mann-Whitney U test or the Welch approximate t test was used. One-tailed probabilities were used if there was an expectation regarding the direction of the differences of the means from previous investigations. Otherwise, the two-tailed probabilities were used. P < 0.05 was considered significant. The results of this Instat analysis were compared with the statistical analysis for these genes with the use of the unbiased gene discovery approach.
RESULTS
Total RNA obtained from four AVMs, four CCMs, and three STAs were studied. An additional CCM specimen failed to yield high-quality RNA. Data were analyzed with the use of the gene discovery approach and the confirmation of known gene methodologies (Fig. 1).
Gene Discovery in Cerebrovascular Malformations
After control and absent genes were removed from the scaled data, a median filter was applied to discard genes that did not vary significantly across experiments. After an FDR of 10% was used with the P values for the χ2 statistic W, 3178 genes were selected from the original 12,625 genes. Nonparametric Kruskal-Wallis rank-sum comparisons were performed for AVMs versus CCMs, AVMs versus STAs, and CCMs versus STAs. For the AVM versus CCM comparison, 223 genes met the rank-sum criteria for significance at 0.48 FDR with P = 0.0286 for each gene. For the AVM versus STA comparison, 1280 genes met the rank-sum criteria for significance at 0.17 FDR with P = 0.0571. For the CCM versus STA comparison, 1533 genes met the rank-sum criteria for significance at 0.14 FDR with P = 0.0571. The intersections of the AVM versus CCM and CCM versus STA comparisons resulted in genes that were differentially expressed in the CCMs compared with the other two groups (P = 0.006). The intersections of the AVM versus CCM and the AVM versus STA comparisons resulted in genes that were differentially expressed in the AVMs compared with the other two groups (P = 0.006).
Table 2 shows the 42 genes up-regulated in CCMs compared with AVMs and STAs. These include genes for 2 binding proteins, 7 enzymes, 13 immunoglobulins, 3 membrane proteins, 11 unclassified known (miscellaneous) genes, and 6 genes unknown to date. Fold change reflects the median relative gene expression in CCMs compared with median AVM and STA levels.
TABLE 2.
Up-regulated genes in cerebral cavernous malformations compared with arteriovenous malformations and healthy superficial temporal arteriesa
| Classification | Accession no. | Fold change | Description |
|---|---|---|---|
| Binding protein | L13210 | 2.7 | Mac-2 binding protein |
| AA158243 | 1.6 | FK506-binding protein 2 cis-transpropyl isomerase | |
| Enzyme | U43944 | 3.2 | Breast cancer cytosolic NADP+-dependent malic enzyme |
| D17793 | 2.6 | Aldo-keto reductase family 1 member C3 | |
| D86181 | 2.2 | Galactocerebrosidase (Krabbe disease) | |
| D63998 | 2.1 | Golgi α-mannosidase II | |
| U09759 | 2.0 | Protein kinase (MAPK9) | |
| L13977 | 1.8 | Prolylcarboxypeptidase | |
| Y10387 | 1.6 | PAPS synthetase | |
| Immunoglobulin | AF067420 | 25.8 | SNC73 protein |
| AI660656 | 23.3 | Like immunoglobulin J chain | |
| AI932613 | 21.8 | Immunoglobulin-related 14.1 protein precursor | |
| Y14737 | 20.4 | Immunoglobulin λ heavy chain | |
| S71043 | 17.0 | Immunoglobulin α heavy chain allotype 2 | |
| M18645 | 14.8 | Immunoglobulin rearranged λ-chain VJC region subgroup λ-IV | |
| X57809 | 14.7 | Rearranged immunoglobulin λ light chain | |
| M63438 | 13.9 | Immunoglobulin rearranged λ chain mRNA, VJC region | |
| X72475 | 11.9 | Rearranged immunoglobulin κ light chain variable region | |
| AI147237 | 8.8 | Immunoglobulin heavy constant γ 3 | |
| U80114 | 6.1 | Immunoglobulin heavy chain variable region (V4-31) | |
| AF058075 | 3.3 | Immunoglobulin λ light chain VJ region | |
| X05323 | 1.6 | MRC OX-2 membrane glycoprotein | |
| Membrane protein | M16276 | 42.7 | DQw1-βMHC Class II HLA-DR2-Dw12 |
| AB023204 | 3.3 | Erythrocyte membrane protein band 4.1-like 3 | |
| J04182 | 1.4 | Lysosomal membrane glycoprotein-1 (LAMP1) | |
| Miscellaneous | AF073308 | 3.7 | Nonsyndromic hearing impairment protein 5 (DFNA5) |
| Z11793 | 3.7 | Selenoprotein P | |
| U03877 | 3.0 | Extracellular matrix S1-5 epidermal growth factor-containing fibulin | |
| AF055376 | 2.8 | V-maf musculoaponeurotic fibrosarcoma oncogene homolog (avian) | |
| M63835 | 2.4 | Immunoglobulin G Fc receptor I gene | |
| U68494 | 2.2 | Hbc647 from pancreatic islet | |
| D87075 | 2.0 | Solute carrier family 23 (nucleobase transporters), member 1 | |
| AB023176 | 1.9 | Ral GTP dissociation stimulator-like protein (signaling) | |
| L13939 | 1.8 | β adaptin (transport) (AP1B1) | |
| X99584 | 1.6 | SMT3A similar to suppressor of MIF 2 | |
| D26599 | 1.5 | Proteasome subunit (PSMB2) | |
| Unknown | AB018259 | 3.0 | KIAA0716 large protein from brain |
| H24861 | 2.1 | 3NbHBst gene from Soares breast | |
| AL050084 | 1.8 | Hypothetical protein DKFZp566O1646 | |
| AF035313 | 1.6 | Hypothetical protein 23851 | |
| AF055029 | 1.6 | Hypothetical gene 24711 | |
| AL050197 | 1.5 | Hypothetical protein DKFZp586D0623 |
NADP+, oxidized nicotinamide adenine dinucleotide phosphate; PAPS, adenosine 3′-phosphate 5′-phosphosulfate; VJC, variable joining constant; VJ, variable joining; mRNA, messenger ribonucleic acid; MHC, major histocompatibility complex; MIF, mitotic fidelity of chromosome transmission protein.
Table 3 shows the 36 genes down-regulated in CCMs compared with AVMs and STAs. This group includes many genes expressed in the smooth muscle cells of arteries, such as those that code for 6 myosin and 9 other cellular component proteins, including smoothelin, actin, and desmin. In addition, this group contains genes for two apoptosis-related proteins, five enzymes, two heat shock proteins, nine unclassified proteins, and three genes unknown to date. Fold change reflects the median relative combined gene expression in AVMs and STAs compared with median CCM levels. Figure 2 shows the scan of the microarray cells containing the 16 perfectly matched oligonucleotide probes for the smooth muscle myosin heavy chain (D10667) hybridized to biotin-labeled cRNA from representative vascular specimens.
TABLE 3.
Down-regulated genes in cerebral cavernous malformations compared with arteriovenous malformations and healthy superficial temporal arteries
| Classification | Accession no. | Fold change | Description |
|---|---|---|---|
| Apoptosis | U83981 | 2.5 | Protein phosphatase 1, regulatory (inhibitor) subunit 15A |
| Z35491 | 1.4 | BCL2 associated athanogene-1 glucocorticoid receptor-associated protein | |
| Cellular components | D17408 | 22.8 | Calponin 1, basic smooth muscle |
| M63391 | 15.2 | Desmin | |
| J00068 | 8.7 | Adult skeletal muscle α-actin | |
| L38486 | 4.6 | Microfibril-associated glycoprotein 4 | |
| M77016 | 4.6 | Tropomodulin tropomyosin binding protein | |
| AI888563 | 3.6 | Smoothelin | |
| M95787 | 2.9 | Transgelin 22-kDa smooth muscle protein | |
| AL050396 | 2.3 | Filamin A endothelial actin binding protein | |
| X13839 | 2.2 | Vascular smooth muscle α-actin | |
| Enzyme | J03779 | 1.9 | Membrane metalloendopeptidase (MME) |
| U43195 | 1.8 | ρ-associated, coiled-coil containing protein kinase (ROCK1) | |
| AL049415 | 1.5 | Disintegrin and metalloproteinase 19 (meltrin β) | |
| AF038203 | 1.4 | LIS1-interacting protein NUDEL, endooligopeptidase A | |
| AF045458 | 1.4 | Serine/threonine kinase (ULK1) | |
| Heat shock protein | Z23090 | 2.0 | Heat shock 27-kDa protein 1 |
| M16660 | 1.3 | Heat shock 90-kDa protein 1, β | |
| Myosin | D10667 | 87.0 | Smooth muscle myosin heavy chain |
| AF013570 | 20.4 | Smooth muscle myosin heavy chain SM2 | |
| AF001548 | 17.8 | Myosin heavy chain (MHY11) | |
| M12125 | 6.7 | Fibroblast muscle-type tropomyosin | |
| J02854 | 5.6 | Myosin light chain (MYL9) | |
| M22919 | 2.2 | Nonmuscle/smooth muscle alkali myosin light chain | |
| Miscellaneous | U49957 | 3.3 | LIM protein (LPP) |
| M96789 | 3.1 | Connexin 37 gap junction protein (GJA4) | |
| U66579 | 2.7 | G protein-coupled receptor-20 | |
| M35999 | 2.5 | Integrin β chain platelet glycoprotein IIIa | |
| X67055 | 2.5 | Inter-α-trypsin inhibitor heavy chain H3 | |
| AF035119 | 1.8 | Deleted in liver cancer-1 (DLC1) | |
| AF032886 | 1.8 | Forkhead protein (FOXO3A) | |
| M88279 | 1.3 | Immunophilin (FKBP4) binding protein | |
| U25789 | 1.3 | Ribosomal protein L21 | |
| Unknown | AB011099 | 9.5 | KIAA0527 large protein from brain |
| AB023139 | 4.4 | KIAA0922 large protein from brain | |
| AB028999 | 1.5 | KIAA1076 large protein from brain |
FIGURE 2.

Original scans of the microarray cells containing the 16 perfectly matched oligonucleotide probes for the smooth muscle myosin heavy chain (D10667) hybridized to biotin-labeled cRNA from a representative AVM (top), a representative CCM (center), and a representative STA (bottom). There was a median 87.0-fold decrease when the intensity for all CCMs was compared with the intensities for all AVMs and STAs.
Table 4 indicates the 48 genes up-regulated in AVMs when compared with CCMs and STAs. These include genes coding for 8 enzymes, 5 nuclear proteins, 11 receptors, 4 ubiquitin-related proteins, 16 unclassified genes, and 4 genes unknown to date. Fold change reflects the median relative gene expression in AVMs compared with median CCM and STA levels.
TABLE 4.
Up-regulated genes in arteriovenous malformations compared with cerebral cavernous malformations and healthy superficial temporal arteriesa
| Classification | Accession no. | Fold change | Description |
|---|---|---|---|
| Enzyme | AF016833 | 8.0 | Maltase-glucoamylase (α glucosidase) |
| D10495 | 2.8 | Protein kinase C δ-type | |
| N36295 | 2.0 | Dolichyl-phosphate mannosyltransferase | |
| U50648 | 1.9 | Double-stranded RNA-dependent protein kinase | |
| U89896 | 1.7 | Casein kinase I γ 2 | |
| HG1614-HT1614 | 1.5 | Protein phosphatase 1, α catalytic subunit | |
| M91029 | 1.5 | AMP deaminase | |
| AJ012590 | 1.4 | Glucose 1-dehydrogenase | |
| Nuclear | S77763 | 6.3 | Nuclear factor erythroid-derived 2 |
| L17131 | 2.0 | High-mobility group protein (HMGIY) | |
| Z80780 | 2.0 | Histone gene (H2BFH) | |
| AI688098 | 1.8 | H2B histone family, member 2 | |
| M58603 | 1.7 | Nuclear factor κB DNA binding subunit | |
| Receptor | U11872 | 17.0 | Interleukin-8 receptor type B (IL8RB) |
| D12763 | 10.4 | ST2 interleukin 1 receptor-like 1 protein | |
| L19593 | 7.5 | Interleukin 8 receptor β | |
| U43672 | 6.1 | Interleukin 18 receptor 1 | |
| AC004262 | 4.8 | EMR2 epidermal growth factor-like | |
| M59818 | 4.5 | Granulocyte colony-stimulating factor receptor | |
| U11870 | 4.1 | Interleukin-8 receptor type A | |
| AF014794 | 3.3 | TNF-related receptor (TNFRSF10C) | |
| AJ000479 | 2.8 | Endothelial G-protein coupled receptor 6 | |
| M59820 | 2.2 | Granulocyte colony-stimulating factor receptor | |
| M84562 | 2.2 | Formyl peptide receptor-like receptor (FPRL1) | |
| Ubiquitin | U49869 | 1.5 | Ubiquitin B |
| X04803 | 1.5 | Ubiquitin B | |
| AB009010 | 1.4 | Ubiquitin C | |
| AL050254 | 1.3 | F-box only protein 7 of SCF-ubiquitin-ligase | |
| Miscellaneous | D85429 | 4.6 | Heat shock protein 40 (DNAAJB1) |
| U49187 | 4.5 | PL48 cytotrophoblast differentiation | |
| V00505 | 2.7 | δ-globin | |
| X03656 | 2.3 | Granulocyte colony-stimulating factor | |
| HG2259-HT2348 | 2.0 | Tubulin, α 1, isoform 44 | |
| AI985964 | 1.8 | Intestinal trefoil factor-like | |
| L40393 | 1.8 | S171 NUMB homolog, Alzheimer’s disease locus | |
| U12707 | 1.8 | Wiskott-Aldrich syndrome protein | |
| L22005 | 1.7 | Cell division cycle 34 | |
| M92287 | 1.6 | Cyclin D3 | |
| S62138 | 1.6 | DNA-damage-inducible transcript 3 (DDIT3) | |
| M33509 | 1.5 | HLA-B-associated transcript 2 | |
| AF053356 | 1.4 | Insulin receptor substrate 3-like protein | |
| S78771 | 1.4 | Bromodomain-containing protein 2 | |
| Z19574 | 1.4 | Cytokeratin 17 intermediate filament protein | |
| AF089750 | 1.2 | Fotillin-1 caveolae-associated membrane protein | |
| Unknown | AB002384 | 5.4 | KIAA0386 large protein from brain |
| X90579 | 3.0 | DNA for cyp-related pseudogene | |
| AB002344 | 2.4 | KIAA0346 large protein from brain | |
| R48209 | 1.9 | Protein KIAA1539 from Soares breast |
RNA, ribonucleic acid; AMP, adenosine monophosphate; DNA, deoxyribonucleic acid; TNF, tumor necrosis factor.
Table 5 shows the 59 genes down-regulated in AVMs compared with CCMs and STAs. These include genes for 2 apoptosis-related proteins, 5 binding proteins, 4 cell adhesion proteins, 8 enzymes, 4 oncology-related proteins, 2 receptor ligands, 3 transcriptional regulators, 2 translation initiation factors, 2 transporters, 14 unclassified genes, and 13 genes unknown to date. Fold change reflects median relative combined gene expression in CCMs and STAs compared with median AVM levels. In addition, 558 genes (not shown) were up-regulated in STAs compared with AVMs and CCMs (P = 0.012), and 310 genes were down-regulated in STAs compared with AVMs and CCMs (P = 0.012). The functional classification of these genes is beyond the scope of this article.
TABLE 5.
Down-regulated genes in arteriovenous malformations compared with cerebral cavernous malformations and healthy superficial temporal arteriesa
| Classification | Accession no. | Fold change | Description |
|---|---|---|---|
| Apoptosis | AF035606 | 1.7 | Calcium-binding programmed cell death protein 6 |
| AB020680 | 1.6 | BCL2-associated athanogen 5 protein | |
| Binding protein | AL080119 | 1.7 | Plasminogen activator inhibitor-1 mRNA binding protein (PAI-RBP1) |
| U41654 | 1.7 | Ras-related GTP-binding protein (RAGA) | |
| X81789 | 1.7 | RNA-binding splicing factor (SF3A60) | |
| X63753 | 1.6 | SON DNA binding protein | |
| AJ132258 | 1.4 | Staufen double-stranded RNA binding protein | |
| Cell adhesion | X53586 | 1.9 | Integrin α 6 |
| L23805 | 1.8 | α 1(E)-catenin | |
| D14705 | 1.5 | α-catenin cahedrin-associated tight cell-cell adhesion protein | |
| M35011 | 1.5 | Integrin β-5 subunit | |
| Enzyme | X96752 | 3.0 | L-3-hydroxyacyl-CoA dehydrogenase |
| M37721 | 2.6 | Peptidylglycine α-amidating monooxygenase | |
| X58288 | 2.4 | Protein tyrosine phosphatase | |
| M12267 | 2.1 | Ornithine aminotransferase | |
| AB018262 | 1.8 | Translocase of outer mitochondrial membrane 70 | |
| M31899 | 1.8 | DNA repair helicase (ERCC3) | |
| D37931 | 1.5 | RNase 4 | |
| AA203303 | 1.3 | NADH dehydrogenase (ubiquinone) Fe-S protein 4 | |
| Oncology related | AB002450 | 2.3 | CGI-109 protein, deleted in advanced lung cancer |
| L13689 | 2.1 | Proto-oncogene (BMI1) | |
| Z50022 | 1.5 | Pituitary tumor-transforming 1 interacting surface glycoprotein | |
| U41635 | 1.2 | Amplified in sarcomas (OS-9) | |
| Receptor ligand | X57025 | 7.2 | Insulin-like growth factor I |
| L36033 | 4.2 | Pre-B cell stimulating factor homolog (SDF1b) chemokine | |
| Transcriptional regulation | U14193 | 2.0 | Transcriptional factor TFIIA γ subunit |
| M81601 | 1.7 | Transcription elongation factor (SII) | |
| U71267 | 1.7 | Potential transcriptional repressor (CNOT4) | |
| Translation initiation factor | D30655 | 1.4 | Eukaryotic initiation factor 4AII |
| AF035280 | 1.3 | Translation initiation factor 2B | |
| Transporter | U81375 | 2.1 | Equilibrative nucleoside transporter 1 |
| U77942 | 1.6 | Syntaxin 7 vesicle trafficking to lysosomes | |
| Miscellaneous | AB007865 | 2.8 | Fibronectin leucine-rich transmembrane protein 2 |
| AI087268 | 2.4 | Small nuclear ribonucleoprotein polypeptide C | |
| L08044 | 2.4 | Intestinal trefoil secretory protein | |
| U17077 | 2.3 | BENE proteolipid protein | |
| U41816 | 2.1 | C-1 prefolen 4 chaperone | |
| D16217 | 2.0 | Calpastatin | |
| AL031177 | 1.9 | 26S proteasome subunit p28 and collagen α 6 | |
| D11428 | 1.8 | Peripheral myelin glycoprotein (PMP22) | |
| J04543 | 1.8 | Synexin voltage-dependent calcium channel | |
| U18291 | 1.8 | Cell division cycle 16 (CDC16) | |
| X68194 | 1.8 | Synaptophysin-like protein (SYPL) | |
| AB028964 | 1.6 | Putative forkhead domain | |
| AB002332 | 1.6 | Clock homolog circadian rhythm gene | |
| U90913 | 1.6 | Tax interaction protein-1 | |
| Unknown | AL080234 | 3.0 | FBD3 cri-du-chat critical region |
| AI760932 | 2.5 | CGI-60 protein | |
| AA115140 | 2.0 | KIAA1354 large protein from brain | |
| AL080063 | 1.9 | DKFZp564I052 protein | |
| N53547 | 1.9 | Hypothetical protein MGC5508 | |
| AF035313 | 1.7 | Hypothetical protein 23851 | |
| D63477 | 1.7 | KIAA0143 gene | |
| AL049944 | 1.6 | DKFZp564G2022 protein | |
| AL049957 | 1.6 | DKFZp564J0323 protein | |
| AB011164 | 1.5 | KIAA0592 large protein from brain | |
| AL035304 | 1.5 | DKFZP564B167 gene | |
| AB028972 | 1.4 | KIAA1049 large protein from brain | |
| AB014597 | 1.3 | KIAA0697 large protein from brain |
mRNA, messenger ribonucleic acid; RNA, ribonucleic acid; DNA, deoxyribonucleic acid; CoA, coenzyme A; NADH, nicotinamide adenine dinucleotide.
CCM is an oligogenic trait with genetic contributions from three loci. Mutations in the CCM1 gene cause CCMs. The other two genes map to the 7p13-15 region (CCM2) and the 3q25.2-27 region (CCM3) (9). The CCM2 and CCM3 genes have not been identified. In our experiment, 2 of 38 genes on the gene array that mapped to the 7p13-15 region were differentially expressed. Gene expression for DFNA5 (AF073308), which maps to the 7p15 region within CCM2, is up-regulated in CCMs compared with AVMs and STAs (3.7-fold, P = 0.006; Table 2). Gene expression for TAX1BP1 (U33821), which also maps to 7p15, is down-regulated in AVMs and CCMs compared with STAs (1.4 fold, P = 0.012). One of 32 genes on the gene array that mapped to 3q25.2-27 was differentially expressed. Gene expression of KCNAB1 (L39833 and X83127), which to mapped to the 3q26.1 region within CCM3, is down-regulated in AVMs and CCMs compared with STAs (20.3- and 22.7-fold, P = 0.012).
Confirmation of Differential Expression of Known Genes in Cerebrovascular Malformations
In previous investigations, several proteins were found to play a role in the molecular structure or function of AVMs and CCMs. These include krit1, endoglin (CD105), activin receptor-like kinase (alk1), VEGF, flt1, flk1, receptor tyrosine kinases tie1 and tie2, fibronectin, laminin, smoothelin, and inter-endothelial cell tight junction protein. The relative mRNA expression derived from microarrays for these proteins is shown in Figure 3.
FIGURE 3.
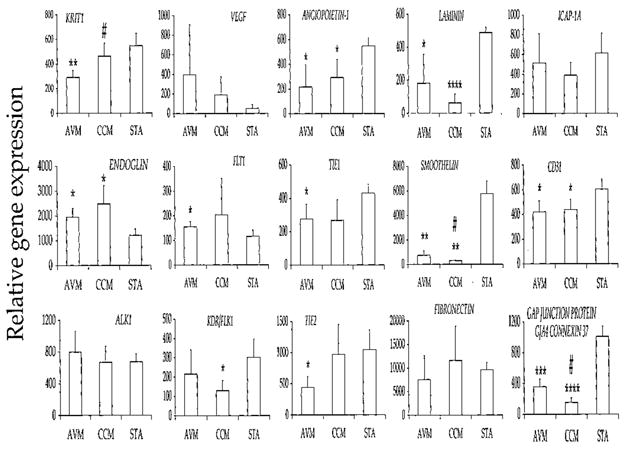
Bar graphs illustrating the differential mRNA expression of 15 relevant proteins identified by immunohistochemistry in AVMs, CCMs, and STAs. Expression is derived by averaging the fluorescence intensity for each gene after scaling chips to an average intensity of 500. *, P < 0.05 versus STA; **, P < 0.01 versus STA; ***, P < 0.001 versus STA; ****, P < 0.0001 versus STA; #, P < 0.05 versus AVM.
The Krit1 CCM1 (accession U90268) gene is expressed less in AVMs than in CCMs (P = 0.028) or in STAs (P = 0.008). There is a trend for CCM1 to be expressed less in CCMs than in STAs (P = 0.17). Expression of the endoglin ENG (X72012) gene is higher in CCMs than in STAs (P = 0.038). There is only a slight trend for the ACVRL1 (Z22533) gene to be expressed more in AVMs than in CCMs (P = 0.48) or in STAs (P = 0.49). There is a trend for the VEGF (M63978) gene to show greater expression in AVMs (P = 0.057) and CCMs (P = 0.057) than in STAs. The flt1 ZYX (X51602) gene is expressed more in AVMs than in STAs (P = 0.038). The kinase insert domain receptor flk1 KDR (AF035121) gene is expressed less in CCMs than in STAs (P = 0.026). Less expression of angiopoietin-1 ANGPT1 (U83508) gene is observed in both AVMs (P = 0.031) and CCMs (P = 0.038) than in STAs. The TIE (X60957) gene is expressed less in AVMs than in STAs (P = 0.045), and there is a trend for less expression of the TIE gene in CCMs than in STAs (P = 0.089). There is less expression of the TEK (L06139) gene in AVMs than in CCMs (P = 0.060) or in STAs (P = 0.020). Although there is less expression of the α3 chain of the laminin LAMA3 (L34155) gene in AVMs (P = 0.021) and CCMs (P < 0.0001) than in STAs, there is only a trend for less expression in CCMs than in AVMs (P = 0.10). The smoothelin SMTN (AI888563) gene is expressed less in CCMs than in AVMs (P = 0.014) or in STAs (P = 0.006), and it is expressed less in AVMs than in STAs (P = 0.008). There is a slight trend for greater expression of the fibronectin FN (HG3044-HT3742) gene in CCMs than in AVMs (P = 0.12).
The NPXY motif of the integrin cytoplasmic domain-associated protein (ICAP)-1α protein interacts with both krit1 and integrin β1 (38). There is a trend for less expression of ICAP-1A (AF0121023) gene in CCMs than in STAs (P = 0.125) and AVMs (P = 0.481). There is less expression of platelet endothelial cell adhesion molecule (CD31) PECAM1 (L34657) gene in AVMs (P = 0.037) and CCMs (P = 0.046) than in STAs. Less expression is observed for the gap junction protein GJA4 connexin 37 (M96789) gene in AVMs (P = 0.0008) and CCMs (P < 0.0001) than in STAs, and less expression is seen in CCMs than in AVMs (P = 0.014).
When the rank-sum unbiased gene discovery approach is applied to 15 select genes of interest, differential expression for 9 genes is found to be significant. When STAs are compared with AVMs, gene expression for CCM1, TIE, TEK, LAMA3, SMTN, PECAM1, GJA4, and ANGPT1 is significantly different. When STAs are compared with CCMs, gene expression for KDR, LAMA3, SMTN, GJA4, and ANGPT1 is significantly different. When AVMs are compared with CCMs, the mRNA expression for SMTN and GJA4 is significantly different.
The expression for the ENG and ZYX genes is significantly different when the confirmation approach is used but not when the gene discovery approach is used, owing to differences in analytical methods (Fig. 1). In the confirmation approach, mRNA expression is significantly down-regulated for CCM1 when AVMs are compared with both CCMs and STAs, and for PECAM1 when both AVMs and CCMs are compared with STAs. The rank-sum gene expression approach shows that mRNA expression of these genes is significantly different only when AVMs are compared with STAs.
DISCUSSION
The pathobiology of CVMs is clearly related to abnormal vascular assembly or maintenance. AVMs exhibit mature vessel wall elements with direct communication between arteries and veins and a high-flow profile predisposing to vascular recruitment, arterialization of venous structures, and gliosis of intervening and adjacent brain tissue. They are prone to apoplectic hemorrhage by rupture of nidal vessels or associated aneurysms or by venous outflow obstruction (5, 6, 28). By contrast, CCMs seem to grow by a process of proliferation of vascular caverns in the setting of repetitive lesional hemorrhages and exhibit brittle vascular morphology devoid of mature vessel wall elements (5, 6, 37). CCMs do not exhibit the high-flow features of AVMs and are less commonly associated with apoplectic hemorrhage (5, 6). Patients with CCMs often present with epilepsy or progressive focal neurological deficits as a result of repetitive lesional bleeding (4, 22).
The molecular milieu of CVMs likely reflects factors that affect lesion genesis and secondary pathophysiological alterations such as associated inflammation, ischemia, hemorrhage, and gliosis. Some of these mechanisms may be similar in all CVMs, but others may be specific to individual lesion types or to particular lesion behavior (e.g., hemorrhage, epilepsy). The molecular structure of CVMs has been explored by performing immunohistochemistry (21, 34, 35), in situ hybridization (33), and other techniques (8, 37). Previous studies conducted in our laboratory and by others have demonstrated the underexpression of proteins characterizing the mature vessel wall phenotype in CCMs as compared with AVMs (21, 34). Angiogenesis factors, including VEGF, are overexpressed in both AVMs and CCMs as compared with control brain vessels, but there is apparent differential expression of VEGF and angiopoietin receptors in the two lesion types (21, 35). These observations have largely been qualitative and have focused on a limited number of candidate molecules. More complex gene interactions are likely involved in the genesis and subsequent biological behavior of the different lesions. Genes that predispose individuals to common familial forms of CCMs and rare familial AVMs were recently identified (1, 9, 13, 15, 17–19, 23, 26, 32). The role of these genes and the related pathways in the pathobiology of CVMs is not known.
The differential expression of scores of genes may be examined simultaneously with the use of gene array techniques to compare mRNA levels in tissue from various sources by performing bioinformatic analysis. These approaches have not been applied previously in the study of CVMs. We sought to compare gene expression in AVMs, CVMs, and STAs for differential gene discovery and to confirm the role of specific genes in the pathobiology of these lesions.
Differential Gene Discovery in AVMs and CCMs
We used a gene discovery approach to identify groups of genes differentially expressed in CVMs. We categorized genes over- or underexpressed in CCMs and AVMs compared with the other lesion types and STAs. We applied a threshold of differential expression in each AVM or CCM specimen as compared with the other lesion type and the control STA specimen as well as a second threshold of statistical significance measured by rank-sum correlation. This allowed the identification of genes significantly over- or underexpressed in a specific lesion type (AVM or CCM) as compared with other CVMs and a control vessel, as well as genes differentially expressed in both types of CVMs compared with STAs.
There were 42 genes with significantly greater expression in each CCM specimen than in every AVM and STA specimen. This group included the overexpression of 13 immunoglobulin genes in CCMs, suggesting the possible role of a CCM-specific antigen that would stimulate the recruitment of B-lymphocytes with the production of antibodies. Of particular note is a 43-fold increase in mRNA from CCMs for an allele of the DQW1-β gene from major histocompatibility complex Class II HLA-DR2-DW12, also reflecting an apparently unique immune response in CCMs. In addition, a fourfold increase in mRNA was noted in CCMs of a gene coding for selenoprotein P, a plasma protein associated with vascular endothelium and a prime target for peroxynitrite toxicity (29).
Likewise, 36 genes were differentially down-regulated in CCMs compared with AVMs and STAs. As expected, genes coding for components of smooth muscle cells were underexpressed in CCMs, including myosin, smoothelin, filamen A endothelial actin binding protein, basic smooth muscle calponin 1, α-actin, desmin, tropomodulin tropomyosin binding protein, and transgelin 22DA smooth muscle protein. Also important with regard to the characteristics of the CCM are the 4.6-fold decrease in mRNA expression of microfibril-associated glycoprotein 4 and the 3.1-fold decrease in endothelium-specific connexin 37 (GJA4) gap junction protein.
The AVMs contained 48 genes that were differentially up-regulated compared with CCMs and STAs. Most notable was the 17-fold increased expression in AVMs of the gene coding for the interleukin-8 receptor type B, splice variant IL8RB1. Also, AVMs showed a 10-fold increased mRNA expression for ST2 interleukin-1 receptor-like 1 protein and an 8-fold increased mRNA expression of maltose-glucoamylase enzyme.
The AVMs contained 59 genes that were differentially down-regulated compared with CCMs and STAs. Most of these genes were down-regulated less than threefold. Two exceptions were the insulin-like growth factor 1 mRNA, which down-regulated by sevenfold, and the pre-B cell stimulating factor homolog (SDF1B) chemokine mRNA, which down-regulated by fourfold.
Heritable forms of CCM are found in 15 to 50% of individuals with CCMs (17) and map to the CCM1, CCM2, and CCM3 loci. Although the CCM1 gene is the CCM1 locus, the genes for CCM2 and CCM3 have not yet been identified. Mapping within the CCM2 locus, the gene DFNA5, which is associated with nonsyndromic hearing impairment and is inversely correlated with estrogen receptor expression in breast carcinoma (36), is up-regulated for mRNA expression in CCMs compared with AVMs and STAs (Table 2). Also mapping within the CCM2 locus, the gene TAX1BP1, which codes for the TAX1-binding protein 1, a tumor necrosis factor receptor-associated factor 6-interacting protein involved in interleukin-1 signaling (25), is down-regulated for mRNA expression in AVMs and CCMs compared with STAs. Mapping to 3q26.1 within the CCM3 locus, the gene KCNAB1, which codes for the β subunit member 1 of voltage-gated shaker-related potassium channel (20), is also down-regulated for mRNA expression in AVMs and CCMs compared with STAs. These results make these candidate genes of particular interest.
Differential Expression of Selected Genes with Potential Pathobiological Significance
Fifteen genes were present on the arrays that were suggested previously to have molecular structural or functional roles in the pathobiology of AVMs and CCMs. Mutations resulting in the truncation of the krit1 protein cause CCM1, one of three familial genotypes of CCM. Although the mRNA expression of CCM1 is significantly down-regulated in AVMs compared with both CCMs and STAs, there is only a trend for less expression in CCMs than in STAs (P = 0.17). Krit1 competes with integrin β1 for the NPXY motif of ICAP-1α (38). There is a trend for less mRNA expression of ICAP-1A in CCMs than in STAs. Of interest is the down-regulation by 1.5-fold of integrin β5 subunit ITGB5, and by 1.9-fold of integrin α6 ITGA6 mRNA expression, in AVMs (Table 5), which suggests a role in both CCMs and AVMs. Integrin binds to the sequence arginine-glycine-aspartate of several adhesive proteins in extracellular matrices, including laminin and fibronec-tin (31).
Previous investigations showed the underexpression of laminin and smoothelin proteins in CCMs as compared with AVMs. Both of these proteins reflect a mature vessel wall phenotype (21, 34). In our study, gene expression for both LAMA3 and SMTN mRNA was down-regulated in both AVMs and CCMs as compared with STAs. There is a trend for lower mRNA expression of LAMA3 in CCMs than in AVMs, at a probability approaching significance (P = 0.01). Also, gene expression for SMTN mRNA is down-regulated in CCMs as compared with AVMs.
Fibronectin proteins are expressed more in CCMs than in AVMs, which is consistent with immature vessel phenotype. In our study, there was a slight trend for more mRNA expression of FN in CCMs than in AVMs, at a probability approaching significance (P = 0.12).
Endoglin and alk1 are proteins involved in familial AVM, hereditary hemorrhagic telangiectasia Types 1 and 2 (HHT1 and HHT2). Gene expression for ENG mRNA is up-regulated in both AVMs and CCMs compared with STAs. There is a slight but insignificant up-regulation in the mRNA expression of ACVRL1 in AVMs compared with both CCMs and STAs. Previous studies showed the overexpression of endoglin proteins in patients with sporadic and familial AVMs (27). The significance of the overexpression of genes responsible for familial CVMs in the lesions themselves remains unclear and merits further study.
The proteins VEGF and its receptors flt1 and flk1 were previously shown to be overexpressed in both AVMs and CCMs compared with normal blood vessels (18, 32). In our study, mRNA expression of VEGF was up-regulated in both AVMs and CCMs compared with STAs, at a probability approaching significance (P = 0.057). More mRNA expression was shown for ZYX in AVMs than in STAs. However, mRNA expression of KDR is down-regulated in CCMs compared with STAs.
Angiopoietin-1 and its receptors tie1 and tie2 are involved in angiogenesis. Gene expression of angiopoietin-1 ANGPT1 mRNA is down-regulated in both AVMs and CCMs compared with STAs. Gene expression of mRNA for both TIE and TEK is down-regulated in AVMs compared with STAs.
Gene expression of PECAM1 is lower in both AVMs and CCMs than in STAs. Decreased mRNA expression is shown for the endothelium-specific gap junction protein GJA4 connexin 37 in both AVMs and CCMs compared with STAs, and less expression is observed in CCMs than in AVMs, which are consistent with previous reports of tight junctions lacking in CCMs (8, 37).
Methodological Issues and Limitations
Although microarrays have introduced a powerful methodology for identifying scores of genes associated with a particular disease, they have limitations that may lead to discrepancies. One recent editorial proposed that results obtained by performing microarray experiments be validated through 1) reproducibility and control for run-to-run variations in gene expression, 2) statistical correction for repeated and multiple comparisons, 3) attention to tissue homogeneity, and 4) confirmation of results with the use of nonarray techniques (12).
For unbiased gene discovery, the Bonferroni correction for repeated and multiple comparisons is too stringent and would be expected to yield almost no results. Instead, the multiple comparison correction used in our experiment was based on the most stringent threshold for FDR in the Kruskal-Wallis rank-sum analysis of the genes that varied significantly. We hence included all genes that satisfied this threshold. A fold change cutoff would have biased the comparisons, so we reported the fold change for any differential expression that was statistically significant. The Kruskal-Wallis test is non-parametric, hence a mean and standard deviation was not included in the gene discovery results. Because most of the genes used in the confirmational analysis were chosen on the basis of a priori knowledge gained by performing immunohistochemistry, a more traditional statistical analysis was used in comparing the intensity of expression of known genes.
There is an FDR inherent in analyzing a large amount of data, the specificity of the oligonucleotide, and the variation in stringency conditions used in the oligonucleotide array. Genes that code for proteins with multiple isoforms and splice variants can complicate the microarray analysis. A potential example of such discrepancy was the expression of KDR, in which mRNA expression was lower in CCMs than in normal STAs, whereas previous immunohistochemical studies had shown greater expression in the lesions than in normal cerebral vessels (35). Another possible cause of this discrepancy is the different control tissue used (brain vessels versus STA) in the two studies.
Another major challenge with the use of emerging microarray technology is the problem of tissue heterogeneity. Many genes are cell-specific (i.e., VEGF receptors), and most lesions and control tissue are composed of multiple cell types. The pooling of mRNA or protein from lesional tissue inherently reflects and is affected by such heterogeneity. There might be relevant differential expression of genes in endothelial, smooth muscle, and other cells. Gene expression reflects the differential cell composition of lesions and/or the differential expression of genes in a particular cell type. For example, it is not surprising that a lesion such as a CCM, which lacks smooth muscle cells, is likely to exhibit underexpression of smooth muscle-related genes. Conversely, two cases of robust differential overexpression of immune system genes in CCMs, as compared with AVM and control tissue, force us to consider potential inflammatory mechanisms that are unique to these lesions. Differential gene expression in complex systems should be confirmed and further characterized in complementary experiments focused on the specific gene and the relevant cell line. Such experiments may include immunohistochemistry (34), in situ hybridization (33), or other techniques.
The selection of relevant controls is another potential source of bias. In this study, different lesion types were used for control comparisons of gene expression (AVM versus CCM) as well as normal scalp artery (lesion versus STA). Dissected cerebral vessels from surgical or autopsic tissue might provide additional meaningful comparisons in future studies, although they introduce new biases related to vessel-associated diseases and tissue harvesting. Cultured cell lines introduce other biases related to changes in phenotype and gene expression in vitro (2). Laser-dissected cell layers (i.e., endothelial layers) from pathological tissue were recently used to examine differential gene expression in a particular cell type (3). Such studies are needed to clarify the roles of specific genes and signaling pathways (as in the differential expression of KDR in isolated endothelial cells from lesions and controls and assayed levels of protein extracted from these cells).
Relevance and Future Research
In our study, 72 genes were differentially expressed in CCMs compared with AVMs. Many of these genes may be specifically involved in the cause or associated biological behavior of CCMs, and others may reflect associated thrombosis, vascular leakage, or epileptogenicity that are manifested in these lesions. Many of the 107 genes differentially expressed in AVMs compared with CCMs and STAs may be involved specifically in the AVM disease, and others may reflect features of arteriovenous shunting or secondary sequelae. Some of the 868 genes differentially expressed in both AVMs and CCMs compared with STAs may be related to vascular dysmorphism or its sequelae in either lesion type. These genes need to be cataloged according to their functional significance. Future studies should correlate differential gene expression with particular phenotypic, genotypic, or clinical features of the disease, such as CCMs with or without associated venous anomalies, lesions of different genotypic substrate, and lesions associated with hemorrhage or epilepsy. Considerable clinical heterogeneity exists even within familial forms of CCMs and AVMs. The differentially expressed genes described in our experiments are candidates for genetic modifiers of CCMs and AVMs.
It is known that for some genes, alterations in gene transcription may not necessarily affect the amount of protein present in the specimens (39). An analysis of differential proteomics with the use of mass spectrometry (11) should be conducted in AVMs and CCMs to confirm whether differential gene expression indeed reflects differences in the quantity of proteins produced by these genes and whether differential expression in the lesions reflects a complex, heterogeneous, and multicellular milieu. Candidate genes and related pathways should be studied further in homogeneous single-cell systems (cultured lines or laser-dissected cells) to confirm specific hypotheses regarding their role in CVM pathobiology.
Acknowledgments
We thank Sonia Flores, Ph.D., Bifeng Gao, Ph.D., Michael Handler, M.D., Kent Kilbourne, M.A., Keith Lepsch, R.N., Marjorie Wang, M.D., Hemant Sarin, M.D., Ozcan Ciklatekerlio, M.D., and B. Todd Woessener, B.S., for assistance with this project. This research was supported in part by Grant K24NS02153 from the National Institutes of Health.
Contributor Information
Robert Shenkar, Center for Cellular and Molecular Neurosurgery, Department of Neurosurgery, University of Colorado Health Sciences Center, Denver, Colorado
J. Paul Elliott, Center for Cellular and Molecular Neurosurgery, Department of Neurosurgery, University of Colorado Health Sciences Center, Denver, Colorado
Katrina Diener, Center for Cellular and Molecular Neurosurgery, Department of Neurosurgery, University of Colorado Health Sciences Center, Denver, Colorado
Judith Gault, Center for Cellular and Molecular Neurosurgery, Department of Neurosurgery, University of Colorado Health Sciences Center, Denver, Colorado
Ling-Jia Hu, Center for Cellular and Molecular Neurosurgery, Department of Neurosurgery, University of Colorado Health Sciences Center, Denver, Colorado
Randall J. Cohrs, Department of Neurology, University of Colorado Health Sciences Center, Denver, Colorado
Tzulip Phang, Center for Computational Pharmacology, Department of Pharmacology, University of Colorado Health Sciences Center, Denver, Colorado
Lawrence Hunter, Center for Computational Pharmacology, Department of Pharmacology, University of Colorado Health Sciences Center, Denver, Colorado
Robert E. Breeze, Center for Cellular and Molecular Neurosurgery, Department of Neurosurgery, University of Colorado Health Sciences Center, Denver, Colorado
Issam A. Awad, Center for Cellular and Molecular Neurosurgery, Department of Neurosurgery, University of Colorado Health Sciences Center, Denver, Colorado
References
- 1.Abdalla SA, Pece-Barbara N, Vera S, Tapia E, Paez E, Bernabeu C, Letarte M. Analysis of ALK-1 and endoglin in newborns from families with hereditary hemorrhagic telangiectasia type 2. Hum Mol Genet. 2000;9:1227–1237. doi: 10.1093/hmg/9.8.1227. [DOI] [PubMed] [Google Scholar]
- 2.Baev NI, Awad IA. Endothelial cell culture from human cerebral cavernous malformations. Stroke. 1998;29:2426–2434. doi: 10.1161/01.str.29.11.2426. [DOI] [PubMed] [Google Scholar]
- 3.Ball HJ, McParland B, Driussi C, Hunt NH. Isolating vessels from the mouse brain for gene expression analysis using laser capture microdissection. Brain Res Brain Res Protoc. 2002;9:206–213. doi: 10.1016/s1385-299x(02)00147-2. [DOI] [PubMed] [Google Scholar]
- 4.Brown RD., Jr . Epidemiology and natural history of vascular malformations of the central nervous system. In: Jafar JJ, Awad IA, Rosenwasser RH, editors. Vascular Malformations of the Central Nervous System. Philadelphia: Lippincott Williams & Wilkins; 1999. pp. 129–148. [Google Scholar]
- 5.Bruner JM, Tien RD, McLendon RE. Tumors of vascular origin. In: Bigner DD, McLendon RE, Bruner JM, editors. Russell and Rubinstein’s Pathology of Tumors of the Nervous System. 6. Vol. 2. London: Arnold; 1998. pp. 239–293. [Google Scholar]
- 6.Challa VR, Moody DM, Brown WR. Vascular malformations of the central nervous system. J Neuropathol Exp Neurol. 1995;54:609–621. doi: 10.1097/00005072-199509000-00001. [DOI] [PubMed] [Google Scholar]
- 7.Chomczynski P, Sacchi N. Single-step method of RNA isolation by acid guanidinium thiocyanate-phenol-chloroform extraction. Anal Biochem. 1987;162:156–159. doi: 10.1006/abio.1987.9999. [DOI] [PubMed] [Google Scholar]
- 8.Clatterbuck RE, Eberhart CG, Crain BJ, Rigamonti D. Ultrastructural and immunocytochemical evidence that an incompetent blood-brain barrier is related to the pathophysiology of cavernous malformations. J Neurol Neurosurg Psychiatry. 2001;71:188–192. doi: 10.1136/jnnp.71.2.188. [DOI] [PMC free article] [PubMed] [Google Scholar]
- 9.Craig HD, Gunel M, Cepeda O, Johnson EW, Ptacek L, Steinberg GK, Ogilvy CS, Berg MJ, Crawford SC, Scott RM, Steichen-Gersdorf E, Sabroe R, Kennedy CT, Mettler G, Beis MJ, Fryer A, Awad IA, Lifton RP. Multilocus linkage identifies two new loci for a Mendelian form of stroke, cerebral cavernous malformation, at 7p15-13 and 3q25.2-27. Hum Mol Genet. 1998;7:1851–1858. doi: 10.1093/hmg/7.12.1851. [DOI] [PubMed] [Google Scholar]
- 10.Curran-Everett D. Multiple comparisons: philosophies and illustrations. Am J Physiol Regul Integr Comp Physiol. 2000;279:R1–R8. doi: 10.1152/ajpregu.2000.279.1.R1. [DOI] [PubMed] [Google Scholar]
- 11.Fessler MB, Malcolm KC, Duncan MW, Worthen GS. A genomic and proteomic analysis of activation of the human neutrophil by lipopolysac-charide and its mediation by p38 mitogen-activated protein kinase. J Biol Chem. 2002;277:31291–31302. doi: 10.1074/jbc.M200755200. [DOI] [PubMed] [Google Scholar]
- 12.Firestein GS, Pisetsky DS. DNA microarrays: Boundless technology or bound by technology? Guidelines for studies using microarray technology. Arthritis Rheum. 2002;46:859–861. doi: 10.1002/art.10236. [DOI] [PubMed] [Google Scholar]
- 13.Gallione CJ, Scheessele EA, Reinhardt D, Duits AJ, Berg JN, Westermann CJ, Marchuk DA. Two common endoglin mutations in families with hereditary hemorrhagic telangiectasia in the Netherlands Antilles: Evidence for a founder effect. Hum Genet. 2000;107:40–44. doi: 10.1007/s004390000326. [DOI] [PubMed] [Google Scholar]
- 14.Garcia JH, Anderson ML. Circulatory disorders and their effects on the brain. In: Davis RL, Robertson DM, editors. Textbook of Neuropathology. 2. Baltimore: Williams & Wilkins; 1991. pp. 621–718. [Google Scholar]
- 15.Geraci MW, Moore M, Gesell T, Yeager ME, Alger L, Golpon H, Gao B, Loyd JE, Tuder RM, Voelkel NF. Gene expression patterns in the lungs of patients with primary pulmonary hypertension: A gene microarray analysis. Circ Res. 2001;88:555–562. doi: 10.1161/01.res.88.6.555. [DOI] [PubMed] [Google Scholar]
- 16.Golub TR, Slonim DK, Tamayo P, Huard C, Gaasenbeek M, Mesirov JP, Coller H, Loh ML, Downing JR, Caligiuri MA, Bloomfield CD, Lander ES. Molecular classification of cancer: Class discovery and class prediction by gene expression monitoring. Science. 1999;286:531–537. doi: 10.1126/science.286.5439.531. [DOI] [PubMed] [Google Scholar]
- 17.Gunel M, Awad IA, Anson J, Lifton RP. Mapping a gene causing cerebral cavernous malformation to 7q11.2-q21. Proc Natl Acad Sci U S A. 1995;92:6620–6624. doi: 10.1073/pnas.92.14.6620. [DOI] [PMC free article] [PubMed] [Google Scholar]
- 18.Guttmacher AE, Marchuk DA, White RI., Jr Hereditary hemorrhagic telangiectasia. N Engl J Med. 1995;333:918–924. doi: 10.1056/NEJM199510053331407. [DOI] [PubMed] [Google Scholar]
- 19.Johnson DW, Berg JN, Baldwin MA, Gallione CJ, Marondel I, Yoon SJ, Stenzel TT, Speer M, Pericak-Vance MA, Diamond A, Guttmacher AE, Jackson CE, Attisano L, Kucherlapati R, Porteous ME, Marchuk DA. Mutations in the activin receptor-like kinase 1 gene in hereditary haemorrhagic telangiectasia type 2. Nat Genet. 1996;13:189–195. doi: 10.1038/ng0696-189. [DOI] [PubMed] [Google Scholar]
- 20.Jones JM, Bentley E, Meisler MH, Darling SM. Genetic mapping of the voltage-gated shaker potassium channel β subunit Kcnab1 to mouse chromosome 3. Mamm Genome. 1998;9:260. doi: 10.1007/s003359900740. [DOI] [PubMed] [Google Scholar]
- 21.Kilic T, Pamir MN, Kullu S, Eren F, Ozek MM, Black PMcL. Expression of structural proteins and angiogenic factors in cerebrovascular anomalies. Neurosurgery. 2000;46:1179–1192. doi: 10.1097/00006123-200005000-00032. [DOI] [PubMed] [Google Scholar]
- 22.Kim JH. Pathology of epilepsy. Exp Mol Pathol. 2001;70:345–367. doi: 10.1006/exmp.2001.2372. [DOI] [PubMed] [Google Scholar]
- 23.Laberge-le Couteulx S, Jung HH, Labauge P, Houtteville JP, Lescoat C, Cecillon M, Marechal E, Joutel A, Bach JF, Tournier-Lasserve E. Truncating mutations in CCM1, encoding KRIT1, cause hereditary cavernous angiomas. Nat Genet. 1999;23:189–193. doi: 10.1038/13815. [DOI] [PubMed] [Google Scholar]
- 24.Lee CK, Klopp RG, Weindruch R, Prolla TA. Gene expression profile of aging and its retardation by caloric restriction. Science. 1999;285:1390–1393. doi: 10.1126/science.285.5432.1390. [DOI] [PubMed] [Google Scholar]
- 25.Ling L, Goeddel DV. T6BP, a TRAF6-interacting protein involved in IL-1 signaling. Proc Natl Acad Sci U S A. 2000;97:9567–9572. doi: 10.1073/pnas.170279097. [DOI] [PMC free article] [PubMed] [Google Scholar]
- 26.Lucas M, Costa AF, Montori M, Solano F, Zayas MD, Izquierdo G. Germline mutations in the CCM1 gene, encoding Krit1, cause cerebral cavernous malformations. Ann Neurol. 2001;49:529–532. [PubMed] [Google Scholar]
- 27.Matsubara S, Bourdeau A, terBrugge KG, Wallace C, Letarte M. Analysis of endoglin expression in normal brain tissue and in cerebral arteriovenous malformations. Stroke. 2000;31:2653–2660. doi: 10.1161/01.str.31.11.2653. [DOI] [PubMed] [Google Scholar]
- 28.McCormick WF. The pathology of vascular (“arteriovenous”) malformations. J Neurosurg. 1966;24:807–816. doi: 10.3171/jns.1966.24.4.0807. [DOI] [PubMed] [Google Scholar]
- 29.Mostert V, Selenoprotein P. Properties, functions, and regulation. Arch Biochem Biophys. 2000;376:433–438. doi: 10.1006/abbi.2000.1735. [DOI] [PubMed] [Google Scholar]
- 30.Rigamonti D, Johnson PC, Spetzler RF, Hadley MN, Drayer BP. Cavernous malformations and capillary telangiectasia: A spectrum within a single pathological entity. Neurosurgery. 1991;28:60–64. [PubMed] [Google Scholar]
- 31.Ruoslahti E, Pierschbacher MD. New perspectives in cell adhesion: RGD and integrins. Science. 1987;238:491–497. doi: 10.1126/science.2821619. [DOI] [PubMed] [Google Scholar]
- 32.Sahoo T, Johnson EW, Thomas JW, Kuehl PM, Jones TL, Dokken CG, Touchman JW, Gallione CJ, Lee-Lin SQ, Kosofsky B, Kurth JH, Louis DN, Mettler G, Morrison L, Gil-Nagel A, Rich SS, Zabramski JM, Boguski MS, Green ED, Marchuk DA. Mutations in the gene encoding KRIT1, a Krev-1/rap1a binding protein, cause cerebral cavernous malformations (CCM1) Hum Mol Genet. 1999;8:2325–2333. doi: 10.1093/hmg/8.12.2325. [DOI] [PubMed] [Google Scholar]
- 33.Uranishi R, Awadallah NA, Ogunshola OO, Awad IA. Further study of CD31 protein and messenger ribonucleic acid expression in human cerebral vascular malformations. Neurosurgery. 2002;50:110–116. doi: 10.1097/00006123-200201000-00019. [DOI] [PubMed] [Google Scholar]
- 34.Uranishi R, Baev NI, Kim JH, Awad IA. Vascular smooth muscle cell differentiation in human cerebral vascular malformations. Neurosurgery. 2001;49:671–680. doi: 10.1097/00006123-200109000-00027. [DOI] [PubMed] [Google Scholar]
- 35.Uranishi R, Baev NI, Ng PY, Kim JH, Awad IA. Expression of endothelial cell angiogenesis receptors in human cerebrovascular malformations. Neurosurgery. 2001;48:359–368. doi: 10.1097/00006123-200102000-00024. [DOI] [PubMed] [Google Scholar]
- 36.Van Laer L, Huizing EH, Verstreken M, van Zuijlen D, Wauters JG, Bossuyt PJ, Van de Heyning P, McGuirt WT, Smith RJ, Willems PJ, Legan PK, Richardson GP, Van Camp G. Nonsyndromic hearing impairment is associated with a mutation in DFNA5. Nat Genet. 1998;20:194–197. doi: 10.1038/2503. [DOI] [PubMed] [Google Scholar]
- 37.Wong JH, Awad IA, Kim JH. Ultrastructural pathological features of cere-brovascular malformations: A preliminary report. Neurosurgery. 2000;46:1454–1459. doi: 10.1097/00006123-200006000-00027. [DOI] [PubMed] [Google Scholar]
- 38.Zhang J, Clatterbuck RE, Rigamonti D, Chang DD, Dietz HC. Interaction between krit1 and ICAP1α infers perturbation of integrin β1-mediated angiogenesis in the pathogenesis of cerebral cavernous malformation. Hum Mol Genet. 2001;10:2953–2960. doi: 10.1093/hmg/10.25.2953. [DOI] [PubMed] [Google Scholar]
- 39.Zong Q, Schummer M, Hood L, Morris DR. Messenger RNA translation state: The second dimension of high-throughput expression screening. Proc Natl Acad Sci U S A. 1999;96:10632–10636. doi: 10.1073/pnas.96.19.10632. [DOI] [PMC free article] [PubMed] [Google Scholar]