Abstract
Gapped and ungapped sequence alignment were tested as possible methods to classify proteins into the functional classes defined by the International Enzyme Commission (EC). We exhaustively tested all 15,208 proteins labeled with any EC class in a recent release of the SwissProt database, evaluating all 1,327 relevant EC classes. We effectively tested all possible similarity thresholds that could be used for this assignment through the use of the ROC statistic. Approximately 60% of Enzyme Commission classes containing two or more proteins could not be perfectly discriminated by sequence similarity at any threshold. An analysis of the errors indicates that false positive matches dominate, and that various error mechanisms can be identified, including the multidomain nature of many proteins and polyproteins, convergent evolution, variation in enzyme specificity, and other factors. Many of the putatively false positives are in fact biologically relevant. This work strongly suggests that functional assignment of enzymes should attempt to delimit functionally significant subregions, or domains, before matching to EC classes.
Keywords: protein function, enzyme classes, sequence alignment, pairwise, Enzyme Commission, receiver operating characteristic
Introduction
Ideally, the biological function of a gene is revealed by an understanding of the detailed structure of its protein product. However, since protein structure determination is difficult, it is advantageous to be able to infer function directly from sequence. This paper reports on a systematic test of the hypothesis that enzymatic activity, a large subclass of biological function, can be predicted directly by sequence similarity. A useful result of this systematic test is the identification of the approximately 60% of EC classes which cannot be well predicted in this way. We investigated these specific prediction failures, and have characterized several contributing factors as a prelude to more sophisticated function prediction strategies.
The Enzyme Commission Classification
Biological function is a complex and imprecise concept. However, enzymes, which make up a large fraction of proteins, can be precisely characterized by the reactions that they catalyze. The International Enzyme Commission (EC) (EC 1961) (NC 1992) has developed a classification scheme based on this observation. The scheme is hierarchical, with four levels. At the top of the hierarchy are six broad classes of enzymatic activity; at the bottom are around 3,500 specific reaction types. EC classes are generally expressed as a string of four numbers separated by periods. References to EC classes with fewer than four numbers indicate an internal node in the tree, including all of the subclasses or leaves below it. The numbers specify a path down the hierarchy, with the leftmost number identifying the highest level. All results reported in this paper are based on the EC database ENZYME (Bairoch 1994) release 20.
For example, consider EC class identified as 1.2.3.4. This class is a member of the top level group 1, the oxidoreductases. The second level of the hierarchy identifies a sub-class; for the oxidoreductases, the second level specifies the kind of donor which is oxidized. In this case, sub-class 2 means the enzyme acts on the aldehyde or oxo group of donors. The third position in the oxidoreductase group specifies the kind of acceptor. In this example, the sub-sub-class 3 means that oxygen is the acceptor. The lowest level in the hierarchy (the leaf node) identifies a particular reaction. In this example, leaf 4 means the reaction is oxalate + O2 ⇋ CO2 + H2O2, which is catalyzed by two known proteins.
Table 1 summarizes the hierarchy and the distribution of 15,208 proteins which have been assigned an EC class. Each row corresponds to a top level classification. The number of subclasses at each level is then specified; for example, the oxidoreductases contain 19 second level groups, 64 third level groups and 311 leaves. The EC classes which are included in these counts have at least one protein. While there are 1,327 such classes, there are another 2,000 which do not have any proteins assigned to them. The total number of proteins in each top level classification is noted, as is the distribution of those proteins at the leaves. For oxidoreductases, there are 200 leaves with five or fewer proteins, and six leaves with more than 100 proteins. There are a total of 315 leaves which have only one protein.
Table 1.
Summary of the distribution of protein sequences in the EC classes. (Due to the assignment of some proteins to multiple EC classes, the sum of the entries in the column labeled prots is more than 15,208.)
| EC | Name | nodes at level | prots. | number of proteins in the leaves | ||||||
|---|---|---|---|---|---|---|---|---|---|---|
| 2 | 3 | 4 | 1 | 2–5 | 6–10 | 11–50 | > 50 | |||
| 1 | Oxidoreductases | 19 | 64 | 311 | 3766 | 84 | 116 | 56 | 44 | 11 |
| 2 | Transferases | 9 | 24 | 333 | 4363 | 68 | 139 | 63 | 51 | 12 |
| 3 | Hydrolases | 8 | 42 | 430 | 4649 | 127 | 173 | 66 | 49 | 15 |
| 4 | Lyases | 7 | 15 | 131 | 1604 | 23 | 49 | 21 | 36 | 2 |
| 5 | Isomerases | 6 | 15 | 54 | 576 | 7 | 22 | 9 | 14 | 2 |
| 6 | Ligases | 5 | 9 | 68 | 655 | 6 | 17 | 26 | 18 | 1 |
| Total | 54 | 169 | 1327 | 15208 | 315 | 516 | 241 | 212 | 43 | |
Around 400 multifunction proteins are assigned more than one EC class; the remaining proteins have only one EC number. Furthermore, for some proteins the specific function is not known and only partial EC classifications have been made. About 122 proteins are given only top level classifications, 163 are classified only to the second level, and 1,809 are classified only to the third level. Also, a few multifunction proteins have some partial EC numbers assigned to them. Note that a majority of the leaf classes have five or fewer proteins assigned to them.
Functional Assignment by Sequence Comparison
Our goal was to be able to take the amino acid sequence of an enzyme as input, and identify the class that the EC had assigned to it on the basis of sequence similarity. We tested the most common gapped and ungapped sequence comparison tools, FASTA (Pearson 1990) and BLAST (Altschul et al. 1990).
Sequence similarity scores calculated by an alignment algorithm are used as a measure of the similarity between a pair of proteins. Ideally, we would be able to set a threshold such that any query that matched a protein in a particular EC class with a similarity greater than the threshold could be guaranteed to be in the same EC class. There are several reasons that this ideal cannot be met. First, not all proteins with the same function have a high degree of sequence similarity; neither are all functionally distinct proteins always dissimilar in sequence. Second, many EC classes have very few sequences associated with them. It may be hard to recognize such classes due to undersampling.
The ability of sequence similarity measures to accurately predict EC classes depends both on the similarity measure used and on the threshold set for prediction. There is a tradeoff between the sensitivity and specificity of predictions, based on the level at which the threshold is set. These terms can be defined formally as follows. Let θ0 be the threshold set for an EC class, and θ be the similarity score between a given query sequence and another sequence which is a member of the EC class. If θ ≥ θ0 the query is predicted to be a member of the EC class. If a query is genuinely a member of the EC class and θ ≥ θ0, this query is a true positive (t+). If θ < θ0, the query is a false negative (f−). If the query was not genuinely a member of the EC class and θ < θ0, then the query is a true negative (t−). If a query is not genuinely a member of the EC class and θ ≥ θ0, then the query is a false positive (f+). For a set of query sequences, let T+ be the number of sequences classified t+, and likewise for T−, F+ and F−. Sensitivity P+ and specificity P− can then be defined as follows:
| (1) |
| (2) |
Because (P+, P−), vary with θ0, either some optimal value of θ0 or a performance measure independent of θ0 is needed. By gradually increasing θ0 in such a way that 0 ≤ (P+, P−) ≤ 1, a relationship between (P+, P−) is obtained. This is known as a receiver operating characteristic ROC (Swets 1982). Since the perfect performance for all values of θ0 is P+ = 1 and P− = 1 the area under the ROC should ideally be 1. The area under the ROC gives an overall measure of discrimination performance, P (equation 3).
| (3) |
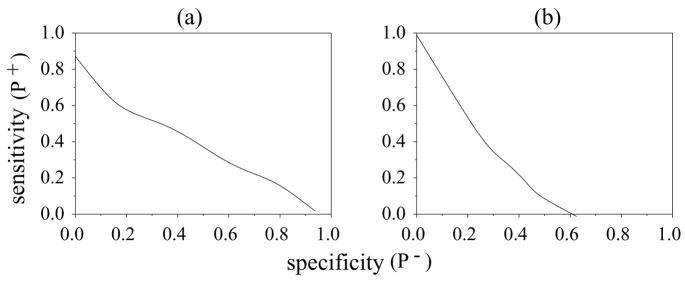
Figure 1 illustrates the use of ROC curves by hypothetical plots for two boundary cases. In figure 1(a) the sensitivity is less than 1 for a specificity of 0 (P+ < 1 for P− = 0). No matter how low the threshold θ0, not all positive members will be identified. On the other hand, in figure 1(b), the sensitivity drops to 0 before the sub-plot specificity reaches 1 (P+ = 0 and P− < 1). In this case, no matter how high the threshold is set, there will always be false positive matches.
Figure 1.
Hypothetical ROC Curves
We can now use the ROC curves and P scores to determine how accurately sequence can be used to predict EC classification, independent of the choice of threshold.
Method
We used the SWISS-PROT release 33 (Bairoch & Boeckmann 1992) database to obtain sequences labeled with EC classifications. We tested 13,215 sequences of the enzymes which had complete EC numbers assigned to them. The entire SWISS-PROT database was searched using both FASTA and BLAST with their default parameter values and substitution matrix set to BLOSUM 62, recording all matches and their scores. For each of the 1241 nodes in the EC hierarchy (after excluding the 315 leaf nodes with only a single protein instance), two ROC curves were calculated, using FASTA Z-score and BLAST expectation as similarity measures. The performance P was calculated by numerical integration of the area under the ROC curves.
Results
Pairwise alignment was sufficient to determine the correct EC class of 12,150 out of 13,215 proteins. Of the 1065 proteins which were not correctly assigned, 315 cannot be assigned by sequence similarity, since there is only one protein in the EC class. Therefore, 750 out of 12,900 proteins (about 6%) are incorrectly assigned EC class by sequence similarity.
The problem is much worse when considered class by class rather than protein by protein. Only 470 out of 1,221 EC classes (about 40%) at the leaves had P scores of 1, indicating that there exists a threshold that perfectly discriminates members of these classes by sequence similarity alone. No sequence similarity threshold can be used to reliably assign sequences to the remaining classes with P < 1. The majority of the remaining EC classes (about 48%) have 0.8 < P < 0.99. Sophisticated methods will be expected to improve the performance of these classes.
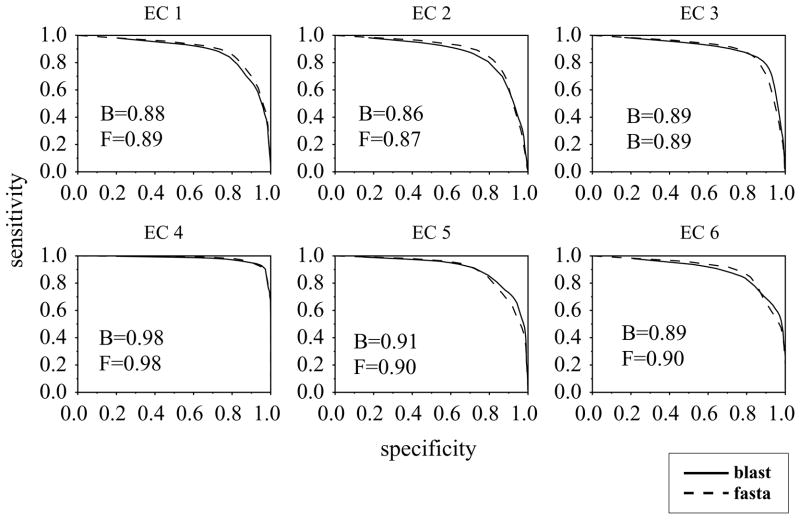
The performance results for all the EC classes, calculated using BLAST, are given in table 2. The results for FASTA are quite close to these. The ROCs for each of the six EC classes are given in figure 2.
Table 2.
Performance Results using BLAST expectation for all nodes in the EC, separated by EC class. Each column refers to a range of P, P1 < P ≤ P2, or a single value.
| EC | Performance range | ||||||
|---|---|---|---|---|---|---|---|
| 0 | 0–0.4 | 0.4–0.6 | 0.6–0.8 | 0.8–0.9 | 0.9–0.99 | 1 | |
| 1 | 15 | 2 | 5 | 39 | 47 | 89 | 109 |
| 2 | 11 | 0 | 3 | 36 | 40 | 75 | 134 |
| 3 | 3 | 2 | 9 | 43 | 69 | 76 | 140 |
| 4 | 3 | 0 | 1 | 8 | 23 | 46 | 49 |
| 5 | 1 | 0 | 1 | 10 | 17 | 19 | 19 |
| 6 | 0 | 0 | 0 | 9 | 26 | 23 | 19 |
| total | 33 | 4 | 19 | 145 | 222 | 328 | 470 |
Figure 2.
Each sub-plot shows the ROC for a top level EC class using blast (solid) and fasta (dotted).
The remainder of this section examines representatives of the classes with P < 1. Most of the problems were due to false positive matches, where a query sequence would match sequences in several other EC classes as well as sequences in the correct class. It was not possible to set thresholds, even on a class by class basis, such that many false positives would not occur.
A number of classes have P = 0, indicating that sequence similarity never is useful in predicting membership in these classes. In these cases, no detectable sequence similarity could be found between the members of these classes. Pyruvate synthase, EC 1.2.7.1, for example, is made up of four sub-units (Bock et al 1996). The four sequences in this class are fragments from each of the four subunits and share no sequence similarity. On the other hand, for haloacetate dehalogenase, EC 3.8.1.3, there are two distinct sequences for different forms of the enzyme. Examination of the high scoring alignments with one of the instances of EC 3.8.1.3 shows significant similarity with a sibling EC class, haloacid dehalogenases, EC 3.8.1.2. These are recorded as false positives even though the activities are closely related.
Muconate cycloisomerase, EC 5.5.1.1, also has P = 0 due to the occurrence of two distinct forms of the enzyme. The two enzymes are of bacterial and fungal origins and they may have evolved convergently (Mazur et al. 1994). As in the case of EC 3.8.1.3, there is appreciable functional and sequence similarity between a bacterial instance of EC 5.5.1.1 (CATB_PSEPU) and enzymes in the sibling EC node EC 5.5.1.7, chloromuconate cycloisomerase. Treating the EC numbers literally as labels makes this match count as a false positive. Yet sometimes a false positive may indeed have different function. This is shown by a match between CATB_PSEPU and MANR_PSEPU, a mandelate racemace belonging to EC 5.1.2.2. Both enzymes are similar in sequence and structure but mechanistically distinct (Neidhart, Kenyan, & Petsko 1990).
In cases when 0 < P < 1 there is no value of θ0 for which F+ = 0 and F− = 0. No matter what threshold is set, there will always be either false positives, false negatives or both. We have found various possible explanations for the low P classes. Many of these classes have very few sequences in them, suggesting that they are difficult because they are currently underrepresented in the database. This appears to be the explanation for the low P values observed for many of the classes with less than 10 proteins.
Assessing the performance of catalytic activities which occur as components of multidomain proteins is difficult. Consider the case of fatty acid synthetase (FAS), EC 2.3.1.85, which consists of seven catalytic domains: acetyltransferase, EC 2.3.1.38; malonyltransferase, EC 2.3.1.39; β-ketoacyl synthase, EC 2.3.1.41; β-ketoacyl reductase, EC 1.1.1.100; enoyl reductase, EC 1.3.1.10; β-hydroxyacyl dehydratase, EC 4.2.1.61; and thioesterase, EC 3.1.2.14. All instances of FAS in the database do not contain each of these domains. Sequence alignment with FAS yields some matches with other FAS proteins, followed by local matches with individual domains. If the whole protein is used as an instance of a component EC class, local matches with other classes are counted as false positives. If the extent of the domain on the protein is known, these false matches can be resolved. Although some of the domain coordinates are available in SWISS-PROT feature records, they are not used in the current treatment. The performance of FAS and the domains in it were found to lie within the range 0.7 < P < 0.9. The performance of EC classes which have domains in FAS is degraded due to false positives. Therefore those EC classes which have more single domain instances are found to have better performance.
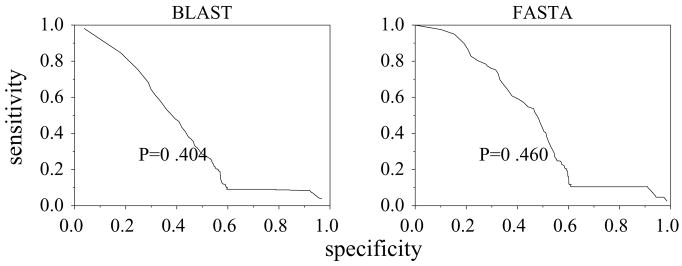
The viral pol polyprotein is another example of a multifunction protein. It consists of: retropepsin, EC 3.4.23.16; in some cases dutpase, EC 3.6.1.23; reverse transcriptase, EC 2.7.7.49; and ribonuclease, EC 3.1.26.4. The polypeptide undergoes cleavage to yield mature proteins with individual activities. Sequence alignment with the whole sequence yields matches with other pol proteins first, followed by individual reverse transcriptase and then dutpase sequences. Dutpase therefore has a low performance score of P = 0.4 using BLAST and P = 0.46 using FASTA (figure 3) while reverse transcriptase has P = 0.54 using BLAST and FASTA.
Figure 3.
ROC for EC 3.6.1.23
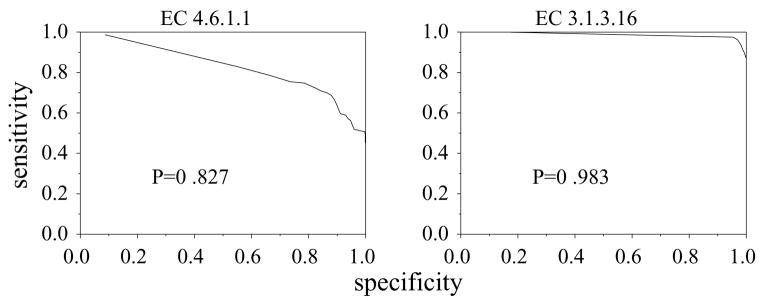
Also, enzymes that are not multifunction may nevertheless share domains with other proteins and thereby generate false positives. Adenylate cyclase, 4.6.1.1, has P = 0.8 (figure 4) for both BLAST and FASTA. Most of the false matches are due to common protein phosphatase domains. The most significant of such matches were found to occur with serine and threonine specific protein phosphatase, 3.1.3.16, which has P = 0.98 for both BLAST and FASTA (figure 4). Proteins within 4.6.1.1 are less similar to each other than ones within 3.1.3.16. This lower within class similarity makes it harder to set a threshold which distinguishes 4.6.1.1 from 3.1.3.16. The greater within-class similarity of 3.1.3.16 means that it is possible to set a relatively high threshold, which prevents the false positives which occur in 4.6.1.1.
Figure 4.
ROCs using BLAST for EC 3.1.3.16 and EC 4.6.1.1.
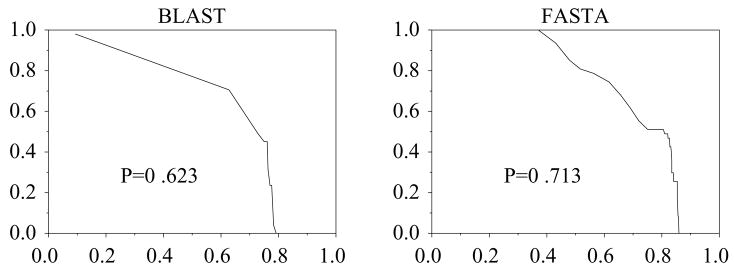
Another reason for low P scores may be vagueness in the definitions of the EC classes. For example, 3.4.21.32, collagenolytic proteases, were found to match other aspartic endopeptidases, 3.4.23. The performance for FASTA, P = 0.71 was greater than that for BLAST P = 0.62 (figure 5). A number of reasons could be attributed to this behavior: EC 3.4.21.32 was stated to have a broad specificity for peptide bonds; the false matches were with members of the peptidase family S1 (Rawlings & Barrett 1993), most of which possess some collagenolytic function. Another serine protease, tryptase, EC 3.4.21.59, was found to have low performance for similar reasons.
Figure 5.
ROC for EC 3.4.21.32
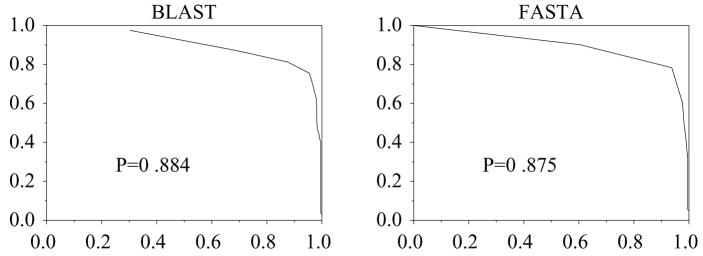
Performance can also be low due to matches with proteins which have not yet been assigned EC numbers. An example of this may be ribosomal RNA N-glycosidase, 3.2.2.22, which is a ribosome inactivating protein (RIP). It has P = 0.88 using BLAST and FASTA (figure 6). Inspection of the alignment lists shows matches with other RIPs which are not labeled with EC numbers.
Figure 6.
ROC for EC 3.2.2.22
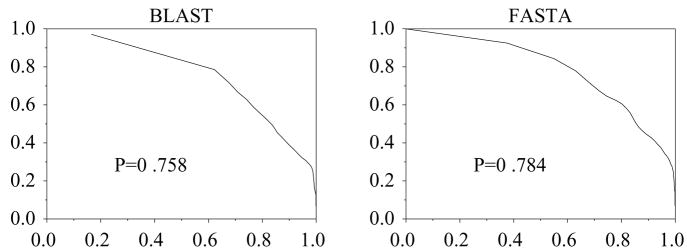
Yet another possible reason for a low P score may be that proteins that are closely related in evolution may have diverged in function. Glutathione S-transferases (GST), 2.5.1.18, have P = 0.78 for FASTA and P = 0.75 for BLAST (figure 7). A large number of false positives are found with the eye lens protein, S-crystallin. Crystallins are evolutionarily related to GST (Zinov’eva & Piatigorsky 1994), however, they are catalytically inactive and are specialized for lens refraction (Chiou et al 1995).
Figure 7.
ROC for EC 2.5.1.18
Alcohol dehydrogenase (ADH), EC 1.1.1.1 is an example which exhibits several of the problems discussed so far, and we will consider it in some detail. A value of P = 0.87 for BLAST and FASTA indicates enzymes in this class can be discriminated moderately well by sequence similarity. However, both false positives and false negatives are a problem in this class. In order to understand these problems, we analyzed both the sequences and the biology of the enzymes.
We clustered the pairwise sequence alignment scores of 120 ADH enzymes, identifying three distinct groups. These correspond to three known groups of structurally and mechanisticly different forms of ADH (Jornvall et al. 1995). There are 80 zinc-containing, 45 short-chain, and five iron-containing types of ADH.
The zinc-containing forms of ADH bind two zinc atoms, only one of which is catalytically active. There are other forms of dehydrogenases in EC 1.1.1 which depend on zinc as a cofactor and share some sequence similarity with EC 1.1.1.1. The short-chain form of ADH belongs to a larger group of oxidoreductases which use NAD+ or NADP+ as cofactors, like EC 1.3.1. The iron-containing forms of ADH, which use iron as a cofactor, also share similarity with other enzymes in EC 1.1.1. Due to the evolutionary relationships between ADH enzymes in EC 1.1.1.1 and the sibling nodes of EC 1.1.1, false matches are produced. Also because the relationships are different for each of the groups, their performance scores will be different if computed separately.
Some EC 1.1.1.1 enzymes are also bifunctional. In addition to the dehydrogenation of alcohols, they also catalyze the oxidation formaldehyde when glutathione is present (EC 1.2.1.1). They belong to the zinc-containing ADH family, consequently there are many matches between theses and other EC 1.1.1.1 members. These are examples of a single catalytic domain having a broad specificity.
Although many other oxidoreductases use the same donors or acceptors as cofactors, little sequence similarity is observed in the known cases. Some short chain ADH enzymes in EC 1.1.1.159 and EC 1.3.1.28, and enzymes in EC 1.6.1.1 and EC 1.4.1.1, show similar NAD+ binding sites. These create false positive matches.
Discussion and Conclusions
We systematically tested the usefulness of sequence similarity to predict EC class. In general, both sequence similarity measures tested provide a moderately good method for predicting biological function as defined by EC class. However, there are hundreds of classes of enzymes for which this method performs poorly. One factor is the lack of sequences associated with some of these classes. This undersampling should improve as the number of sequences known for different EC classes increases. However, there are also problems that are not associated with sample coverage.
The performance of EC classes which occur in multidomain proteins was found to be degraded by false matches. In this work, only the similarity score of protein matches was used to predict EC class membership. We did not consider information about where in a protein a match occurred, or any other aspects of the alignment. If such information were available, e.g., from domain annotations in SWISS-PROT records, it might have been possible to use it to reduce false positives by restricting consideration of similarity to matches only within an appropriate region. Distinguishing among specialized enzyme functions may not be possible using only overall measures of sequence similarity.
Catalytic functions belonging to the EC sub-sub-classes referring to structurally similar substrates were also found to have low performance. Because there is a functional similarity among sibling nodes, those matches, although strictly speaking false, are near misses. This is reflected in the increasing P values for higher nodes in the EC hierarchy, where sibling nodes are less similar to each other than they are at lower levels. Again in this case, distinguishing among specialized enzyme functions using sequence similarity was difficult.
One weakness of our general approach is the absolute nature of class membership assignments, and the simple correct/incorrect scoring method. A query sequence may align well with a sequence from a different EC class (or poorly with another sequence in the same class) for a variety of biological reasons. Many of the instances we label false positives here (and a few of the false negatives) are a result of biologically significant relationships among (or within) the EC classes themselves.
Evolutionary relatedness (and, by implication, sequence similarity) is not strictly correlated with functional relatedness. Hence many evolutionarily related proteins have diverged functionally. Examples of these in the EC are GST (EC 2.5.1.18) and S-crystallin; muconate cycloisomerase (EC 5.5.1.1) and mandelate racemase (EC 5.1.2.2). It is also the case that some evolutionarily unrelated proteins have converged to the same function. Examples of convergent evolution in the EC include the bacterial and fungal muconate cycloisomerases (EC 5.5.1.1), and the mammalian and insect alcohol dehydrogenases (EC 1.1.1.1). The evolutionary relationships between proteins must be given due consideration in order to use the EC as a practical tool for sequence based classification of enzyme function.
It is also quite possible that the Enzyme Commission classification itself is flawed in various ways. The continuous and consensus-based process for updating the classification is designed recognizing the fact that errors can be made. Any method for predicting protein function based on EC classification can only be as accurate as the classification itself.
In conclusion, sequence similarity methods provide a reasonable baseline for prediction of enzyme function, and the ROC statistic is a useful measure of the performance of this approach. The issue of gapped versus ungapped sequence alignment, as represented by BLAST and FASTA respectively did not make much of a difference in performance. However, there is a room for significant improvement. In evaluation, evolutionary relationships need to be considered along with the naive comparison of EC class numbers. Perhaps most importantly, methods that delimit functionally significant subregions of a query sequence before attempting to classify that sequence appear to be required for improving the quality of functional prediction.
Contributor Information
Imran Shah, Computational Sciences and Informatics, George Mason University, Fairfax, VA 22030 USA, ishah@gmu.edu.
Lawrence Hunter, Bldg. 38A, 9th fl, MS-54, National Library of Medicine, Bethesda, MD 20894 USA, hunter@nlm.nih.gov.
References
- Altschul S, Gish W, Miller W, Myers EW, Lipman DJ. Basic local alignment search tool. J Mol Biol. 1990;215:403–410. doi: 10.1016/S0022-2836(05)80360-2. [DOI] [PubMed] [Google Scholar]
- Bairoch A, Boeckmann B. The SWISS-PROT protein sequence data bank. Nucleic Acids Research. 1992;20:2019–2022. doi: 10.1093/nar/20.suppl.2019. [DOI] [PMC free article] [PubMed] [Google Scholar]
- Bairoch A. The ENZYME data bank. Nucleic Acids Res. 1994;22:3626–3627. [PMC free article] [PubMed] [Google Scholar]
- Bock A, Kunow J, Glasemacher J, Schonheit P. Catalytic properties, molecular composition and sequence alignments of pyruvate: ferredoxin oxidoreductase from the methanogenic archaeon methanosarcina barkeri (strain fusaro) Eur J Biochem. 1996;237:35–44. doi: 10.1111/j.1432-1033.1996.0035n.x. abstract. [DOI] [PubMed] [Google Scholar]
- Chiou S, et al. Octopus S-crystallins with endogenous glutathione S-transferase (GST) activity: sequence comparison and evolutionary relationships with authentic GST enzymes. Biochem J. 1995;309:793–800. doi: 10.1042/bj3090793. abstract. [DOI] [PMC free article] [PubMed] [Google Scholar]
- Report of the Commission on Enzymes of the International Union of Biochemistry. Pergammon Press; Oxford: 1961. [Google Scholar]
- Jornvall H, Danielsson O, Hjelmqvist L, Persson B, Shafqat J. The alcohol dehydrogenase system. Adv Exp Med Biol. 1995:281–294. doi: 10.1007/978-1-4615-1965-2_34. abstract. [DOI] [PubMed] [Google Scholar]
- Mazur P, Pieken WA, Budihas SR, Williams SE, Wong S, WKJ Cis, cis-muconate lactonizing enzyme from Trichosporon cutaneum: evidence for a novel class of cycloisomerases in eucaryotes. Biochemistry. 1994;33:1961–1970. doi: 10.1021/bi00173a045. abstract. [DOI] [PubMed] [Google Scholar]
- Nomenclature Committee of the International Union of Biochemistry and Molecular Biology. Academic Press; New-York: 1992. Enzyme Nomenclature. [Google Scholar]
- Neidhart D, Kenyan J, Petsko G. Mandelate racemase and muconate lactonizing enzyme are mechanistically distinct and structurally homologous. Nature. 1990;347:692–694. doi: 10.1038/347692a0. abstract. [DOI] [PubMed] [Google Scholar]
- Pearson W. Rapid and sensitive sequence comparison with FASTP and FASTA. Methods in Enzymology. 1990;183:63–98. doi: 10.1016/0076-6879(90)83007-v. [DOI] [PubMed] [Google Scholar]
- Rawlings N, Barrett A. Evolutionary families of peptidases. Biochem J. 1993;290:205–208. doi: 10.1042/bj2900205. abstract. [DOI] [PMC free article] [PubMed] [Google Scholar]
- Swets J. Measuring the Accuracy of Diagnostic Systems. New York: Academic Press; 1982. [DOI] [PubMed] [Google Scholar]
- Zinov’eva RD, Tomarev S, Piatigorsky J. The evolutionary kinship of the crystallins of cephalopods and vertebrates with heat-shock proteins and stress-induced proteins. Izv Akad Nauk Ser Biol. 1994:566–576. abstract. [PubMed] [Google Scholar]


