Abstract
The cocaine aptamer is a DNA molecule that binds cocaine at the junction of three helices. The bifunctional spectroscopic probe Ç was incorporated independently into three different positions of the aptamer and changes in structure and dynamics upon addition of the cocaine ligand were studied. Nucleoside Ç contains a rigid nitroxide spin label and can be studied directly by electron paramagnetic resonance (EPR) spectroscopy and fluorescence spectroscopy after reduction of the nitroxide to yield the fluoroside Çf. Both the EPR and the fluorescence data for aptamer 2 indicate that helix III is formed before cocaine binding. Upon addition of cocaine, increased fluorescence of a fully base-paired Çf, placed at the three-way junction in helix III, was observed and is consistent with a helical tilt from a coaxial stack of helices II and III. EPR and fluorescence data clearly show that helix I is formed upon addition of cocaine, concomitant with the formation of the Y-shaped three-way helical junction. The EPR data indicate that nucleotides in helix I are more mobile than nucleotides in regular duplex regions and may reflect increased dynamics due to the short length of helix I.
INTRODUCTION
Aptamers are nucleic acids with specific-recognition properties towards low-molecular-weight substrates or macromolecules such as proteins. Aptamers can be obtained through a combinatorial selection process known as systematic evolution of ligands by exponential enrichment (SELEX) (1,2), which is based on the ability of nucleic acids to bind ligand molecules with high affinity and specificity. Aptamers are prime candidates as sensors for various applications, such as environmental monitoring and medical diagnostics (3), after transforming aptamer-binding events into a physically detectable signal (4–7). With the discovery of riboswitches (8–11), aptamers have been shown to play important biological roles, for example by regulating gene expression by binding to metabolites (12–14). As with other functional biomolecules, aptamer structure and dynamics are closely tied with their function and, therefore, aptamers are useful molecules for studying properties of nucleic acids on the molecular level. An added advantage to studying aptamers is that specific conformational changes can be triggered by the addition of specific ligands, which when performed in conjunction with structural studies gives insights into molecular recognition of nucleic acids.
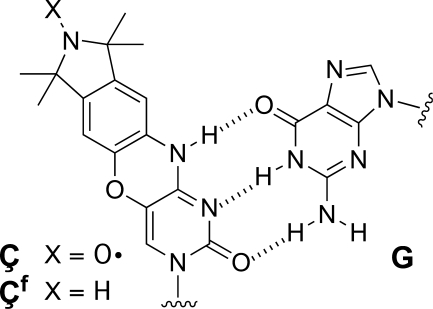
In our effort to develop and apply biophysical methods for the study of nucleic acids, we prepared spin-labeled nucleoside Ç (Figure 1) and incorporated it into DNA (15,16). This nucleoside is an analog of C that contains a rigid nitroxide spin label, which is a useful probe for studying nucleic acids structure and dynamics by electron paramagnetic resonance (EPR) (16). The nitroxide spin label is fused to the base to which it is attached and does, therefore, not move independent of the base. Pair-wise incorporation of Ç-labels into nucleic-acid helices, where Ç forms a stable base-pair with G (Figure 1), enables accurate distance measurements between the two labels and a determination of their relative orientation by EPR (17). Nucleoside Ç is also useful for studying dynamics, since the spin label is sensitive to the motion of the base, which can in turn give structural insights. For example, there is a large difference between the EPR spectra of a Ç-labeled single strand and that of a duplex (15), enabling the study of nucleic-acid secondary structure by EPR spectroscopy (15,16). Another useful feature of nucleoside Ç is that it can be effectively reduced by sodium sulfide after incorporation into DNA, yielding a fluorescent probe (Çf). The fluorescence of Çf is sensitive to its most immediate environment and can, for example, be used to detect and distinguish between different mismatches in duplex DNA (18). The bifunctionality of nucleoside Ç has enabled, for the first time, the use of both EPR and fluorescence spectroscopy to study the same nucleic-acid sample with nearly identical spectroscopic labels and has been used to study the secondary structure and dynamics of specific nucleotides in DNA hairpins that contain a four-base loop (16).
Figure 1.
Rigid spin label Ç and reduced spin label Çf base-paired to guanine.
Here we describe incorporation of nucleoside Ç into three positions of the DNA cocaine aptamer, which forms a three-way junction upon ligand binding. We show how Ç, in conjunction with EPR and fluorescence spectroscopies, can be used to extract information about structural changes that occur upon cocaine binding to the aptamer. We show that helix III is formed before cocaine binding but not helix I. An unexpected finding was that the fluorescence increased upon cocaine binding when Çf was placed in helix III, close to the helical junction, while EPR spectra did not change much. This data is consistent with a helical tilt from a coaxial stack of helices II and III upon ligand binding. Thus, the combined data give new insights into the structure and folding of the cocaine aptamer and shows the usefulness of nucleoside Ç in the study of nucleic acids structure and dynamics.
MATERIALS AND METHODS
General
Water was purified by MILLI-Q water purification system. DNA oligomers were synthesized on an ASM 800 DNA synthesizer from Biosset (Russia). All commercial phosphoramidites and columns were purchased from ChemGenes. Solvents and reagents were purchased from ChemGenes, SigmaAldrich and Applied Biosystems. UV–VIS spectra were recorded on a PerkinElmer Lambda 25 UV/VIS spectrometer. Steady-state fluorescence measurements were carried out at 20°C in a macro fluorescence cell with a path length of 0.5 cm on a SPEX FluoroMax spectrometer using an excitation wavelength of 365.5 nm. Continuous wave (CW) EPR spectra were recorded on a MiniScope MS200 (Magnettech, Germany) spectrometer.
DNA synthesis and purification
Spin-labeled oligonucleotides 5′-d(GAÇAAGGAAAATCCTTCAATGAAGTGGGTC), 5′-d(GACAAGGAAAATCCTTÇAATGAAGTGGGTC) and 5′-d(GACAAGGAAAATCCTTCAATGAAGTGGGTÇ) were synthesized by a trityl-off synthesis on 1.0 µmol (1000 Å CPG columns) scale using phosphoramidites with standard base-protection. The spin-labeled phosphoramidite (15) was site-specifically incorporated into the oligonucleotides by manual coupling and DNAs were deprotected at 55°C with aqueous ammonia. Oligomers were purified by 23% denaturing polyacrylamide gel electrophoresis (DPAGE) and eluted into TEN buffer (250 mM NaCl, 10 mM Tris, 1 mM Na2EDTA, pH 7.5). The DNA elution solutions were filtered using 0.45 µm polyethersulfone membrane (Whatman) and desalted using Sep-Pak cartridge (Waters Corporation) according to manufacturer's instructions. After removing the solvent in vacuo, the DNA was dissolved in deionized and sterilized H2O (100 µl). Concentrations of oligonucleotides were calculated from Beer's law, based on measurements of absorbance at 260 nm and using 305 500 M−1 cm−1 as the extinction coefficient of spin-labeled oligomers.
Steady-state fluorescence
All DNA samples were measured at 1.00 × 10⁻⁶ M in 400 µl of PNE buffer (10 mM Na2HPO4, 100 mM NaCl, 0.1 mM Na2EDTA, pH 7.0) containing 0–10 mM of cocaine. The samples were measured at 20°C using an excitation wavelength of 365.5 nm. Fluorescence spectra were averaged over five scans.
Reduction of spin-labeled DNA
Spin-labeled DNA oligomer (20 nmoles) was dissolved in 0.1 M Na2S (w/v, 50 µl) and heated at 45°C for 14 h. After completion of the reaction, the solution was diluted with sodium acetate (3.0 M, 10 µl, pH 5.3), the DNA precipitated by the addition of abs. ethanol (−20°C, 940 µl) and the sample stored at −20°C over 10 h. After centrifugation (13 000 rpm, 15 min, −10°C), the supernatant was removed, 70% ethanol/water solution (−20°C, 500 µl) was added and the resulting mixture allowed to stand at −20°C for 1 h. After centrifugation (13 000 rpm, 15 min, −10°C), the supernatant was removed and the pellet was washed with cold ethanol (50 µl). After drying the pellet, the DNA was dissolved in deionized and sterilized H2O (100 µl) and analyzed by DPAGE (data not shown).
EPR measurements
Spin-labeled DNA oligomer (0.7 nmol) was dissolved in PNE buffer (7 µl, final concentration 100 µM) containing 0–10 mM of cocaine. Samples (7 µl) were placed in a quartz capillary for EPR measurements. The CW measurements were taken with 100 kHz modulation frequency, 1.0 G modulation amplitude and 2.0 mW microwave power. Temperature was regulated to ± 0.2°C.
Simulation of EPR spectrum
EPR spectrum of unbound cocaine aptamer (containing 0 mM cocaine; Spectrum0 mM) and EPR spectrum of fully bound cocaine aptamer (containing 10 mM cocaine; Spectrum10 mM) were normalized with respect to their double-integrated area values in Matlab. The normalized EPR spectra were fractionally added together using the relation:
where Spectrums is the simulated spectrum of a partially bound aptamer. Having both the measured and simulated spectra plotted on the same graph the fraction value was adjusted to get the visual best-fit and thus α, the ratio of the bound to the unbound aptamer was determined. To calculate the dissociation constant (Kd), α was inserted into the following equation:
RESULTS AND DISCUSSION
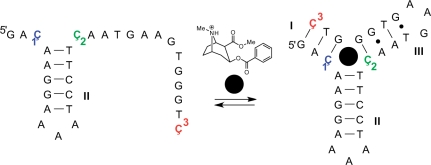
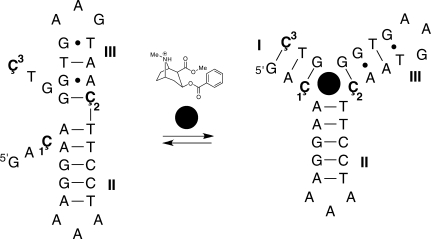
The cocaine aptamer, discovered by Stojanovic and coworkers, has specific recognition towards cocaine as other structurally related derivatives of cocaine do not bind (19). The construct of the cocaine aptamer that we used (Figure 2) was originally engineered as an aptamer-based fluorescent sensor for cocaine by incorporation of fluorescein on the 5′-end and dabcyl on the 3′-end as a quencher (20). This reasonably short DNA oligomer (30-mer) contains three Cs that are located in single-strand regions before binding and in a duplex after folding, according to a proposed model of the aptamer folding (20). Furthermore, two of the Cs are located at the helical junction, close to the aptamer binding. Since all three positions were good candidates for labeling, three aptamers were prepared, each containing a single label (Figure 2).
Figure 2.
The sequence of the cocaine DNA aptamer construct used in this study and a proposed folding pathway (20). The three positions that were independently labeled with nucleoside Ç in aptamers 1–3 are shown in color. The binding of cocaine (filled black circle) triggers the formation of a three-way junction. The structure of cocaine is shown above the arrows.
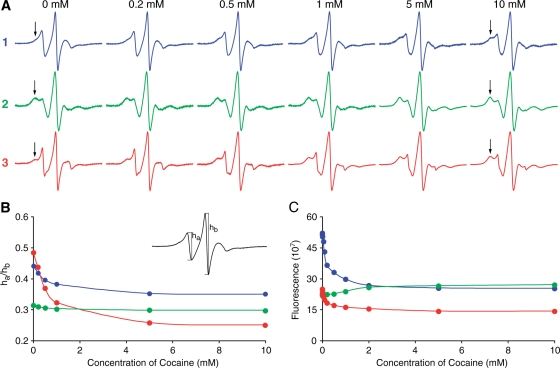
The EPR spectra of the spin-labeled aptamers 1 (blue), 2 (green) and 3 (red) were recorded at several different concentrations of cocaine at 20°C (Figure 3A). The EPR spectra of the aptamers without cocaine (0 mM) show that the mobility of the three positions before cocaine binding is very different. The dominant feature of the EPR spectra of aptamers 1 and 3, both of which are located in helix I, is that of a single-stranded DNA (15,16), indicating that helix I has not formed before the addition of cocaine. However, the slow-motion component, which is clearly observed in the EPR spectrum of 3 (indicated by arrow in Figure 3A) indicates that helix I is in an equilibrium between duplex and single strand. It is noteworthy that the slow-motion component is negligible in the EPR spectrum of 1, which was expected to be less mobile than 3, since 3 is located at the end of helix I. However, it has been observed in structures of three-way junctions that bulged nucleotides at this location in the junction are fully exposed to the solvent (21–24) and further supported by the fact that the fluorescence intensity of reduced 1 is about twice that of reduced 3 (more detailed description of fluorescence data below).
Figure 3.
(A) EPR spectra of the spin-labeled aptamers 1 (blue), 2 (green) and 3 (red) at various concentrations of cocaine in an aqueous solution at 20°C. The slow-motion component of the EPR spectra is indicated by an arrow. (B) A plot of the ha/hb ratio of the aptamer EPR spectra (see insert) vs. concentration of cocaine. ha is the height of the low-field peak and hb is the height of the centre peak of the EPR spectrum. (C) Relative fluorescence of reduced aptamers 1–3, plotted as a function of cocaine concentration in an aqueous solution at 20°C.
In contrast to aptamers 1 and 3, the EPR spectrum of 2 is similar to a spectrum of Ç located within a duplex region (15,16), indicating that helix III is already formed before the addition of cocaine. This result is in contrast to a previously proposed model of the secondary structure of this aptamer construct before ligand binding (20), which is predicted by the mfold software. According to mfold, the two non-canonical base-pairs in helix III are required for keeping helix III unfolded; replacement of either G•A or G•T with G•C results in folding of helix III. Thus, our data indicates that mfold does not take into account the energetic contribution resulting from stacking helices II and III for formation of helix III.
Upon titration of cocaine into the samples, the slow-motion component of 1 and 3 (indicated by arrows in Figure 3A) became more prominent, consistent with the notion that helix I is forming as cocaine binds to the aptamer. Interestingly, the slow-motion component of the EPR spectrum of 1 is less prominent than of 3 at all concentrations of cocaine indicating that 1 remains more mobile than 3, even after cocaine binding.
As a more quantitative measure of cocaine binding, we plotted the ratio of the height of the center peak of EPR spectrum (hb) and the peak corresponding to the fast-motion component (ha) as a function of cocaine concentration (see insert in Figure 3B). The fast-motion component of the EPR spectrum is observed for single-stranded DNA (15,16). This simple spectral analysis clearly illustrates the relative mobilities of each construct as a function of cocaine concentration; the higher the ha/hb ratio, the higher the overall mobility of the spin label. The largest change in the EPR spectra upon titration of cocaine is observed for position 3, which was not unexpected, since the label is located at the 3′-end of helix I. The changes in the EPR spectra were specific for cocaine; no appreciable changes were observed for any of the three constructs in a solution of 10 mM NH4Cl (aq), compared to the spectrum recorded without cocaine (data not shown). This demonstrated that the changes in the EPR spectra were specific to binding of cocaine molecule to the aptamer, rather than non-specific ionic interactions from the positively charged cocaine.
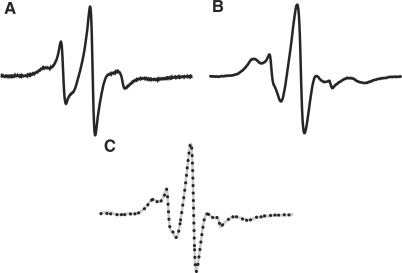
The dissociation constant (Kd) for cocaine binding was calculated based on binding equilibrium data extracted from the EPR spectra. Only aptamers 1 and 3 were used for determination of Kd since titration of cocaine into a solution of aptamer 2 causes negligible changes in dynamics of that position. The spectrum of the unbound (0 mM cocaine) and the fully bound aptamer (10 mM cocaine) were simply added to match the spectrum of the partially bound aptamer. The unbound and fully bound spectra were first normalized with respect to their double-integrated area values and fractionally added together to give the simulated spectrum. Figure 4 shows the simulation of aptamer 3 in the presence of 1 mM cocaine. The superimposition of the grey line (Figure 4C, 1 mM cocaine) with the dotted line, obtained from addition of the unbound and fully bound spectra (Figure 4A and 4B, respectively), shows an excellent fit. The ratio of the bound to the unbound aptamer (α) subsequently enabled determination of Kd to be 310 ± 70 µM and 260 ± 60 µM using aptamer 1 and 3, respectively (see Materials and methods section).
Figure 4.
(A) EPR spectrum of 3 in absence of cocaine. (B) EPR spectrum of 3 in presence of 10 mM cocaine. (C) EPR spectrum of 3 (gray) in the presence of 1 mM cocaine, superimposed with the simulated spectrum (black dots). EPR spectra were measured at 20°C.
Since Ç can be effectively reduced in DNA to yield the fluorescent nucleotide Çf (18), fluorescence spectroscopy was also used to study the cocaine aptamer folding. After reducing the three spin-labeled aptamers with Na2S, the fluorescence intensity was recorded as a function of cocaine concentration (Figure 3C). The titration of cocaine into samples 1 and 3 gave very similar results, showing a decrease in fluorescence. This decrease is likely due to formation of a Çf•G base-pair, which has been reported to partially quench the fluorescence intensity of Çf (18). This result can be explained by formation of helix I upon titration of cocaine and is further supported by the EPR data. The fluorescence data for the cocaine titration yielded a dissociation constant (Kd) of around 150 µM and 100 µM for 1 and 3, respectively. These Kd values are similar to those determined by Stojanovic and coworkers for this aptamer construct using fluorescence measurements (20).
In contrast to the fluorescence data obtained for aptamers 1 and 3, the fluorescence of 2 increased during the titration. One possible explanation is that the Çf•G base-pair in this aptamer is disrupted upon cocaine binding. However, the mobility of Ç, as determined by EPR spectroscopy, is consistent with Ç being base-paired. Therefore, a more likely explanation of the increased fluorescence is that a cocaine-induced conformational change at the junction increases the exposure of Çf in 2 to the solvent without disrupting the Çf•G base pair. It should be noted that since the Kd for aptamer 2 could not be determined directly, we cannot rule out that the spin label in aptamer 2 is interfering with cocaine binding. However, the increase in fluorescence for 2 mirrors the decrease in fluorescence for 1 and 3, indicating similar Kd values.
The previously proposed structural model for cocaine-aptamer complex has cocaine binding at the helical junction of a Y-shaped three-way junction (19,20,25). Perfectly paired three-way helical junctions without any additional unpaired bases at the junction, like the cocaine aptamer, should in principle be able to stack two of the three helices to form a T-shaped molecule (23). However, it has been shown that a three-way DNA junction, where all the bases are base-paired and located in each of the three helices is a Y-shaped molecule without any helix–helix stacking (23,26–28). However, the construct that we used has a short helix I, which is not formed to an appreciable extent in the absence of the ligand and as a result, helix III can now stack on helix II. Similar three-way junctions with two unpaired bases in one strand have been shown to have pair-wise stacking of two helices (21–24). Upon forming helix I and binding cocaine to the junction, we propose that helix III tilts to form the Y-shape three-way junction, thus increasing the exposure of the Çf•G base pair to the solvent and thereby the fluorescence (Figure 5).
Figure 5.
Proposed structural changes of the cocaine DNA aptamer upon cocaine binding based on EPR and fluorescence data. The binding of cocaine (filled black circle) triggers the formation of a three-way junction. The structure of cocaine in the picture is messed up. One of the bonds in the aromatic ring has been shifted inside the ring.
Our method based on incorporation of the bifunctional spectroscopic probe at the three-way junction allowed us to study, for the first time, transition between DNA molecule with two coaxially stacked duplexes that undergoes a conformational change, presumably to a Y-shape, upon cocaine binding and concomitant formation of a perfectly paired three-way junction. Other methods have been used to study the global shape of junctions. Comparative gel electrophoresis of Y-shaped DNA molecules has been used to show that the three angles between the arms of perfect three-way DNA junctions were almost equal (26) and atomic force microscopy showed that three-way junction is consistent with pyramidal arrangement of the arms (28). FRET experiments have revealed similar end-to-end distances of perfectly paired three-way junctions, thus providing additional evidence for the Y-shape (27). However, to our knowledge, no high-resolution NMR or X-ray structures have been reported of Y-shaped DNA junctions, presumably because they are very flexible. Pair-wise incorporation of the rigid spin label Ç into the three helices around the junction in conjunction with EPR measurements should provide more detailed information about the structure and dynamics of perfectly paired junctions. These experiments are underway and will be reported in due course.
CONCLUSION
The bifunctional spectroscopic probe Ç was incorporated independently into three different positions of the cocaine aptamer and changes in structure and dynamics of the aptamer upon addition of the cocaine ligand studied by both EPR and fluorescence spectroscopies. Both the EPR and fluorescence data for aptamer 2 indicate that helix III is formed before cocaine binding. Upon addition of cocaine, increased fluorescence of a fully base-paired Çf, placed at the three-way junction in helix III, was observed and is consistent with a helical tilt from a coaxial stack of helices II and III. EPR and fluorescence data clearly show that helix I is formed upon addition of cocaine, concomitant with the formation of the Y-shaped three-way helical junction. The EPR data indicate that nucleotides in helix I are more mobile than nucleotides in regular duplex regions in the presence of cocaine, especially the labeled nucleotide at the helical junction (aptamer 1). This mobility of the nucleotides in helix I may reflect the short length of helix I, which may be in equilibrium with the open form. These results show how a combination of EPR and fluorescence spectroscopies using nucleoside Ç can give valuable information about the structure and dynamics of nucleic acids.
FUNDING
The Icelandic Research Fund (060028023); doctoral fellowship to P.C. from the Eimskip Fund of the University of Iceland. Funding for open access charge: Science Institute, University of Iceland.
Conflict of interest statement. None declared.
ACKNOWLEDGEMENTS
We wish to thank members of the Sigurdsson research group for critical reading of the manuscript.
REFERENCES
- 1.Ellington AD, Szostak JW. In vitro selection of RNA molecules that bind specific ligands. Nature. 1990;346:818–822. doi: 10.1038/346818a0. [DOI] [PubMed] [Google Scholar]
- 2.Tuerk C, Gold L. Systematic evolution of ligands by exponential enrichment: RNA ligands to bacteriophage-T4 DNA-polymerase. Science. 1990;249:505–510. doi: 10.1126/science.2200121. [DOI] [PubMed] [Google Scholar]
- 3.Liu J, Lu Y. Fast colorimetric sensing of adenosine and cocaine based on a general sensor design involving aptamers and nanoparticles. Angew. Chem. Int. Edit. 2005;45:90–94. doi: 10.1002/anie.200502589. [DOI] [PubMed] [Google Scholar]
- 4.Xiao Y, Lubin AA, Heeger AJ, Plaxco KW. Label-free electronic detection of thrombin in blood serum by using an aptamer-based sensor. Angew. Chem. Int. Edit. 2005;44:5456–5459. doi: 10.1002/anie.200500989. [DOI] [PubMed] [Google Scholar]
- 5.Baker BR, Lai RY, Wood MS, Doctor EH, Heeger AJ, Plaxco KW. An electronic, aptamer-based small-molecule sensor for the rapid, label-free detection of cocaine in adulterated samples and biological fluids. J. Am. Chem. Soc. 2006;128:3138–3139. doi: 10.1021/ja056957p. [DOI] [PubMed] [Google Scholar]
- 6.Shlyahovsky B, Li D, Weizmann Y, Nowarski R, Kotler M, Willner I. Spotlighting of cocaine by an autonomous aptamer-based machine. J. Am. Chem. Soc. 2007;129:3814–3815. doi: 10.1021/ja069291n. [DOI] [PubMed] [Google Scholar]
- 7.Li N, Ho CM. Aptamer-based optical probes with separated molecular recognition and signal transduction modules. J. Am. Chem. Soc. 2008;130:2380–2381. doi: 10.1021/ja076787b. [DOI] [PubMed] [Google Scholar]
- 8.Mandal M, Breaker RR. Gene regulation by riboswitches. Nat. Rev. Mol. Cell Biol. 2004;5:451–463. doi: 10.1038/nrm1403. [DOI] [PubMed] [Google Scholar]
- 9.Nudler E, Mironov AS. The riboswitch control of bacterial metabolism. Trends Biochem. Sci. 2004;29:11–17. doi: 10.1016/j.tibs.2003.11.004. [DOI] [PubMed] [Google Scholar]
- 10.Vitreschak AG, Rodionov DA, Mironov AA, Gelfand MS. Riboswitches: the oldest mechanism for the regulation of gene expression? Trends Genet. 2004;20:44–50. doi: 10.1016/j.tig.2003.11.008. [DOI] [PubMed] [Google Scholar]
- 11.Tucker BJ, Breaker RR. Riboswitches as versatile gene control elements. Curr. Opin. Struct. Biol. 2005;15:342–348. doi: 10.1016/j.sbi.2005.05.003. [DOI] [PubMed] [Google Scholar]
- 12.Edwards TE, Klein DJ, Ferre-D'Amare AR. Riboswitches: small-molecule recognition by gene regulatory RNAs. Curr. Opin. Struct. Biol. 2007;17:273–279. doi: 10.1016/j.sbi.2007.05.004. [DOI] [PubMed] [Google Scholar]
- 13.Serganov A, Patel DJ. Ribozymes, riboswitches and beyond: regulation of gene expression without proteins. Nat. Rev. Genet. 2007;8:776–790. doi: 10.1038/nrg2172. [DOI] [PMC free article] [PubMed] [Google Scholar]
- 14.Montange RK, Batey RT. Riboswitches: emerging themes in RNA structure and function. Annu. Rev. Biophys. 2008;37:117–133. doi: 10.1146/annurev.biophys.37.032807.130000. [DOI] [PubMed] [Google Scholar]
- 15.Barhate N, Cekan P, Massey AP, Sigurdsson ST. A nucleoside that contains a rigid nitroxide spin label: a fluorophore in disguise. Angew. Chem. Int. Edit. 2007;46:2655–2658. doi: 10.1002/anie.200603993. [DOI] [PubMed] [Google Scholar]
- 16.Cekan P, Smith AL, Barhate N, Robinson BH, Sigurdsson ST. Rigid spin-labeled nucleoside Ç: a nonperturbing EPR probe of nucleic acid conformation. Nucleic Acids Res. 2008;36:5946–5954. doi: 10.1093/nar/gkn562. [DOI] [PMC free article] [PubMed] [Google Scholar]
- 17.Schiemann O, Cekan P, Margraf D, Prisner TF, Sigurdsson ST. Relative orientation of rigid nitroxides by PELDOR: Beyond distance measurements in nucleic acids. Angew. Chem. Int. Edit. 2009;48:3292–3295. doi: 10.1002/anie.200805152. [DOI] [PubMed] [Google Scholar]
- 18.Cekan P, Sigurdsson ST. Single base interrogation by a fluorescent nucleotide: Each of the four DNA bases identified by fluorescence spectroscopy. Chem. Commun. 2008:3393–3395. doi: 10.1039/b801833b. [DOI] [PubMed] [Google Scholar]
- 19.Stojanovic MN, de Prada P, Landry DW. Fluorescent sensors based on aptamer self-assembly. J. Am. Chem. Soc. 2000;122:11547–11548. doi: 10.1021/ja0022223. [DOI] [PubMed] [Google Scholar]
- 20.Stojanovic MN, de Prada P, Landry DW. Aptamer-based folding fluorescent sensor for cocaine. J. Am. Chem. Soc. 2001;123:4928–4931. doi: 10.1021/ja0038171. [DOI] [PubMed] [Google Scholar]
- 21.Rosen MA, Patel DJ. Structural features of a three-stranded DNA junction containing a C-C junctional bulge. Biochemistry. 1993;32:6576–6587. doi: 10.1021/bi00077a011. [DOI] [PubMed] [Google Scholar]
- 22.Thiviyanathan V, Luxon BA, Leontis NB, Illangasekare N, Donne DG, Gorenstein DG. Hybrid-hybrid matrix structural refinement of a DNA three-way junction from 3D NOESY-NOESY. J. Biomol. NMR. 1999;14:209–221. doi: 10.1023/a:1008330011425. [DOI] [PubMed] [Google Scholar]
- 23.Lilley DMJ. Structures of helical junctions in nucleic acids. Q Rev Biophys. 2000;33:109–159. doi: 10.1017/s0033583500003590. [DOI] [PubMed] [Google Scholar]
- 24.Wu B, Girard F, van Buuren B, Schleucher J, Tessari M, Wijmenga S. Global structure of a DNA three-way junction by solution NMR: towards prediction of 3H fold. Nucleic Acids Res. 2004;32:3228–3239. doi: 10.1093/nar/gkh645. [DOI] [PMC free article] [PubMed] [Google Scholar]
- 25.Stojanovic MN, Green EG, Semova S, Nikic DB, Landry DW. Cross-reactive arrays based on three-way junctions. J. Am. Chem. Soc. 2003;125:6085–6089. doi: 10.1021/ja0289550. [DOI] [PubMed] [Google Scholar]
- 26.Duckett DR, Lilley DM. The three-way DNA junction is a Y-shaped molecule in which there is no helix-helix stacking. EMBO J. 1990;9:1659–1664. doi: 10.1002/j.1460-2075.1990.tb08286.x. [DOI] [PMC free article] [PubMed] [Google Scholar]
- 27.Stuhmeier F, Lilley DM, Clegg RM. Effect of additional unpaired bases on the stability of three-way DNA junctions studied by fluorescence techniques. Biochemistry. 1997;36:13539–13551. doi: 10.1021/bi970245x. [DOI] [PubMed] [Google Scholar]
- 28.Shlyakhtenko LS, Potaman VN, Sinden RR, Gall AA, Lyubchenko YL. Structure and dynamics of three-way DNA junctions: atomic force microscopy studies. Nucleic Acids Res. 2000;28:3472–3477. doi: 10.1093/nar/28.18.3472. [DOI] [PMC free article] [PubMed] [Google Scholar]


