


Abstract
A major obstacle towards understanding the molecular basis of transcriptional regulation is the lack of a recognition code for protein–DNA interactions. Using high-quality crystal structures and binding data on the promiscuous family of C2H2 zinc fingers (ZF), we decode 10 fundamental specific interactions responsible for protein–DNA recognition. The interactions include five hydrogen bond types, three atomic desolvation penalties, a favorable non-polar energy, and a novel water accessibility factor. We apply this code to three large datasets containing a total of 89 C2H2 transcription factor (TF) mutants on the three ZFs of EGR. Guided by molecular dynamics simulations of individual ZFs, we map the interactions into homology models that embody all feasible intra- and intermolecular bonds, selecting for each sequence the structure with the lowest free energy. These interactions reproduce the change in affinity of 35 mutants of finger I (R2 = 0.998), 23 mutants of finger II (R2 = 0.96) and 31 finger III human domains (R2 = 0.94). Our findings reveal recognition rules that depend on DNA sequence/structure, molecular water at the interface and induced fit of the C2H2 TFs. Collectively, our method provides the first robust framework to decode the molecular basis of TFs binding to DNA.
INTRODUCTION
Understanding the structure and stability of protein–DNA complexes is a fundamental goal in structural biology. Currently, most methods to detect DNA binding or regulatory sites rely on a combination of sequence information, conservation patterns, genome annotations and affinity data (1–3). However, the short length of binding sites and intrinsically degenerate nature of DNA lead to a high number of false positives. Since the underprediction and, more significantly, the overprediction of protein–DNA interactions are the current bottlenecks for understanding regulatory networks, it is of prime importance to develop new methods to eliminate the relatively large number of false positive predictions. Revealing the molecular basis of transcriptional regulation is also critical to understand how specific genes are activated/repressed leading to normal cell function or to the acquisition of pathogenic traits (4).
The C2H2 zinc finger (ZF) family of transcription factor (TF) proteins is a well documented system to study protein–DNA interactions (5–8). It is also a biologically important family, being activated in response to a wide variety of stimuli. From a structural point of view, this family of TFs is highly conserved, encompassing two or more modular ZF domains that work together to recognize specific DNA sequences. Because of the regular structural patterns that ZF domains use to bind DNA (Figure 1), ZFs are ideal model systems to be studied both theoretically (5;9–14) and experimentally (15–19).
Figure 1.

Structure of EGR complexed with its consensus site. (A) EGR is colored yellow and DNA is colored pink. Two exposed side chains at the binding sites of fingers I and III are shown as blue spheres. Buried key arginines are shown as cyan spheres. (B) Binding mode of FI of EGR. Hydrogen bonds are showed as pink dashed lines. (C) Diagram of interaction network of FI. Arrows indicate H-bonds. Colors correspond to a classification scheme detailed in Table 2. Black arrows indicate intramolecular H-bonds, those drawn above/below protein sequence correspond to sc–bb/sc–sc bonds.
The large amount of available experimental data has been instrumental in many attempts to decipher the recognition code of C2H2–DNA interactions. Some examples include the development of probabilistic methods to predict DNA binding sites (1–3,5,11,20,21) and structure based approaches that also require an experimentally determined structure or reasonable model of the complex (10,12–14,22–33). Specifically, a detailed all atom potential by Morozov et al. (12) has reported ΔΔG predictions for finger I (FI) of EGR with a correlation coefficient of 0.59. Paillard et al. (13) calculated free energies for FII mutants of EGR, resulting in reasonable correlations but the energies are an order of magnitude higher than the experimental free energies. It is also worth mentioning methods (23,24,30–32,34) that assume additivity of residue–base pair-wise interactions such that the total interaction energy is the sum of energies of individual contacts. Two recent studies (35,36) have addressed this additivity assumption, concluding that it does not fit the experimental data. O’Flanagan et al. (36) focused on the sequence dependent flexibility of DNA deformation on the TATA box-binding domain and concluded that non-additive effects on the DNA side involve only dinucleotide steps.
In this article, we use a comprehensive analysis of high-quality binding experiments from Liu and Stormo (17) and crystal structures solved by Pabo and collaborators (37,38) to decode a minimal set of 10 fundamental interactions that allow us to predict the affinity and complex structures of 89 different EGR-like C2H2 TFs. The interactions account for a novel classification of intermolecular hydrogen bonds (H-bonds) and atom desolvation penalties, as well as a water accessibility factor that mediates these interactions. To predict the change of binding affinity for each mutant, we use the EGR crystal structure (38) to build homology models of all possible intra- and intermolecular H-bonds allowed in the different binding modes resolved for this complex (37), and then select the model with the lowest free energy. Three independent data sets of 35 mutants of FI (17), 23 mutants of FII (15) and 31 different FIII proteins (19) are predicted with correlation coefficients R2 of 0.998, 0.96 and 0.94, respectively. It is worth noting that FIII proteins are ZF domains amplified from the human genome, where the sequence identity between human ZFs and EGR is minimal. Our approach also selects the lowest free energy structure as the most likely structural model for each protein. This information is quite valuable since only two structures out of the 90 ZFs considered here have been resolved experimentally. Specific interactions show little or no contribution from long-range interactions or water-mediated H-bonds. However, solvent at the interface modulates the strength of intermolecular interactions. The good agreement between predicted and experimental data provided by the interaction and recognition code developed here suggests that DNA deformations impose important constraints in both the allowed H-bond network and the number of water molecules present at the binding interface. Moreover, homology models and known crystals suggest that most of the induced fit occurs from the protein side steered by short range intermolecular H-bonds. Desolvation penalties account for buried donor and/or acceptor side chain (sc) groups that do not form a H-bond with the backbone (bb) of protein or DNA, referred here as free or unmatched polar groups. Our approach highlights that the full assessment of protein–DNA interactions is intimately related to detailed predictions of the loci of water molecules at the binding interface.
METHODS
C2H2 ZF TFs
The classical ZF domain is composed of a ββα-fold that typically interacts with 3–4 base pair of DNA using key residues in the N-terminal part of its α-helix to make the contacts. The classical ZF EGR has three fingers that wrap around DNA (38), with the α-helices fitting into the major groove (Figure 1A). FI binds to a GCG triplet near the 3′ end of the primary DNA strand. FII binds to the TGG triplet in the center and FIII binds to the GCG triplet near the 5′ end of the primary DNA strand. Figure 1B and C shows a cartoon and sketch of the intra- and intermolecular H-bonds for each finger. Note that although the binding site residues and nucleotides of fingers I and III are identical, an Arg preceding the α-helix (R−1, where number is relative to the first residue of α-helix), an aspartic acid on the second position (Pos. +2) of the α-helix (D+2), a glutamic acid at Pos. +3 (E+3) and an Arg at Pos. +6 (R+6), R−1 and R+6 are not symmetric in their exposure to solvent. In what follows, all fingers in the text are named using the amino acids at positions −1, +2, +3 and +6 of the recognition helix (i.e. EGR FI is RDER).
Datasets of EGR mutants
Liu and Stormo (17) mutated FI α-helix positions −1 and +3 resulting in three single (RDNR, QDER, DDER) and two double (QDNR and DDNR) mutants of EGR FI. They reported 36 binding affinity measurements of these five mutants and the wild-type (WT) protein binding to the consensus DNA site GCG and its mutants GCA, GCC, GAG, GAA and GAC using a quantitative binding assay (39) (Supplementary Table 1 lists the relative binding affinities). DNA-binding site trinucleotides are numbered using the middle base as the reference point from 5′ to 3′ (e.g. 3′-G+1C0G−1-5′), and nucleotides in the complementary strand are denoted with a prime symbol in their subscript (e.g. C+1’).
Two completely independent affinity measurement datasets of FII mutants and human ZFs fused to FIII of EGR are from Segal et al. (15) and Bae et al. (19), respectively. Segal et al. (15) used phage display selection, randomizing FII α-helix positions −1, +1, +2, +3, +5 and +6 and reported affinity measurements of 23 FII mutants using mobility shift assays of the purified proteins. Bae et al. (19) utilized yeast one hybrid system to select ZF domains amplified from human genome fused to EGR instead of FIII and reported affinity measurements of 32 selected domains against the selected DNA binding sites.
Modeling ZF–DNA interactions
The affinity of the ZF to a specific DNA sequence D can be expressed in terms of the dissociation constant Kd:
| (1) |
where ΔG is the free energy of binding, R is the gas constant and T is temperature. Assuming everything else the same, the effects of point mutations on either the DNA or the ZF can be described as the ratio of the affinities of the mutant (Mut) complex and the reference state wild type (WT) complex
| (2) |
where
| (3) |
Decoding protein–DNA interactions
The basic assumption is that changes in the affinity of a complex due to mutations are uniquely determined by changes in specific contact energies and solvation factors between the different structures. Hence, the scheme to define the potentials is as follows.
Build homology models of mutant TF based on templates from known complex structures.
Perform molecular dynamics (MDs) simulations of the homology models in the absence of DNA in explicit solvent to readily identify strong intramolecular H-bonds.
Intermolecular H-bonds are established based on distance thresholds obtained from MD of mutants superimposed into the models of the complex. Then, all plausible intra- and intermolecular H-bond networks are built into the homology models of each complex.
- Effective free energies are assigned to all gained and lost H-bonds relative to a reference state, usually the WT complex: ϵij to residue specific intermolecular H-bonds, δi to atomic desolvation penalties of unmatched H-bond donors or acceptors at the binding interface and buried hydrophobic residues. These interactions are further modulated by a water factor λw that is applied depending on the number of water molecules contacting the H-bonds (see below Results section for more details). Thus, given a model, these assignments allow us to compute the change of binding free energy as:
where f (λw) = 1 (default), (1 − λw) (if residue k contacts extra waters) and 1/(1 − λw) (if k contacts less water than default).
(4) Then, using Equation (2) and ΔΔGCalc one can trivially relate biochemical binding data with structural models.
- Using Equation (4), minimize
for relevant mutants (Supplementary Figure 3), obtaining intermolecular interactions that best fit the available experimental data.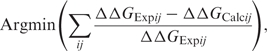
(5) Since we have more mutants than interactions, Equation (5) is only used as a measure of the quality of the predictions.
Binding modes
Structural insights from crystal structures of EGR (38) and four mutants (37) allow us to identify five binding modes for FI, resulting in specific amino acid–base H-bond patterns. Representative structures of these binding modes are shown in Figure 2. They are: (i) WT (default) mode from FI of EGR that allows Arg residues to form two H-bonds at Pos. −1 (PDB code: 1AAY) (38); (ii) Q mode from QGSR/GCA mutant (PDB code: 1A1H) shows that Q−1 can reach closer to the DNA forming a bond with A+1 if there is also a single matching bond at Pos. +3 (e.g. S+3–C0) (37); (iii) D mode from DSNR/GAC mutant (PDB code: 1A1F), which can reach even closer than Q mode if N+3 forms two H-bonds with A0. Furthermore, two H-bond configurations between R−1 and the DNA–bb phosphate has been resolved in two different structures (37); (iv) in the BB1 mode from RDER/GCA mutant (PDB code:1A1L), the R−1.NH2 group found on the surface (i.e. partially solvated) contacts the C0 phosphate group, while E+3 forms an intramolecular H-bond with the buried NH2; and (v) BB2 mode based on the mutant RADR/GCG (PDB code:1A1J), in which R−1 contacts the DNA–bb phosphate through the buried NH2 group, while the second NH2 is fully solvated. In this complex, D+3 prevents a full water attack of the R−1 side chain by forming an intramolecular H-bond with HE of R−1.
Figure 2.

Crystal structures of binding modes and induced fit on ZFs. (A) WT (RDER) EGR with GCG site (blue). (B) QGSR mutant with GCA site (yellow). (C) DSNR mutant with GAC site (pink). (D) WT with mutant GCA site (green). (E) RADR mutant with GCG site (purple). Hydrogen bonds between the side chains and the bases are showed as dashed lines. (F) Superimposition of the α-helices of the four modes after aligning DNA–bb's. Note that α-helices of Q and D modes are closer to DNA than WT mode.
It is important to emphasize that, as shown in Figure 2F, crystal structures suggest that ZFs do most of the induced fit upon complexation. This induced fit is in response to well defined H-bonding networks to DNA that become stronger upon ZF bending. Thus, predicted homology models are restricted to those that satisfy the H-bond complementarity observed in the aforementioned structures, and no new backbones are postulated for either protein or DNA. Indeed, DNA structures considered in our models are from DNA bound to ZFs or free DNA triplets from the PDB. The implicit assumption is that ZFs do not actively participate in deforming DNA. We note that the latter might not be true in general since deformation energies of DNA are thought to be important in binding [see e.g. (30,40,41)].
Protein and DNA homology models
Mutants of ZFs I, II and III are built using the corresponding finger structure in the EGR crystal structure [Figure 1; (38)]. DNA triplets are taken from crystals, i.e. PDB codes 1AAY (38), 1A1F (37), 1A1H (37), 1MEY (42), 1MDM (43), 1A1L/1A1J (37), 1MDY (44) and 2I13 (45), and to assure the continuity of the DNA chain the triplets are simply superimposed to the backbone of the appropriate binding mode.
Computation of waters at the protein–DNA interface
In order to have a rough estimate of the number of waters that fit at the binding interface, modeled ZF–DNA complexes are solvated in a box of 1.4 Å radius water molecules, removing waters that overlap with the protein and DNA. These waters are then compared with crystal waters in order to assess the likelihood for models to trap an excess of waters at the interface relative to WT.
MD simulations
MDs simulations of finger one of EGR TF and its mutants were performed using the MD simulation package GROMACS 3.3.1 (46) in the absence of DNA. Each individual finger was centered in a rhombic dodecahedron box with a 15 Å minimum distance from the protein surface to the box edges. The resulting system was solvated with simple point charge water molecules. Then, the systems were minimized by using steepest descent method with GROMOS96 (47) force field. Ions were added by replacing water molecules randomly to neutralize the system. The zinc ion and the zinc coordinating residues (two cysteines, two His) and backbone N and C atoms were harmonically constrained using a force constant of 2.4 kcal/mol/Å2. The temperature was coupled to a bath of 300 K with a coupling time constant of 0.1 ps. The pressure was coupled to 1 Bar using 0.5-ps time constant and 4.5 10−5 Bar−1 compressibility. The non-bonded interaction cut-off radius was 10 Å. Initial velocities were generated randomly from a Maxwell distribution at 300 K. Long runs of 9 ns were performed with a time step of 2 fs. Coordinates were saved every picosecond. After discarding the first nanoseconds, the last 8 ns of the trajectories are analyzed.
RESULTS
Intramolecular H-bonds
As described in the Methods section, we analyze 8 ns long MD simulations of FI and its mutants to sample the intramolecular H-bonds that are formed within each protein domain. Consistent with properties already observed in protein–protein interactions (48), the MDs reveal that key structural motifs observed in the co-crystals are also observed in the dynamics of individual fingers. For instance, a key feature is that side chains R+6 in FI, R−1 in FII, and R−1 in FIII that are found buried in the complex, already behave very much bound-like in the absence of DNA (data not shown). More interestingly, we find that the H-bond between the donor backbone N at Pos. −1 and acceptor side chain at Pos. +3 is quite stable for almost all protein sequences: WT, QDER, DDER, QDNR and RDNR for 97%, 89%, 62%, 40% and 24% (±5%) of the simulation time, respectively. On the other hand, repulsive interactions between Asp side chains forbid this bond in DDNR. Therefore, unless other constraints are present, this bond will not be allowed for this sequence. A strong sc–sc H-bond is observed between Asp at Pos. −1 and Asn at Pos. +3 in the double mutant DDNR (79% of the simulation time). Also, in QDNR, D at Pos. +2 is forming a bond with either Q−1 or N+3 for ∼42% each; and, in QDER, Q forms a bond with D+2 during 26% of the time. These bonds prove very important to validate possible intermolecular bonds in homology models.
Recognition code for intermolecular H-bonds
Using homology models of the different protein and DNA sequences, we search for all possible intermolecular H-bonds allowed for the appropriate binding mode in Figure 2. H-bonds are assumed to be formed if the distance between hydrogen and acceptor atom is ≤4 Å (see sample of distances for key contacts in Supplementary Figure 1). This distance is larger than that of a typical H-bond (1.8–3.0 Å), since it assumes a small 1 Å induced fit (or error) in our models.
The key observation here is that the superposition of tri-nucleotides in the DNA backbone imposes nontrivial distance constraints between protein and DNA molecules. For instance, in WT mode clashes prevent E+3 from forming a bond with the middle nucleotide and N+3 from reaching C0 in GCG/GCA. In addition, D−1 does not reach GCG/GCA but can reach GCC/GAC/GTA. These constraints, listed in Table 1, are at the core of the recognition rules for C2H2 ZF–DNA interactions. The list can be assumed to be incomplete, since one cannot rule out the existence of binding modes not yet revealed by crystallographic efforts. Nevertheless, it implements currently validated intermolecular H-bond networks. Finally, binding modes observed for EGR and its mutants only show intermolecular contacts between nucleotide bases and side chains at positions −1,+2,+3 and +6 of the α-helix; a limited number of possible DNA–bb contacts are also considered. Water mediated H-bonds are implicit in the desolvation penalties but otherwise neglected.
Table 1.
Look up table for amino acid–DNA H-bonds
| Pos. −1 | Pos. +3 | Pos. +6 | Mode | |
|---|---|---|---|---|
| G/A–C–X | R−1–G+1 | – | R/K+6–G−1 | WT |
| D−1–C+1 | – | R/K+6–G−1 | WT | |
| – | N+3–C0 | R/K+6–G−1 | WT | |
| Q/H−1–X+1 | D/N/S+3–C0 | R/K+6–G−1 | Q | |
| G/A–T–X | R−1–G+1 | – | R/K+6–G−1 | WT |
| H/Q/S/T−1–X+1 | S/T+3–T0 | R/K+6–G−1 | Q | |
| Q−1–A+1 | S/T+3–T0 | R+6–DNA–bb | Q | |
| G/A–A–X | R−1–G+1 | – | R/K+6–G−1 | WT |
| R−1–G+1 | N+3–A0 | R/K+6–G−1 | WT | |
| C/D/I/T/V−1–X+1 | N+3 = A0 | R/K+6–G−1 | D | |
| Q−1–X+1 | S/D/N+3–A0 | R/K+6–G−1 | Q | |
| Q−1–X+1 | S/D/N+3–A0 | – | Q | |
| G/A–G–X | Q/R−1–G+1 | H+3–G0 | R/K+6–G−1 | WT |
| Q/R−1–X+1 | H+3–G0 | – | WT |
Minimal set of protein–DNA interactions
The set of interactions capable of modeling the EGR mutants encompass a novel group of five H-bond categories, three atomic desolvation penalties, a hydrophobic desolvation energy and a water factor that accounts for water accessibility at the binding interface. Chemically similar H-bonds are assumed to scale according to the relative partial charge of the atoms involved, as established by the AMBER forcefield (49). The origin of each of these interactions is well founded on successful empirical free energies of protein–protein interactions (50,51), as well as in careful consideration of the modular interactions that characterize the classical C2H2 ZF–DNA complex. Thus, the 10 relevant interactions are given below.
Five hydrogen bond categories: (i) The bidentate H-bonds between Arg and Guanine, R = G, which is also assumed to be twice the strength of a single K–G H-bond, as well as that of any side chain H-bond to the backbone; (ii) the bidentate H-bonds Q = A, assumed to have the same strength as N = A, while the strength of individual H-bonds for these side chains are partitioned according to their partial charges; (iii) the S–C H-bond, used to extrapolate Ser, Thr and Cys H-bonds (e.g. S–T, T–T, T–C) and related interactions; (iv) the D–C H-bond, used to estimate all bonds involving Asp side chains. For instance, the strength of D–A is 0.97 × D–C, where the ratio of AMBER partial charges of donors of C and A is C.N4H/A.N6H = 0.42/0.43 = 0.97; and (v) the H–G bond that also determines all His H-bonds with other DNA bases.
Three atomic desolvation penalties (Figure 3A): Polar groups buried at the binding interface trigger costly desolvation penalties if their H-bonds are not properly matched. These desolvation penalties are: (vi) δOD for a free sc–oxygen at the binding interface or an unmatched sc-oxygen from Gln or Asn; (vii) δNH2 for unmatched NH2 side chain groups, and half this penalty δNH = δNH2/2 for unmatched NH side chain groups; and (viii) δHB for burying a sc–sc H-bond between any two interface residues at positions –1, 2, 3 or 6 leaving at least one oxygen unmatched. This penalty is different from atomic desolvations because of the extra entropy loss of trapping two side chains. It is also worth noting that unless solvated by crystal waters sc–sc H-bonds are highly penalized in protein–protein interfaces as well (52).
Hydrophobic desolvation: If a non-polar group is buried at the binding interface, an attractive (ix) desolvation energy δNP is assumed.
Water factor (Figure 3B): Water accessibility at the binding interface is modeled by a unique (x) water factor λw, corresponding to the fraction by which the transition state of H-bonds exposed to a few extra waters is decreased. Note that this factor only applies to partially solvated bonds, fully solvent exposed H-bonds do not contribute to the binding free energy at all. Hence, the strength of an H-bond exposed to extra waters is reduced to (1 − λw), whereas an H-bond that gets desolvated is strengthened by 1/(1 − λw). The same factor λw is used for all H-bonds, as well as for the desolvation penalties that are weakened in the presence of extra solvent.
Figure 3.

Sketches illustrating atom desolvation penalties and solvation effects at the protein (top)–DNA (bottom) binding interface. H-bonds are indicated as dashed lines and filled spheres correspond to water molecules. (A) From left to right, side chain oxygen (δO) and NH2 (δNH2) desolvation penalties arise when side chain atoms do not form a H-bond with protein or DNA. Intramolecular H-bond desolvation penalty (δHB) is assessed when oxygen groups are left unmatched. (B) Effect of solvation on the strength of intermolecular H-bonds. Default binding interface with ϵ as the effective H-bond strength (center). The cartoon also reflects the fact that bonds required a surface to lay on. Solvated binding interface (left). Competing water molecules are weakening the intermolecular H-bond by a factor of λw. Desolvated binding interface increases H-bond strength by a factor of 1/(1 − λw) (right).
Protein–DNA interaction code
Based on the intermolecular models for FI mutants in (17), the interaction code, listed in Table 2, is decoded using Equation (4). These interactions then determine the lowest free energy models for all mutants sketched in Figure 4 (Model prediction section). Namely:
Comparing the RDNR/GCG mutant with WT FI defines the strength of δNH2 as 0.95 kcal/mol, such that exp(δNH2/kT) matches the observed 5-fold drop in affinity.
The R = G bidentate H-bond is decoded from QDER/GCA as 2.66 kcal/mol matching the 90-fold decrease in affinity with respect to WT.
There are several models that trigger a δOD desolvation penalty. We chose DDER/GCA to quantify this bond, since MD shows that D+2 in DDER does not form bonds with other atoms, whereas H-bond interactions between Q−1 and D+2 in QDER are likely to affect the strength of the desolvation penalty. Of course, these subtle differences are not quantified here.
The Q–C and D–C bonds are now easily extracted from QDER/GCC and DDER/GCC, respectively. Moreover, the similar chemistry of Q and N side chains led us to assume that the bidentate bonds Q = A and N = A had the same strength.
The penalty for burying an H-bond is based on QDNR/GCC.
The water factor was defined by the RDER/GAG model (see below).
The S–C bond was decoded based on QGSR/GCA crystal structure (37) and affinity measurements of Kang (53). Based on the relative affinity of this mutant and the WT protein, ϵS–C = 0.93 kcal/mol. Similarly, based on partial charges, the ratio of the strength between S–A and S–C H-bonds is 0.93, resulting in ϵS–A = 0.87 kcal/mol. Threonine bonds with A/G/C are also extrapolated based on S–C.
The H–G bond was predicted based on FIII mutant RDHR/GGG, which differs in an additional H–G bond, the loss of a bb–phosphate contact at Pos. +1 and the removal of extra waters weakening one of the H-bonds between R+6 and G−1 by the stacking H–G bond. The relative affinity between these two sequences results in ϵH–G = 0.31 kcal/mol for H–G.
FIII includes unique mutants involving up to five different possible hydrophobic contacts, and two aromatic residues in the recognition helix. Here, we assume a single parameter δNP to describe the burying of a non-polar group at the binding interface. Comparing ISNR/GAT and QSNR/GAA in FIII, we predict δNP = −0.61 kcal/mol.
Finally, a reported mutation (19) in WT FIII of Lys to Asn at Pos. +5, leads to a 1.4-fold decrease in affinity with respect to WT, or a penalty of δN+ 5 = 0.2 kcal/mol. The origin of this penalty is not trivial since in the WT crystal Lys does not form an H-bond with DNA–bb, even though it is within striking distance. Consistency with our previous estimates suggests that this penalty might be related to a desolvation factor for side chain oxygens.
Table 2.
Effective H-bond potentials and desolvation penalties (kcal/mol)
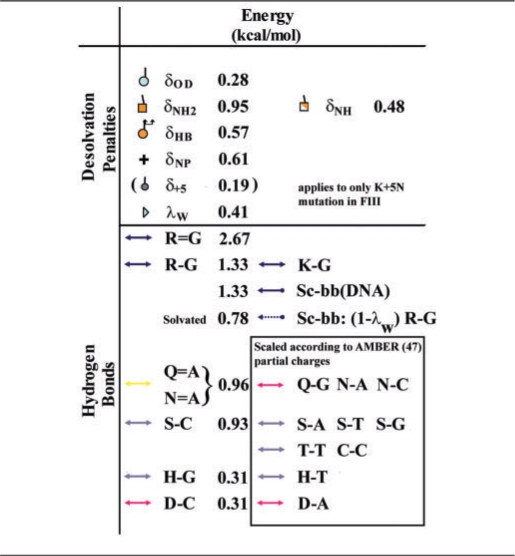 |
Error bars are the same as experiments in (17).
Figure 4.

Predicted complex structures for six EGR FI and six DNA-binding site sequences. Arrows indicate H-bonds, and dashed arrows denote H-bonds to backbone phosphates. Intramolecular H-bonds are indicated by black arrows/lines. Blue spheres show the desolvation penalties for side chain oxygens (δO). Orange spheres show the desolvation penalty for intramolecular H-bonds (δHB). Rectangles are the desolvation penalties for NH2 groups (δNH2). Filled/open triangles point to the interaction that is been solvated/desolvated at the binding interface. The numbers on the left of each model indicate the experimental (black) and predicted (red) change in affinity with respect to RDER/GCG WT structure shown in upper-left corner. Predictions can easily be reproduced by decoding interactions using Table 2 and Equation (4). All complexes are built on top of the WT FI crystal, unless shown inside a rectangle. Red/green/magenta rectangles denote those complexes whose homology models were superimposed to Q/BB1/BB2 binding modes, respectively.
It is important to emphasize that we read the values of these specific H-bond parameters and atom desolvation penalties directly from the experimental data points mentioned above without any fitting to the full dataset. Supplementary Figure 3 sketches the data points used to extract the parameters. As expected, the R = G bidentate H-bond results in the strongest protein–DNA interaction, followed by the N = A/Q = A, S–T, C–C, H–G and D–C. The dominant role found for (electrostatic) H-bonds is consistent with the full atom analysis of Oobatake et al. (14). A striking validation for these interactions is that an unconstrained minimization of FI models with arbitrary energies failed to improve the error function in Equation (5).
DNA structure and the role of water in additivity
From a biophysical point of view, the most important contribution of this work is the quantitative prediction of the water factor mediating protein interactions. This prediction was borne out of the detailed analysis of the middle cytosine (C0) mutation to adenine (A0) resulting in a 5′-GAG-3′ tri-nucleotide bound to WT RDER. Despite the apparent neutral character of this mutation, which should still result in the same intermolecular H-bonds as WT complex, the observed 6.4-fold decrease in affinity says otherwise. Careful analysis of the predicted model shows that the only difference between these structures is a larger cavity on the GAG mutant that accommodates at least two more water molecules in the binding interface of RDER next to the R−1 = G+1 bond between helix positions −1 and +3 (Figure 5). Consistent with the notion that water molecules weaken H-bonds, the extra water of partially solvated bonds are modeled by weakening the corresponding bond by a water factor λw = 0.41—e.g. R−1 = G+1 (extra waters) ≡ (1 − λw) × R−1 = G+1 (WT), leading to the experimental 6.4-fold decrease in affinity.
Figure 5.

Rearrangement of waters at the protein–DNA interface due to cytosine to adenine mutation. FI of EGR is shown in dark blue. Green ball and sticks show crystal GCG triplet. Mutated A0 is shown as pink ball and sticks. Cyan spheres are the waters at the interface found in the crystal of WT (GCG) complex. Pink spheres are modeled extra waters at the interface of EGR FI–GAG complex. Note the shift in the base due to C→A mutation allowing waters to fit in.
Further analysis of our models showed that any two purines at DNA positions −1 and 0 build a cavity, which might be filled by either protein or water. For instance, an H–G or N = A H-bonds at Pos. +3 or a sc–sc H-bond between D+2 and N+3 block the presence of extra waters (not shown). Although our modeling of water molecules is crude, the assumption that cavities large enough to fit water molecules will do so is well founded (54).
Assessing water factor in binding modes
Relative to WT, FI mutants DSNR/GAC (D mode), QGSR/GAC (Q mode) and RDER/GCA (BB1 mode) have been shown to be remarkably more stable than expected, i.e. −1.7, −1.9 and 0.4 kcal/mol, respectively (53). This extra stability is fully rationalized by the missing crystal waters observed relative to WT in Pabo's crystal structures (37). Specifically, a water molecule that sits below the R+6 = G−1 H-bonds in WT is not present in any of these mutants. Consistent with our water factor, the desolvation of the R+6 = G−1 bonds increases the strength of the bonds by 1/(1 − λw) to 4.54 kcal/mol. For BB1 the key water is instead coordinated between the C0 and A+1 bases, suggesting that nucleotides that disrupt these bonds should not be able to sequester this critical water away from the R = G H-bond. The latter is consistent with our prediction that RDER/GCC and RDNR/GCC do not enhance the R+6 = G−1 bond. Similarly, D and Q modes show that the middle bonds N+3.OD–A0 and S+3–C0, respectively, are also desolvated with respect to WT, triggering a 1/(1 − λw) bond enhancement as well. Hence, based on Table 2, we predict ΔΔGCalc = −2.05, −1.92 and 0.21 kcal/mol for D, Q and BB1 binding modes, respectively. Supplementary Figure 2 shows a diagram of models and affinities for 12 mutants, including these binding modes. Interestingly, the desolvated/enhanced bonds in Q mode are canceled out by the extra waters entailed by dinucleotide purine steps as in GAG. In summary, ‘we use λw as the only factor regulating the excess or decrease of waters trapped at the interface’.
Supplementary Figure 2 sketches H-bond networks and shows a direct comparison for the affinities between several FI binding modes. A point of caution is that different experimental conditions can lead to different affinities. Indeed, experiments on the same dataset by (53) and (55) resulted in some different binding free energies. We chose to compare against the more recent dataset in (53). It is important to point out that both of these experiments have a key mutation with respect to Liu and Stormo (17) that we predict it has a role on the solvation of the R−1–G+1.N7 H-bond. Specifically, beyond the GCG consensus sequence, (53) and (55) have nucleotides C+2A+3 compared with C+2T+3 in (17). Structural models suggest that A+3′ (complementary strand) protects the R−1–G+1 bond better than T+3′, preventing waters from clustering around the bond. The predicted models match well Pabo's crystal structures (37), with the exceptions of RADR/GCG and RADR/GAC [cases for which the experiments in (53) and (55) also do not agree, and crystals show relatively high B-factors for key sc]. For instance, in RADR/GCG, we predict the same binding mode as RADR/GCA or RDER/GCA, i.e. a desolvated R+6 = G−1 bond leading to a predicted energy of ΔΔGCalc = −1.4 kcal/mol compared with ΔΔGExp = −1.5 kcal/mol. The problem here is that the RADR/GCG crystal (37) does not show a desolvated R+6 H-bond. Arguably, differences in the crystallization and binding assay conditions might be responsible for this inconsistency. Otherwise, our code simply cannot reconcile this crystal with ΔΔGExp.
Model prediction for FI
Figure 4 shows the corresponding lowest free energy structures, binding affinities and binding modes predicted by the interactions in Table 2. If an H-bond is not formed, it is either farther apart than 4 Å, or lead to a higher energy. For instance, as expected, the widely reported conserved intramolecular interaction R−1 = D+2 (15,38,42,56) plays a critical role stabilizing the intermolecular R−1 = G+1 H-bond. From a physical point of view, D+2 protects R−1 from a water attack. This complementarity is enforced by the fact that if R−1 is not stabilized by D+2, then the unmatched HE hydrogen will trigger a δNH penalty. We note that R+6 is matched by a highly coordinated crystal water.
Most models come down to a straightforward optimal pairing of intermolecular bonds. Nevertheless, some observations are in order given below.
The strong intramolecular bonds suggested by MD are present in almost all the models. For instance, N or E at Pos. +3 often forms an intramolecular bond with the backbone at Pos. −1 as observed in the WT complex.
MDs also provide clues for the complementarity of the H-bond network. For example, in QDNR and DDNR, the side chain of D+2 and D−1, respectively, are the ones forming an H-bond with N+3. Also, D+2 can form an H-bond with C+1’ in some models but not others. For DDNR/GCG/GCA, MDs show that the strong repulsion between the negatively charged aspartic acids forbids D+2 from forming a bond with N+3 and, therefore, it cannot reach C+1’ as well. The only exceptions are DDNR/GAG/GAC, where the bond between N+3–A0 stabilizes the intramolecular bond between D+2 and N+3, and only then D+2 can reach C+1’/C+1. Finally, in DDER/GAC, D+2 can reach within 3 Å of C+1.
In QDER, D+2 samples two configurations: one where it is buried deep against A+3′ backbone, the other reaches to C+1’ in GCG. However, this configuration is even closer to the repulsive O6 group of G+2’, resulting in the desolvation penalty shown in the GCG complex. On the other hand, in GCA, while not reaching close enough to form a bond with A+1, it can stay pointing out towards the solvent through its interaction with Q−1, resulting in no desolvation penalty.
In QDER/GAG, Q makes a bond with G.O6 forcing OE to be pointing inwards. However, with the extra support of an N–A bond in QDNR/GAG, this mutant can further rearrange into the Q binding mode with Q forming a bond with G.N7. This bond now allows the free OE to rotate outwards to the solvent, canceling the OE desolvation penalty.
Hydrogen bonds to the DNA–bb would have been difficult to predict de novo. For FI, the BB1 and BB2 binding modes provide the necessary insight to unravel the contacts, e.g. one having the backbone bond partially solvated (BB1) while the other with normal strength (BB2).
Figure 6 shows the predicted binding free energies (ΔΔGCalc) of 35 mutants versus experimental relative affinities (ΔΔGExp) (17). The straight line represents the exact match, i.e. y = x. Figure 4 also highlights the different binding modes used for the different models, which are consistent with crystal contacts of available EGR-like structures. The agreement is quite remarkable considering that Figure 4 involves 15 different intermolecular H-bonds (not counting desolvation or intramolecular bonds), which here are modeled with only seven decoded energy terms. Interestingly, the largest deviations in the binding energy come from complexes whose desolvation penalties are difficult to assess. For instance, in DDNR/GCG/GCA/GCC complexes, the OD (δOD) desolvation penalty of D+2 is likely to be more solvated in GCA/GCC than in GCG, as also reflected by the relatively weaker affinity of the DDER/GCG mutant. Two subtle observations from the models are: first, the D–A bond in RDNR/GAA is protected from water behind the N–A bond; and second, the δHB penalty in Q-mode QDNR/GAA is forced by the close proximity of D and N, leaving no room to break this bond.
Figure 6.

Predicted ΔΔGCalc versus experimental ΔΔGExp changes in free energy due to protein and/or DNA mutations. ΔΔGs are computed using Equation (2). Solid line corresponds the y = x line. Since interaction code is predicted based on experiments, the same error bars apply to both.
Multiple complex models
Given the interactions listed in Table 1, Figure 4 depicts the bonds of the homology models with the lowest binding free energy. Alternative models were also considered (data not shown), but resulted in higher free energies. For example, for RDER/GCA, besides the BB1 binding mode, we also predicted a model where R−1 forms an intermolecular H-bond with A+1.N7, with D+2 matching R−1.HE and R−1.NH2 (as in WT) while forming a bond with A+1.N6. The relative affinity of this complex is predicted to be 4.7, higher than the one predicted in Figure 4. Interestingly, the crystal structure (37) also shows a second configuration similar to our model, but with an unusual clash of the hydrogens from R−1 and A+1.
Predicting changes in affinities due to mutations in FII and FIII
The binding modes and intermolecular H-bond networks resolved for FI are also assumed to apply to FII and FIII. One important caveat is that the distribution of water molecules and side chain distances to the DNA–bb are not the same. For FII and FIII, the crystal shows a significant number of extra waters at both Pos. +3 and Pos. +6. These waters weaken the bidentate R+6 = G−1 bonds, and the solvent exposed H-bond at Pos. +3 (unless either the bond involves a His residue with its ring structure protecting the H-bond from water, or there is a large aromatic ring next to the H-bond that blocks the waters). Indeed, the specificity role of R−1 and R+6 are somewhat reversed with respect to FI. This can be seen in the structure of FII, where as in FI Pos. +6, the R−1 = G+1 bonds are protected from a water attack by a highly coordinated (four bonds) group of crystal waters, preventing the solvation of these bonds. For FIII, G+1.O6 does not have this protection, and a purine sequence solvates the bond between R−1.NH2 and G+1.O6 but not the H-bond to G+1.N7. In Q or D binding mode, the resulting desolvation of the interface in FI (see modes in Supplementary Figure 2) translates into bringing only one of the R+6–G−1 bonds to normal strength (the second bond remains partially solvated), as well as desolvating/strengthening H-bonds to A.N/G.O6 or C.N/T.O4. Note that the latter is not desolvated either in FI because the solvent is on the solvent side of Pos. −1, or in a purine sequence that brings extra water next to Pos. −1.
For WT FII, T+6 in RDHT appears fully solvated in a cluster of at least 10 water molecules, hence, no desolvation penalty is assessed to this polar group. Similarly, homology models indicate that without an intermolecular H-bond between Pos. +3 and a base at Pos. 0, providing a contact area, an R+6 side chain will be surrounded by water molecules destabilizing any possible H-bond since repulsions with R−1 of FIII prevent close contacts to the other side of the pocket. If the middle bond is formed, then we estimate that R+6.HE is always matched by a water molecule [see e.g. HOH221 in FII and HOH226 in FIII of the WT crystal (38)]. Note in the WT FIII crystal (38), R+6–G−1 bonds are partially desolvated by A−2. Indeed, we predict that a sequence with either T/C−2 should destabilize this bond. Finally, MD simulations strongly suggest that R+6–G−1 is destabilized by two consecutive hydroxyl residues (Ser/Thr) at Pos. +2 and Pos.+3.
In what follows, we use the recognition code in Table 1 and interaction code in Table 2 to predict changes in affinities in two independent data sets of EGR mutants: 23 mutants of FII (15) and 32 human ZF domains swapped with FIII of EGR (19).
Comparison with affinity data from Segal et al. (15)
Figure 7 shows the predicted models for FII mutants. The recognition rules lead to a correlation coefficient of R2 = 0.96 of experimental versus calculated ΔΔG (Figure 8A). A strong support for our code is the good agreement obtained for complexes with stacking interactions. Complexes that break this symmetry are somewhat less reliable since it is difficult to fully appreciate the role of solvent. For instance, based on the distance constraints of our models, four K/R mutants at Pos. +1 and Pos. +5 are predicted to form partially solvated H-bonds with DNA phosphate groups of strength (1−λw) × R–G = 0.78 kcal/mol, while HE is expected to be fully solvated. Needless to say, there is no structural validation for these bonds. The above notwithstanding, given that the predicted models are based on ‘feasible minimum energy configurations’ the predicted ΔΔGs should be considered an upper bound on the experimental ΔΔGs.
Figure 7.
Predicted complex structures for FII mutants. Symbols are the same as in Figure 4 and Table 2. Homology models built on D binding mode are indicated by a yellow rectangle. WT is indicated in upper-left corner.
Figure 8.

Predicted ΔΔGCalc versus experimental ΔΔGExp changes in free energy due to protein and/or DNA mutations for (A) FII (15) and (B) FIII (19). As expected, minimum energy models typically resulted in an upper bound of ΔΔGExp, suggesting the possibility of yet more subtle models or solvent conditions for some sequences.
Comparison with affinity data from Bae et al. (19)
Many mutations on the human ZFs swapped with FIII in EGR do not interact directly with DNA and, therefore, are ignored despite the fact that they might have an indirect effect in affinity. We identified three sites whose mutations can change ΔΔG. These are Ala, Ser and Lys at Pos. −2, Pos. +1 and Pos. +5, respectively. Mutations of A−2 to a H-bond donor can form a DNA–bb bond; S+1 forms a H-bond with DNA–bb in WT, but K/R/H+1 side chain mutations are too long and are predicted to be fully solvated; and a K+5 mutation to N+5 has been experimentally shown to decrease the affinity of WT by 0.195 kcal/mol (19). Besides these unique bonds and already mentioned solvation caveats, the allowed intermolecular networks are the same as FII and FI.
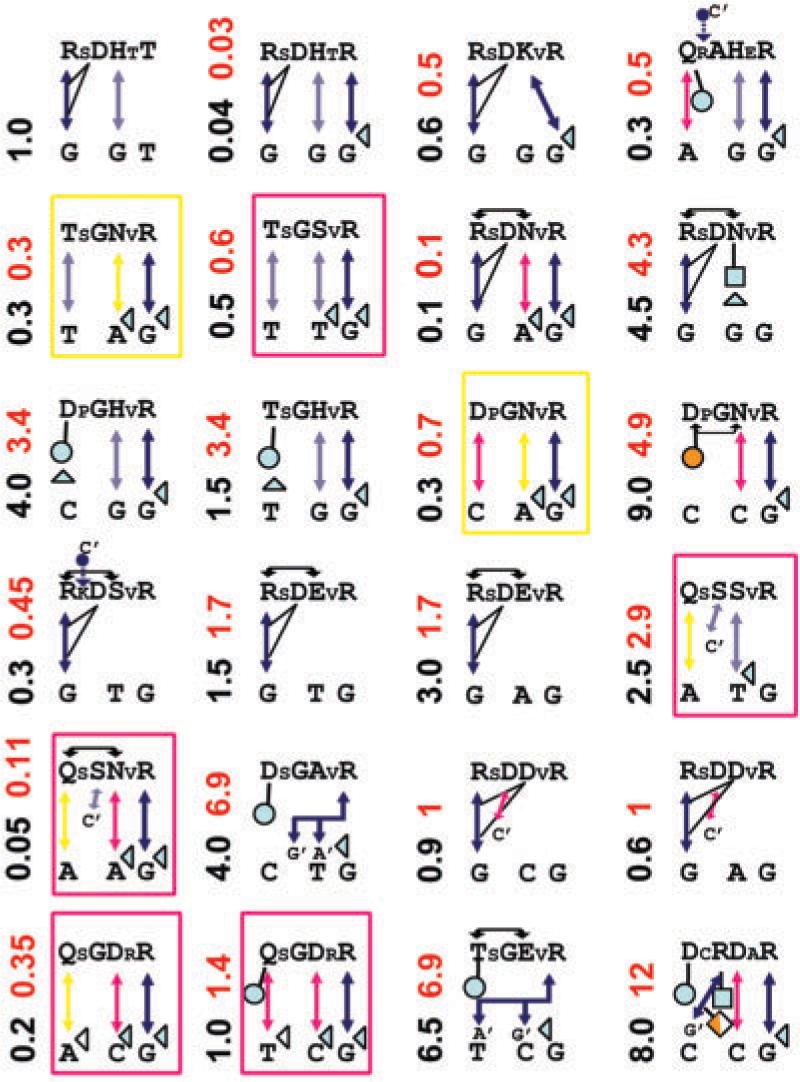
Figure 9 shows the predicted complexes for FIII proteins, resulting in R2 = 0.94 (Figure 8B). Predictions are similar to FII, with the caveat that FIII adds a new class of mutants involving hydrophobic and aromatic residues. We model this new bond with a single parameter, δNP, to account for non-polar buried residues (Table 2).
Figure 9.

Predicted complex structures for FIII experiments. Symbols are the same as in Figure 4 and Table 2. Plus signs show desolvation of hydrophobic groups (δNP). Purple spheres show the desolvation penalty for N+5 (δN+ 5). WT is in upper-left corner.
Comparing intermolecular networks across different fingers
The small structural differences between the three fingers are ignored. This allows us to apply the same models to all ZFs. The robustness of the recognition code to screen ZF interactions is then best portrayed by its consistency across ZFs. For example, RDNR/GAG has the same H-bond network in FI and FII, but the role of solvent is reversed between Pos. −1 and Pos. +6; all D modes (shown in a yellow box in Figures 7 and 9) have the same H-bond network but solvations are different—e.g. a mutation of S+2 to G and/or a purine sequence can cancel the desolvation of the bond at Pos. −1; all Q modes shown in a red box cancel the desolvation if G+2 is mutated to S+2; see also the similar networks between FII and FIII of RDHR/GGG, QAHR/GGA, QSNR/GAA, QSSR/GTA (in FIII it can reach a DNA–bb phosphate) and so on.
Limitations
The major shortcomings of the recognition rules described here are: (i) lack of an accurate tool to model molecular waters at the binding interface limits the application of the water factor in de novo H-bond networks; (ii) the interaction code is so far well matched to single point mutations of hydrophilic side chains from FI, but it is less clear whether a simple extrapolation of partial charges is well suited to capture the full contribution of side chains that also have non-polar groups on them. Specifically, a few side chains not present in the sequences studied so far, such as Met, Tyr and even Phe, Trp and Cys that only appear in a few human FIII, have yet to be fully cross-checked; (iii) the structural code applies only to ZFs that bind in the classical EGR mode. Hence, we do not address the problem of C2H2 ZFs that bind in non-classical modes [see e.g. (57)]; (iv) induced fit was assumed based on crystal information, but there is no proof that crystals have revealed every possible binding mode; (v) finally, it is worth mentioning that experimental assays depend on buffer conditions (ions), length of the DNA target, equilibration and so on (15,17,19,53,58). Hence, interaction energies might require some rescaling depending on experimental conditions.
DISCUSSION
Understanding the molecular basis and specificity of transcriptional regulation is one of the most important problems in molecular/structural biology. In combination with structural insights from the H-bond networks allowed by the primary sequence of C2H2 ZFs and DNA, we develop an experimentally based methodology to decode the strength of H-bonds and atomic desolvation free energies for protein–DNA interactions. We apply this code to a set of 89 mutants of FI, FII and FIII of EGR, predicting both bound structures and changes in binding affinities. Our results are in good agreement with experiments and known crystals, and compares well with known approaches.
Based on sequence alone, our approach decoded nine novel interactions and a water modulation factor. All the parameters are experimentally calibrated free energies in kilocalorie per mole. The excellent agreement with experiments strongly supports the basic assumptions of the interaction code. Namely: (i) short-range interactions (<4 Å) are dominant, suggesting that long-range electrostatics do not play an important role in protein–DNA specificity. Note that this is certainly not the case for non-specific interactions (59); (ii) desolvation of free polar side chain groups contributes negatively to the binding free energy, but rigid groups such as protein–bb or DNA do not. Crystals suggest that water molecules always patch free DNA H-bonds donors and acceptors; (iii) water screens both electrostatically attractive and repulsive desolvation interactions; finally (iv) our code does not require an explicit contact energy for water mediated H-bonds, suggesting that compared to direct H-bonds their contribution is rather weak.
‘Induced fit’ plays a critical role in resolving the recognition code. Our results indicate that binding of ZFs have a relatively larger impact on the protein side (Figure 2), more often in the context of at least three intermolecular bonds. One exception is the C0 base in FI DSNR/GCG, whose DNA configuration is clearly shifted by almost 1 Å relative to GCG in WT. This shift allows N3 to turn and form an H-bond with C0, something that is not possible in GCG/GCA WT sequences (Figure 4). For the mutants considered here, mostly single/double mutants, DNA deformation energies appear to be small in the context of the overall affinity, or they might cancel out when estimating ΔΔG. The above notwithstanding, the structure of DNA alone has a strong dependence on binding by simply regulating water accessibility.
Our analysis also reveals a novel decomposition of desolvation penalties. Besides atomic desolvation of acceptor (δOD) and donors (δNH2), we find that sc–sc H-bonds that do not match all acceptors carry an extra non-trivial penalty (δHB). This penalty is consistent with the extra side chain entropy loss entailed by such a bond (52). Finally, the water factor λw is a simple approximation that allows us, for the first time, to quantify the role of molecular water at the binding interface.
Finally, the simplicity of the interaction code motivated us to develop a diagrammatic scheme to represent C2H2 ZFs interactions with DNA. The scheme depicts physical interactions with symbols that allow a direct reading of the free energies. Hence, researchers not only can reproduce our changes in free energy estimates by subtracting the reference state (i.e. WT interactions), but they can also challenge, improve, disprove the resulting models for each complex.
Concluding remarks
Based on the crystal structures of EGR and mutation experiments, we decode 10 fundamental protein–DNA interactions. Applying this code to a set of 89 EGR mutants unveils detailed recognition rules for ZF–DNA complexes and their free energies relative to WT. Some of the rules depend on nucleotides that are +2 nucleotides away from the traditional tri-nucleotide consensus sequence, suggesting that there is still much to be accomplished before revealing all possible protein–DNA interaction networks. Nevertheless, our methodological approach of predicting energies based on ‘realistic structural models’ significantly limit the number of false positives, leaving the door open to further structural refinements. One cannot stress enough the valuable insights that detailed crystallographic studies and careful experiments provided here, which in combination with molecular modeling resulted in a novel rational approach to decode the recognition code of protein–DNA interactions.
SUPPLEMENTARY DATA
Supplementary Data is available at NAR Online.
FUNDING
National Science Foundation MCB-0744077. Funding for open access charge: National Science Foundation MCB-0744077.
Conflict of interest statement. None declared.
Supplementary Material
REFERENCES
- 1.Bulyk M. Computational prediction of transcription-factor binding site locations. Gen. Biol. 2003;5:201. doi: 10.1186/gb-2003-5-1-201. [DOI] [PMC free article] [PubMed] [Google Scholar]
- 2.GuhaThakurta D. Computational identification of transcriptional regulatory elements in DNA sequence. Nucleic Acids Res. 2006;34:3585–3598. doi: 10.1093/nar/gkl372. [DOI] [PMC free article] [PubMed] [Google Scholar]
- 3.Siggia ED. Computational methods for transcriptional regulation. Curr. Opin. Genet. Dev. 2005;15:214–221. doi: 10.1016/j.gde.2005.02.004. [DOI] [PubMed] [Google Scholar]
- 4.Ladomery M, Dellaire G. Multifunctional zinc finger proteins in development and disease. Ann. Hum. Genet. 2002;66:331–342. doi: 10.1017/S0003480002001215. [DOI] [PubMed] [Google Scholar]
- 5.Benos PV, Lapedes AS, Stormo GD. Probabilistic code for DNA recognition by proteins of the EGR family. J. Mol. Biol. 2002;323:701–727. doi: 10.1016/s0022-2836(02)00917-8. [DOI] [PubMed] [Google Scholar]
- 6.Bulyk ML, Johnson PLF, Church GM. Nucleotides of transcription factor binding sites exert interdependent effects on the binding affinities of transcription factors. Nucleic Acids Res. 2002;30:1255–1261. doi: 10.1093/nar/30.5.1255. [DOI] [PMC free article] [PubMed] [Google Scholar]
- 7.Liu X, Noll DM, Lieb JD, Clarke ND. DIP-chip: rapid and accurate determination of DNA-binding specificity. Genome Res. 2005;15:421–427. doi: 10.1101/gr.3256505. [DOI] [PMC free article] [PubMed] [Google Scholar]
- 8.Liu Q, Segal DJ, Ghiara JB, Barbas CF., III Design of polydactyl zinc-finger proteins for unique addressing within complex genomes. Proc. Natl Acad. Sci. USA. 1997;94:5525–5530. doi: 10.1073/pnas.94.11.5525. [DOI] [PMC free article] [PubMed] [Google Scholar]
- 9.Cho SY, Chung M, Park M, Park S, Lee YS. ZIFIBI: Prediction of DNA binding sites for zinc finger proteins. Biochem. Biophys. Res. Commun. 2008;369:845–848. doi: 10.1016/j.bbrc.2008.02.106. [DOI] [PubMed] [Google Scholar]
- 10.Kaplan T, Friedman N, Margalit H. Ab initio prediction of transcription factor targets using structural knowledge. PLoS Comput. Biol. 2005;1:e1. doi: 10.1371/journal.pcbi.0010001. [DOI] [PMC free article] [PubMed] [Google Scholar]
- 11.Liu J, Stormo GD. Context-dependent DNA recognition code for C2H2 zinc-finger transcription factors. Bioinformatics. 2008;24:1850–1857. doi: 10.1093/bioinformatics/btn331. [DOI] [PMC free article] [PubMed] [Google Scholar]
- 12.Morozov AV, Havranek JJ, Baker D, Siggia ED. Protein-DNA binding specificity predictions with structural models. Nucleic Acids Res. 2005;33:5781–5798. doi: 10.1093/nar/gki875. [DOI] [PMC free article] [PubMed] [Google Scholar]
- 13.Paillard G, Deremble C, Lavery R. Looking into DNA recognition: zinc finger binding specificity. Nucleic Acids Res. 2004;32:6673–6682. doi: 10.1093/nar/gkh1003. [DOI] [PMC free article] [PubMed] [Google Scholar]
- 14.Oobatake M, Kono H, Wang Y, Sarai A. Anatomy of specific interactions between lambda repressor and operator DNA. Proteins. 2003;53:33–43. doi: 10.1002/prot.10438. [DOI] [PubMed] [Google Scholar]
- 15.Segal DJ, Dreier B, Beerli RR, Barbas CF., III Toward controlling gene expression at will: Selection and design of zinc finger domains recognizing each of the 5′-GNN-3′ DNA target sequences. PNAS. 1999;96:2758–2763. doi: 10.1073/pnas.96.6.2758. [DOI] [PMC free article] [PubMed] [Google Scholar]
- 16.Pabo CO, Peisach E, Grant RA. Design and selection of novel Cys(2)His(2) zinc finger proteins. Annu. Rev. Biochem. 2001;70:313–340. doi: 10.1146/annurev.biochem.70.1.313. [DOI] [PubMed] [Google Scholar]
- 17.Liu JJ, Stormo GD. Quantitative analysis of EGR proteins binding to DNA: assessing additivity in both the binding site and the protein. BMC Bioinformatics. 2005;6:176. doi: 10.1186/1471-2105-6-176. [DOI] [PMC free article] [PubMed] [Google Scholar]
- 18.Bulyk ML, Gentalen E, Lockhart DJ, Church GM. Quantifying DNA-protein interactions by double-stranded DNA arrays. Nat. Biotechnol. 1999;17:573–577. doi: 10.1038/9878. [DOI] [PubMed] [Google Scholar]
- 19.Bae KH, Do Kwon Y, Shin HC, Hwang MS, Ryu EH, Park KS, Yang HY, Lee, Lee Y, Park J, et al. Human zinc fingers as building blocks in the construction of artificial transcription factors. Nat. Biotechol. 2003;21:275–280. doi: 10.1038/nbt796. [DOI] [PubMed] [Google Scholar]
- 20.Stormo GD. DNA binding sites: representation and discovery. Bioinformatics. 2000;16:16–23. doi: 10.1093/bioinformatics/16.1.16. [DOI] [PubMed] [Google Scholar]
- 21.Bussemaker HJ, Foat BC, Ward LD. Predictive modeling of genome-wide mrna expression: from modules to molecules. Annu. Rev. Biophys. Biomol. Struct. 2007;36:329–347. doi: 10.1146/annurev.biophys.36.040306.132725. [DOI] [PubMed] [Google Scholar]
- 22.Mandel-Gutfreund Y, Schueler O, Margalit H. Comprehensive analysis of hydrogen bonds in regulatory protein DNA-complexes: in search of common principles. J. Mol. Biol. 1995;253:370–382. doi: 10.1006/jmbi.1995.0559. [DOI] [PubMed] [Google Scholar]
- 23.Mandel-Gutfreund Y, Margalit H. Quantitative parameters for amino acid-base interaction: implications for prediction of protein-DNA binding sites. Nucleic Acids Res. 1998;26:2306–2312. doi: 10.1093/nar/26.10.2306. [DOI] [PMC free article] [PubMed] [Google Scholar]
- 24.Kono H, Sarai A. Structure-based prediction of DNA target sites by regulatory proteins. Proteins. 1999;35:114–131. [PubMed] [Google Scholar]
- 25.Selvaraj S, Kono H, Sarai A. Specificity of protein-DNA recognition revealed by structure-based potentials: symmetric/asymmetric and cognate/non-cognate binding. J. Mol. Biol. 2002;322:907–915. doi: 10.1016/s0022-2836(02)00846-x. [DOI] [PubMed] [Google Scholar]
- 26.Roven C, Bussemaker HJ. REDUCE: An online tool for inferring cis-regulatory elements and transcriptional module activities from microarray data. Nucleic Acids Res. 2003;31:3487–3490. doi: 10.1093/nar/gkg630. [DOI] [PMC free article] [PubMed] [Google Scholar]
- 27.Endres RG, Schulthess TC, Wingreen NS. Toward an atomistic model for predicting transcription-factor binding sites. Prot. Struct. Funct. Bioinform. 2004;57:262–268. doi: 10.1002/prot.20199. [DOI] [PubMed] [Google Scholar]
- 28.Havranek JJ, Duarte CM, Baker D. A simple physical model for the prediction and design of protein-DNA interactions. J. Mol. Biol. 2004;344:59–70. doi: 10.1016/j.jmb.2004.09.029. [DOI] [PubMed] [Google Scholar]
- 29.Man TK, Yang JSW, Stormo GD. Quantitative modeling of DNA-protein interactions: effects of amino acid substitutions on binding specificity of the Mnt repressor. Nucleic Acids Res. 2004;32:4026–4032. doi: 10.1093/nar/gkh729. [DOI] [PMC free article] [PubMed] [Google Scholar]
- 30.Gromiha MM, Siebers JG, Selvaraj S, Kono H, Sarai A. Role of inter and intramolecular interactions in protein-DNA recognition. Gene. 2005;364:108–113. doi: 10.1016/j.gene.2005.07.022. [DOI] [PubMed] [Google Scholar]
- 31.Liu ZJ, Mao FL, Guo JT, Yan B, Wang P, Qu YX, Xu Y. Quantitative evaluation of protein-DNA interactions using an optimized knowledge-based potential. Nucleic Acids Res. 2005;33:546–558. doi: 10.1093/nar/gki204. [DOI] [PMC free article] [PubMed] [Google Scholar]
- 32.Zhang C, Liu S, Zhu Q, Zhou Y. A knowledge-based energy function for protein-ligand, protein-protein, and protein-DNA complexes. J. Med. Chem. 2005;48:2325–2335. doi: 10.1021/jm049314d. [DOI] [PubMed] [Google Scholar]
- 33.Siggers TW, Honig B. Structure-based prediction of C2H2 zinc-finger binding specificity: sensitivity to docking geometry. Nucleic Acids Res. 2007;35:1085–1097. doi: 10.1093/nar/gkl1155. [DOI] [PMC free article] [PubMed] [Google Scholar]
- 34.Contreras-Moreira B, Collado-Vides J. Comparative footprinting of DNA-binding proteins. Bioinformatics. 2006;22:e74–e80. doi: 10.1093/bioinformatics/btl215. [DOI] [PubMed] [Google Scholar]
- 35.Benos PV, Bulyk ML, Stormo GD. Additivity in protein-DNA interactions: how good an approximation is it? Nucleic Acids Res. 2002;30:4442–4451. doi: 10.1093/nar/gkf578. [DOI] [PMC free article] [PubMed] [Google Scholar]
- 36.O’Flanagan RA, Paillard G, Lavery R, Sengupta AM. Non-additivity in protein-DNA binding. Bioinformatics. 2005;21:2254–2263. doi: 10.1093/bioinformatics/bti361. [DOI] [PubMed] [Google Scholar]
- 37.Elrod-Erickson M, Benson TE, Pabo CO. High-resolution structures of variant Zif268-DNA complexes: implications for understanding zinc finger DNA recognition. Structure Fold. Des. 1998;6:451–464. doi: 10.1016/s0969-2126(98)00047-1. [DOI] [PubMed] [Google Scholar]
- 38.ElrodErickson M, Rould MA, Nekludova L, Pabo CO. Zif268 protein-DNA complex refined at 1.6 angstrom: a model system for understanding zinc finger-DNA interactions. Structure. 1996;4:1171–1180. doi: 10.1016/s0969-2126(96)00125-6. [DOI] [PubMed] [Google Scholar]
- 39.Man TK, Stormo GD. Non-independence of Mnt repressor-operator interaction determined by a new quantitative multiple fluorescence relative affinity (QuMFRA) assay. Nucleic Acids Res. 2001;29:2471–2478. doi: 10.1093/nar/29.12.2471. [DOI] [PMC free article] [PubMed] [Google Scholar]
- 40.Olson WK, Gorin AA, Lu XJ, Hock LM, Zhurkin VB. DNA sequence-dependent deformability deduced from protein. Proc. Natl Acad. Sci. US A. 1998;95:11163–11168. doi: 10.1073/pnas.95.19.11163. [DOI] [PMC free article] [PubMed] [Google Scholar]
- 41.Sarai A, Kono H. Protein-DNA recognition patterns and predictions. Annu. Rev. Biophys. Biomol. Struct. 2005;34:379–398. doi: 10.1146/annurev.biophys.34.040204.144537. [DOI] [PubMed] [Google Scholar]
- 42.Kim CA, Berg JM. A 2.2 A resolution crystal structure of a designed zinc finger protein bound to DNA. Nat. Struct. Biol. 1996;3:940–945. doi: 10.1038/nsb1196-940. [DOI] [PubMed] [Google Scholar]
- 43.Garvie CW, Pufall MA, Graves BJ, Wolberger C. Structural analysis of the autoinhibition of Ets-1 and its role in protein partnerships. J. Biol. Chem. 2002;277:45529–45536. doi: 10.1074/jbc.M206327200. [DOI] [PubMed] [Google Scholar]
- 44.Ma PCM, Rould MA, Weintraub H, Pabo CO. Crystal structure of MyoD bHLH domain-DNA complex: perspectives on DNA recognition and implications for transcriptional activation. Cell. 1994;77:451–459. doi: 10.1016/0092-8674(94)90159-7. [DOI] [PubMed] [Google Scholar]
- 45.Segal DJ, Crotty JW, Bhakta MS, Barbas CF, Horton NC. Structure of Aart, a designed six-finger zinc finger peptide, bound to DNA. J. Mol. Biol. 2006;363:405–421. doi: 10.1016/j.jmb.2006.08.016. [DOI] [PubMed] [Google Scholar]
- 46.Van der Spoel D, Lindahl E, Hess B, Groenhof G, Mark AE, Berendsen HJC. GROMACS: Fast, flexible, and free. J. Comput. Chem. 2005;26:1701–1718. doi: 10.1002/jcc.20291. [DOI] [PubMed] [Google Scholar]
- 47.Scott WRP, Hunenberger PH, Tironi IG, Mark AE, Billeter SR, Fennen J, Torda AE, Huber T, Kruger P, van Gunsteren WF. The GROMOS biomolecular simulation program package. J. Phys. Chem. A. 1999;103:3596–3607. [Google Scholar]
- 48.Rajamani D, Thiel S, Vajda S, Camacho CJ. Anchor residues in protein-protein interactions. PNAS. 2004;101:11287–11292. doi: 10.1073/pnas.0401942101. [DOI] [PMC free article] [PubMed] [Google Scholar]
- 49.Cornell WD, Cieplak P, Bayly CI, Gould IR, Merz KM, Ferguson DM, Spellmeyer DC, Fox T, Caldwell JW, Kollman PA. A 2Nd generation force-field for the simulation of proteins, nucleic-acids, and organic-molecules. J. Am. Chem. Soc. 1995;117:5179–5197. [Google Scholar]
- 50.Davis IW, Baker D. RosettaLigand docking with full ligand and receptor flexibility. J. Mol. Biol. 2009;385:381–392. doi: 10.1016/j.jmb.2008.11.010. [DOI] [PubMed] [Google Scholar]
- 51.Lazaridis T, Karplus M. Effective energy functions for protein structure prediction. Curr. Opin. Struct. Biol. 2000;10:139–145. doi: 10.1016/s0959-440x(00)00063-4. [DOI] [PubMed] [Google Scholar]
- 52.Bueno M, Camacho CJ. Acidic groups docked to well defined wetted pockets at the core of the binding interface: a tale of scoring and missing protein interactions in CAPRI. Proteins. 2007;69:786–792. doi: 10.1002/prot.21722. [DOI] [PubMed] [Google Scholar]
- 53.Kang JS. Correlation between functional and binding activities of designer zinc-finger proteins. Biochem. J. 2007;403:177–182. doi: 10.1042/BJ20061644. [DOI] [PMC free article] [PubMed] [Google Scholar]
- 54.Ernst JA, Clubb RT, Zhou HX, Gronenborn AM, Clore GM. Demonstration of Positionally Disordered Water Within A Protein Hydrophobic Cavity by Nmr. Science. 1995;267:1813–1817. doi: 10.1126/science.7892604. [DOI] [PubMed] [Google Scholar]
- 55.Rebar EJ, Pabo CO. Zinc-finger phage – affinity selection of fingers with new DNA-binding specificities. Science. 1994;263:671–673. doi: 10.1126/science.8303274. [DOI] [PubMed] [Google Scholar]
- 56.Fairall L, Schwabe JW, Chapman L, Finch JT, Rhodes D. The crystal structure of a two zinc-finger peptide reveals an extension to the rules for zinc-finger/DNA recognition. Nature. 1993;366:483–487. doi: 10.1038/366483a0. [DOI] [PubMed] [Google Scholar]
- 57.Pabo CO, Nekludova L. Geometric analysis and comparison of protein-DNA interfaces: why is there no simple code for recognition? J. Mol. Biol. 2000;301:597–624. doi: 10.1006/jmbi.2000.3918. [DOI] [PubMed] [Google Scholar]
- 58.Hamilton TB, Borel F, Romaniuk PJ. Comparison of the DNA binding characteristics of the related zinc finger proteins WT1 and EGR1. Biochemistry. 1998;37:2051–2058. doi: 10.1021/bi9717993. [DOI] [PubMed] [Google Scholar]
- 59.von Hippel PH. From simple DNA-protein interactions to the macromolecular machines of gene expression. Ann. Rev. Biophys Biomol. Struct. 2007;36:79–105. doi: 10.1146/annurev.biophys.34.040204.144521. [DOI] [PMC free article] [PubMed] [Google Scholar]
Associated Data
This section collects any data citations, data availability statements, or supplementary materials included in this article.