

Abstract
Restriction endonucleases are used prevalently in recombinant DNA technology because they bind so stably to a specific target sequence and, in the presence of cofactors, cleave double-helical DNA specifically at a target sequence at a high rate. Using synthetic nanopores along with molecular dynamics (MD), we have analyzed with atomic resolution how a prototypical restriction endonuclease, EcoRI, binds to the DNA target sequence—GAATTC—in the absence of a Mg2+ ion cofactor. We have previously shown that there is a voltage threshold for permeation of DNA bound to restriction enzymes through a nanopore that is associated with a nanonewton force required to rupture the complex. By introducing mutations in the DNA, we now show that this threshold depends on the recognition sequence and scales linearly with the dissociation energy, independent of the pore geometry. To predict the effect of mutation in a base pair on the free energy of dissociation, MD is used to qualitatively rank the stability of bonds in the EcoRI–DNA complex. We find that the second base in the target sequence exhibits the strongest binding to the protein, followed by the third and first bases, with even the flanking sequence affecting the binding, corroborating our experiments.
INTRODUCTION
Proteins that bind to specific target sequences in DNA are vital to biology—they affect restriction, repair, transcription and packaging of DNA in a living cell, for example. The restriction endonuclease EcoRI has warranted special attention because the binding to DNA and subsequent cleavage is so extraordinarily sequence specific. In physiological salt conditions, the ratio of specific to non-specific binding is 109 and a change in a single base of the target sequence can lower the cleavage probability more than a million-fold (1–4). And yet, when specifically bound, the complex is very stable with an equilibrium dissociation constant of 400 pM (5,6). EcoRI is a type II restriction endonuclease with a palindromic target site on DNA—GAATTC—that it binds to as a dimer. It cleaves foreign DNA in an E. coli host in the presence of a Mg2+ ion cofactor. Like other enzymes that specifically recognize DNA, EcoRI finds the cognate site through a three-step process: non-specific binding to the DNA, linear diffusion along the strand until it encounters the target site and then binding to the target site, accompanied by a large conformation change (1,2). Molecular and Brownian dynamics have been used to analyze the underlying mechanisms responsible for the stability and high specificity of complexes such as EcoRI–DNA (7–10). Ostensibly, the sequence specificity in EcoRI develops from hydrogen bonds between the purines and protein, and contacts between protein, the pyrimidines and the DNA backbone.
Methods such as filter binding, surface plasmon resonance and calorimetric assays have been used to infer the equilibrium constants associated with protein–DNA interactions (4), but they all suffer from similar limitations. First, they are bulk measurements that report ensemble-averaged results, ignoring short-lived variants, etc. And second, the measurement of binding energy is indirect, e.g. in calorimetry, the heat measured is assumed to be linearly proportional to the binding energy. To circumvent these shortcomings, we have explored the feasibility of using the force associated with the electric field in a synthetic nanopore in a nanometer-thick membrane to dissociate EcoRI–DNA complexes trapped with the DNA threading that pore, as illustrated in Figure 1. A nanometer-diameter pore offers the capability to apply forces over a segment of a single molecule, comparable to the size of a protein-binding site (3–10 nm). Moreover, similar to other work (11–15), force spectroscopy on a single molecular complex (SMFS) in a nanopore could, in principle, be used to assess the sequence preferences and, at the same time, to reveal variants that are short lived or due to a peculiar conformation. The electric field in the pore pulls on the polyanionic DNA, but translocation across the membrane is arrested because the complex is larger than the pore diameter. By increasing the electric field, the pore can be used to introduce a shear force between the protein and the cognate sites in DNA large enough to rupture the bond. In prior work, we have shown that there is a voltage threshold U for the permeation of DNA bound to restriction enzymes through a nanopore. This threshold is associated with a nanonewton force required to rupture the DNA–protein complex and depends on the enzyme (16).
Figure 1.
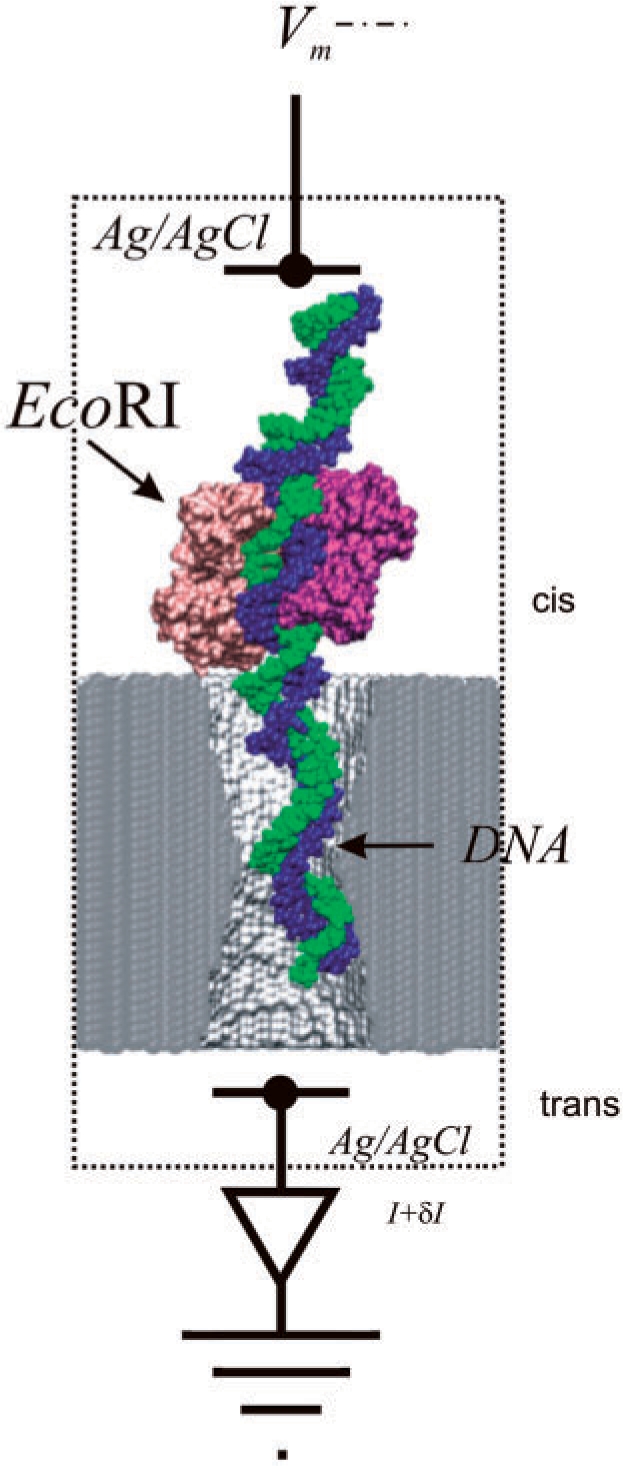
A synthetic nanopore that functions like a molecular tweezers for the detection of base-pair mutations. The figure shows an EcoRI–dsDNA complex trapped in a >2.5 nm diameter pore in a membrane formed from silicon nitride. The voltage Vm drives the molecule through the pore, shearing the protein from the dsDNA. The molecular configuration may be probed by measurements of the current I and the transient response δI.
In this report, we use synthetic nanopores along with molecular dynamics (MD) to analyze with atomic resolution how EcoRI binds to the DNA target sequence—GAATTC—in the absence of a Mg2+ ion cofactor. We have measured the number of DNA copies that translocate through the pore using qPCR (quantitative polymerase chain reaction) and confirmed prior measurements that indicate that there is voltage threshold for the permeation of DNA bound to a restriction enzyme through the nanopore (16). By introducing mutations in the DNA, we show that this threshold depends sensitively on the recognition sequence and scales linearly with the dissociation energy but is relatively insensitive to the pore diameter (2.5–4.7 nm) in the range of these experiments. In particular, we find that single base-pair (bp) substitutions in the recognition site for the restriction endonuclease can easily be detected as changes in the translocation threshold. MD simulations are used to delineate the effect of mutation in a base pair on the free energy of the dissociation of the complex, as well as qualitatively rank the stability of bonds in the EcoRI–DNA complex. The results indicate that synthetic nanopores could be utilized to detect single nucleotide polymorphisms (SNPs) in sequences of the human genome, including polymorphic sites.
EXPERIMENTAL METHODS
The fabrication and characterization of nanometer-diameter pores sputtered in Si3N4 membranes have been described elsewhere (17). Figure 2a shows transmission electron micrographs (TEM) of three pores in nitride membranes, nominally 10 nm thick, used in this work. The pores are 3.4 × 4.7 ± 0.2 nm (black); 2.6 × 3.0 ± 0.2 nm (blue) and 2.5 ± 0.2 nm (red) in diameter—the shot noise observed in the area identified as the pore is indicative of perfect transmission of the electron beam. The thickness of similarly processed 10 nm membranes was inferred from TEM to be 12 ± 2 nm, which is consistent with results 12 ± 3 nm obtained using electron energy loss spectroscopy. After sputtering a pore through it, the membrane was mounted using silicone O-ring seals in a membrane transport bi-cell made from acrylic. Each reservoir contained an Ag/AgCl electrode that was connected to an Axopatch 200B amplifier used in a resistive feedback mode. All data are low-pass filtered at 10 kHz and digitized at 20 kHz. The current–voltage (I–V) characteristics were measured over a range of ±1 V in microfiltered buffered 1 M KCl (10 mM Tris, pH 8.0) after >55 h of immersion in de-ionized water. The I–V characteristics shown in Figure 2a are approximately linear—line fits to the data yield the conductances: 21.2 ± 0.3 nS for the 3.4 × 4.7 nm pore (black), 9.19 ± 0.03 nS for the 2.6 × 3.0 nm pore (blue) and 3.85 ± 0.03 nS for the 2.5 nm pore (green) (17).
Figure 2.

Characterization of synthetic nanopores. (a) TEM micrographs taken at a tilt angle of 0° of three nanopores: 2.5 nm (red), 2.6 × 3.0 nm (blue) and 3.4 × 4.7 nm (black) diameter, sputtered with a tightly focused high-energy electron beam in nominally 10 nm thick Si3N4 membranes. (b) I–V characteristics of the nanopores shown in (a) taken in 1 M KCl, 10 mM Tris, pH 8.0 solution. Line fits yield conductances of 3.85 ± 0.03 nS for the 2.5 nm pore (red), 9.19 ± 0.03 nS for the 2.6 × 3.0 nm pore (blue) and 21.2 ± 0.3 nS for the 3.4 × 4.7 nm pore (black). (c) The electrolytic current through the 2.6 × 3.0 nm pore as a function of time with the membrane voltage at V = 0.75 V in a 100 mM KCl EcoRI–DNA solution. The open pore current (dashed line) at this voltage is ∼0.9 nA. The current transients are associated with EcoRI–DNA interacting with the pore.
Next, we tested the electric field-driven permeability of double-stranded DNA (dsDNA) in solution with EcoRI, using qPCR to measure the number of DNA copies that translocate through a nanopore as a function of the applied voltage (18). The sequence for the 105 bp dsDNA is given in the supporting information. The reference 105 bp dsDNA was extracted from the pUC19 (NEB part no. N3041S) vector. The DNA used for the 105 bp single-base substitutions was synthesized by IDT Technologies (Ames, IA) and PAGE purified.
Commercial grade EcoRI (100 000 U/ml stock concentration, 62 kDa dimer, 2 × 10⁶ U/mg specific activity) was purchased from New England Biolabs (part # R0101Q) and used without further purification. A degassed solution of microfiltered 100 mM KCl, 10 mM Tris, pH 8.0, was used as the buffer. A volume of 40 μl of EcoRI stock solution, which contains EDTA at a 1 mM concentration, was mixed into 400 μl of the buffer containing a DNA concentration of ∼107/μl, corresponding to a ratio of ∼4600 EcoRI dimers to every DNA, and incubated at 37°C for 10 h prior to translocation; this ensures the DNA has been bound by the EcoRI. The DNA concentration was estimated based on an agarose gel quantitative ladder. The Mg2+ ion, which is required for catalytic activity of the restriction endonucleases, was intentionally not added to the buffer. The solution injected into the cis-reservoir of the bi-cell showed pH 7.9, and each translocation was run for a period of 4 h with a specified voltage. After each run, the solution at the anode was collected, concentrated with an Amicon Ultra-4 centrifugal filter (Millipore, Bedford, MA), and then the buffer was exchanged to water on the same filter. The corresponding retentate was analyzed using qPCR by an Applied Biosystems 9700. The details of the protocols for qPCR analysis are given in the supplement.
MOLECULAR DYNAMICS METHODS
A microscopic model of restriction enzyme EcoRI bound to a fragment of dsDNA was built using the X-ray structure of the complex (PDB code 1CKQ, resolution: 0.185 nm). The fragment of DNA resolved in the X-ray structure was extended to 5′-TCGGTA CCCGG CGC GAATTCGCG TAGAG TCGACC-3′ by appending 11 base pairs at each end of the resolved fragment. In the above sequence, the cognate sequence is shown in bold, and the fragment resolved in the X-ray structure is underlined. The first 15 residues of the protein not resolved in the X-ray structure were not modeled. The EcoRI–dsDNA complex was then solvated in a pre-equilibrated volume of TIP3P water (19). K+ and Cl− ions were placed at random to comprise a 0.1 M solution. The final system contained ∼248 000 atoms and measured 11.7 × 11.7 × 17.5 nm3.
Following the assembly, the system was minimized for 2000 steps using the conjugate gradient method. After heating the system from 0 to 295 K in 4 ps by velocity rescaling, the system was equilibrated at 295 K in the NPT ensemble (constant number of particles N, pressure P =1 atm and temperature T =295 K) for 8.4 ns. Within the first 2.2 ns, all backbone atoms of the EcoRI–DNA complex were subject to harmonic restraints (kspring =10 kcal mol−1nm−2). The rest of equilibration was performed using restraints that applied to the protein's α-carbons only.
All simulations were carried out using the program NAMD2 (20), CHARMM27 force field (21), periodic boundary conditions, particle mesh Ewald long-range electrostatics and multiple time stepping (22). A Langevin thermostat with the damping constant of 1 ps−1 was used to maintain the temperature in all simulations. The pressure was maintained in the NPT ensemble simulations using a Nosé–Hoover–Langevin piston with period 200 ps and decay time 100 ps. A smooth 1–1.2 nm cutoff was used to calculate the van der Waals energies. The integration time was 1 fs. Constant-velocity steered molecular dynamics (SMD) were performed using the standard protocol (23). All SMD simulations were carried out at 295 K in the NVT ensemble (constant N, T and volume V); the SMD force was recorded every 20 fs and the atomic coordinates every 1 ps. SMD details are described in the Supplementary Data.
RESULTS AND DISCUSSION
We have discovered a method for detecting base-pair mutations and discriminating between alleles that uses a solid-state nanopore to measure the binding of a restriction enzyme to DNA (12,24). This method uses the electric field in the pore to pull on the polyanionic DNA complexed with a restriction endonuclease, shearing the protein from the cognate sites in DNA and rupturing the bond. The signature of a rupture is the translocation of DNA across the membrane through the pore, which as measured by PCR, appears to depend dramatically on the voltage. This method is derivative of restriction fragment length polymorphism (RFLP), which also uses restriction enzymes to recognize a specific sequence in a dsDNA fragment, and then cleaves the strand at a site in the sequence at or near to it, creating shorter fragments that are subsequently amplified and run on a gel. Since allelic differences affect recognition dramatically, the number and size of the products can be used to determine the genotype in RFLP. With this new method employing a nanopore, it is not necessary to cleave the strand to sort one allele from the other—the difference in threshold voltage could be used to discriminate mutations.
When a voltage is applied across a membrane containing a pore, DNA immersed in electrolyte is driven across the membrane by the electric field in the pore if the diameter is greater than the double helix (∼2.5 nm diameter) (25). However, the DNA permeability changes dramatically if it is bound to a restriction enzyme. To study the binding of EcoRI to DNA, we introduced an excess of the enzyme in solution with DNA without the Mg2+ cofactor that is required for cleaving the nucleic acid. Bulk measurements of the binding at the cognate site indicate a free energy of formation ΔG = −15.2 kcal/mol, but the introduction of a mutation among the cognate sites or even in the flanking sequence produces a position-dependent reduction in the binding energy that ranges from 4 to 13 kcal/mol (3–4). In this work, we investigated the permeability of different DNA variants bound to EcoRI through pores.
With a voltage applied across the membrane, we detect current transients associated with the EcoRI, DNA and EcoRI–DNA complex interacting with the pore, like that illustrated in Figure 2c for the 2.6 × 3.0 nm pore shown in Figure 2a. In correspondence with prior work, we observe transients associated with the EcoRI–DNA interacting with the pore with duration >1 s, and some with a peak current greater than the open pore current (11). It seems likely that the configuration of the complex over the pore modulates the current, affecting the value (26), and the duration of these events may represent an extended residence time of the complex over the pore. The long duration may also indicate that the DNA–protein complex is sticking to the pore (as MD suggests). For example, if the DNA is sticking to a hydrophobic patch in the pore, the stability of the complex and the distribution of forces loading it could be affected.
An unambiguous current signature of the DNA threading the pore or of the rupture of the DNA–protein bond remains elusive, however. Among the challenges are the drift of the open pore current with time, which is likely due to protein agglomeration, as well as changes in the center of mass of the protein–DNA complex over the pore. Moreover, the identification of a current blockade with DNA translocating through a solid-state nanopore is not unequivocal (27). Solid-state nanopores may show a blockade in the pore even if the molecule is not translocating through it, and current enhancements above the open pore current value as well as blockades associated with the same DNA interacting with the pore are observed even in the absence of protein, depending on the electrolyte molarity (28) and the molecular configuration in the pore (26).
The main problems in these experiments probably stems from the bandwidth limitation or transient response time of the nanopore, and the corresponding deterioration of the signal-to-noise that accompanies increased bandwidth. Prior work (27,29) has indicated that the translocation velocity of DNA (not bound to a protein) through a solid-state pore may be large, exceeding 1bp/10 ns for the electric fields used in our experiments. In another report (Mirsaidov,U. et al. unpublished data), we describe measurements of the translocation velocity as a function of voltage through nanopores larger in cross-section than the double helix. We find that when λ-DNA is injected into the electrolyte at the negative (cis) electrode and 200 mV is applied across a 31.5 ± 2.0 nm thick nitride membrane with a 3.6 × 3.2 nm nanopore in it, current blockades are observed. These blockades are supposed to be due to the reduction of the electrolytic current through the pore due to the translocation of DNA. If the blockade duration corresponds with the interval that DNA blocks the pore, then the average transient width tD signifies the time required for 48.502 kbp λ-DNA to translocate through the pore, which is tD = 0.0677 ± 0.003 ms for 200 mV, indicating a translocation velocity of 48.5 kbp/0.067 ms = 1 bp/1.3 ns consistent with other estimates (29). After similar measurements at other voltages, a linear extrapolation to an electric field comparable to the low end of the thresholds for dissociation of a protein–DNA complex yields a velocity of 48.5 kbp/8.3 μs = 1 bp/172 ps (at 2 V/30 nm). At this rate, 105 bp dsDNA would translocate through the pore in ∼20 ns, which is beyond the transient response time (>4 μs—see the Supplementary Data) of the nanopores used in this work (28,30).
Thus, to establish unequivocally if short DNA strands permeate the pore, the DNA reaching the anode was analyzed using qPCR. We systematically investigated the permeability of DNA bound to restriction enzymes as a function of pore diameter and the DNA sequence (11). Figure 3a represents qPCR analyses of the 105 bp DNA variants bound to EcoRI that translocated through the 3.4 × 4.7 nm pore as a function of the voltage drop across the membrane. Previously, we have shown that there is a voltage threshold (U) for permeation of DNA bound to restriction enzymes through a nanopore. Now, we observe that the threshold for permeation of dsDNA depends on recognition sequence substitutions and flanking sequences for a particular enzyme.
Figure 3.

Voltage threshold for permeation through a synthetic nanopore depends on the sequence. (a) qPCR results indicating that the number of 105 bp copies from EcoRI–DNA that permeates a 3.4 × 4.7 nm pore with a threshold voltage that depends on the DNA sequence. Superimposed on the data are fits to the curve used to determine the threshold. The cognate sequence GAATTC (blue) has a threshold voltage of ∼2.1 V, but in contrast, with a substitution for the first-base, TAATTC (green) has a threshold of only 1.1 V. (b) The change in the threshold voltage measured relative to the threshold observed for the cognate sequence is highly correlated with the corresponding change in the dissociation energy. The change in threshold voltages for pores with different cross-sections measured using the same DNA mutations are superimposed in the same figure.
Generally, we observe that the number of DNA copies that permeate the pore rises abruptly over a range of ∼250 mV near a threshold that is especially sensitive to the DNA variant. Since we are operating at constant voltage, the permeation rate can essentially be described by a steady state relation of the Kramers type, i.e. P = A + P0/{1 + exp[q*(U–V)/kT]}, where P0 is a frequency factor, q*U is the barrier height, q*V is the reduction in the energy barrier due to the applied potential and kT represents the thermal energy (31). According to this analysis, the threshold voltage is defined as the voltage, U, where the probability of DNA translocation is equal to 0.5. The constant A takes into account the mutation probability in the DNA leading to spurious qPCR counts, as well the limit of qPCR detection. We take P0 to be independent of applied voltage, acting in the limit of diffusion-limited permeation, since the electric field vanishes within a few Debye lengths of the pore (32). The data seem to justify this assumption since voltages greater than the threshold voltage give translocation counts that fluctuate around a mean value. Using these relations and accounting for the qPCR baseline, the data were fit; the results overlay the scatter plots in Figure 3a.
Apparently, with EcoRI bound to the cognate sequence, GAATTC, dsDNA (dark blue) does not permeate through the pore unless the voltage exceeds U > 2.15 V. This is in contrast with the corresponding threshold, U > 1.15 V (shown in green), for disrupting the bond between the EcoRI and a DNA variant with a single base mutation from G to T on the first cognate site from the 5′ end. These thresholds correspond to bulk measurements of the free energy of formation for GAATTC and the first-base substitution with TAATTC, which are ∼15.2 kcal/mol and 8.6 kcal/mol, respectively (4). The threshold even depends on the flanking sequence. Note that for a mutation from T to A on the first element of the flanking sequence near the 5′ end (shown in light blue), the threshold is U > 1.62 V, which corresponds to a bulk dissociation energy of 13.2 kcal/mol. The same trends are observed for all of the single base mutations that we tried—even using different pores. Figure 3b summarizes the correspondence between the bulk measurements (3,4) and the threshold obtained from three pores: 3.4 × 4.7 nm, 2.6 × 3.0 nm and 2.5 nm shown in Figure 2a. The threshold seems to depend linearly on the bulk dissociation energy, independent of the pore cross-section in the range ≥2.5 nm and ≤3.4 × 4.7 nm.
In prior work, we observed that the voltage threshold for dissociation of the EcoRI–DNA complex seemed to depend on the pore diameter (16). (The threshold may also depend on the cone angle.) In that work, the pores were specifically chosen to be comparable in size to the double helix to preclude the possibility of the enzyme permeating the pore because of concern for the plasticity of the enzyme, while at the same, realizing that the dsDNA by itself might have a voltage threshold for translocation through pores ≤2.5 nm in diameter (33). However, for this effort, we reasoned that a pore with a cross-section larger than the DNA double helix, but smaller than the protein–DNA complex, might show a threshold voltage that is relatively insensitive to the pore geometry as indicated in Figure 3b, provided that the membrane thickness and cone angle defining the pores remain invariant. This reasoning follows from consideration of the energy required to dissociate the complex. The total work, given by the product of the force and the displacement between the protein and DNA, Δz ∼ δa, is just proportional to the voltage (34), i.e. 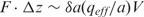 , instead of the field, so we expect the threshold to depend only on the voltage—not the membrane thickness or pore diameter. In the above expression, qeff is the effective charge of a DNA basepair and a is the distance between consecutive basepairs. If the DNA molecule penetrates the pore and is trapped between the protein and the electric field, the portion of the strand between the field maximum and the protein may become overstretched—which is not taken into account in the above argument (33).
Table 1 summarizes the results of the fits to the qPCR data. It indicates that the threshold voltage, U, extracted from the qPCR fits is invariant within the experimental error across the pore dimensions examined, but the threshold varies widely with base substitutions in the recognition sequence and, unexpectedly, the flanking nucleotide. Changes in the free energy of formation of the protein–DNA complex (ΔΔG) for the single base substitutions are known to vary 6–13 kcal/mol from the recognition sequence. Additionally, it has been inferred that the three flanking nucleotides influence the amount of DNA distortion in the complex by adjusting the local rigidity (3). Although a ΔG for our specific flanking nucleotides is not precisely known, Jen-Jacobson has quantified over 40 different flanking sequences and the ΔΔG span was 3.6 kcal/mol. For comparison, we have labeled our flanking sequence change at 1.8 ± 1.8 kcal/mol. Following Jen-Jacobson (4), we referenced the ΔG of the cognate sequence (ΔΔG = 0) and plotted the changes in free energy against the average change in threshold voltage in Figure 3b. The ΔΔG term relates the ΔG of a given sequence to the ΔG of the reference sequence by ΔΔG = ΔGtarget – ΔGreference. As the deviation from the cognate free energy increases, so does the deviation from the threshold voltage of the cognate sequence and the trend appears to be linear, within the error. Table 1 also shows the effective charge q* extracted from the thermal voltage, assuming a constant temperature of 298 K so that kBT = 26 meV and ignoring Joule heating. Note that q* extracted from the fits is not the effective charge of a single basepair and hence cannot be directly compared to the values reported previously (34–36) rather it reflects multiple, screened charges in the DNA interacting with the intense electric field distribution in the pore.
Table 1.
Parameters used to fit the qPCR data
| U (V) | q*/e | P0 (s–1) | A (counts) | |
|---|---|---|---|---|
| TGAATTC | 2.16 ± 0.08 | 0.98 ± 0.06 | 6.74 ± 0.83 | 3.9 ± 5.2 |
| 2.08 ± 0.03 | 0.99 ± 0.22 | 3.46 ± 0.62 | 6.1 ± 2.1 | |
| 2.09 ± 0.06 | 1.01 ± 0.12 | 1.91 ± 0.25 | 24.8 ± 15.3 | |
| AGAATTC | 1.62 ± 0.07 | 0.98 ± 0.24 | 4.61 ± 0.43 | 5.3 ± 8.4 |
| 1.72 ± 0.05 | 0.91 ± 0.17 | 3.06 ± 0.57 | 11.2 ± 15.5 | |
| 1.84 ± 0.05 | 0.99 ± 0.17 | 2.33 ± 0.51 | 1.6 ± 5.0 | |
| TTAATTC | 1.17 ± 0.09 | 0.85 ± 0.10 | 11.5 ± 1.8 | 7.6 ± 7.2 |
| 1.18 ± 0.06 | 0.61 ± 0.15 | 4.11 ± 0.82 | 6.6 ± 5.5 | |
| 1.16 ± 0.03 | 0.97 ± 0.22 | 3.15 ± 0.68 | 5.3 ± 4.8 | |
| TGACTTC | 1.11 ± 0.08 | 1.00 ± 0.17 | 6.63 ± 1.38 | 12.1 ± 10.8 |
| 1.08 ± 0.04 | 1.02 ± 0.37 | 1.11 ± 0.51 | 7.1 ± 3.4 | |
| 1.02 ± 0.08 | 0.52 ± 0.08 | 2.32 ± 0.03 | 2.0 ± 6.2 | |
| TGCATTC | 0.87 ± 0.06 | 0.99 ± 0.11 | 7.01 ± 0.60 | 12.6 ± 5.1 |
| 0.93 ± 0.05 | 0.57 ± 0.08 | 5.57 ± 0.75 | 1.9 ± 1.0 | |
| 0.93 ± 0.06 | 0.59 ± 0.06 | 2.72 ± 0.05 | 12.8 ± 6.1 |
U denotes the threshold voltage, q* the effective charge, P0 is the capture rate and A is the qPCR baseline. The error reflects the distribution obtained from different fits to the same data. 3.4 × 4.7 ± 0.2 nm pore; 2.6 × 3.0 ± 0.2 nm pore; 2.5 ± 0.2 nm pore.
Prior work also indicated a voltage threshold for translocation U < 0.2 V for double-base substitutions, which are considered to be non-specific interactions. [The 105-bp DNA translocation in the absence of protein similarly lacks a threshold (16 and Mirsaidov,U. et al. unpublished data)]. Although we anticipated non-specific binding due to the high ratio of EcoRI:DNA, AFM results using large ratios encountered <5% bound protein (37). Since the threshold for double-base substitutions is so low (if it exists), and non-specific binding is found so infrequently, we reasoned that non-specific interactions would not affect the force calculation.
To estimate the force applied to DNA in the nanopore experiments, that force was directly computed in a set of MD simulations carried out according to a previously established protocol (38). 80- and 40-basepair fragments of B-form dsDNA were threaded through a 2.7 nm-diameter nanopore (16) in 10 and 5 nm-thick silicon nitride membranes, respectively. The surface charge of the pores was −1 e/nm2, where e is the elementary charge. By joining covalently the 3′ and 5′ ends of the DNA fragment and utilizing the periodic boundary conditions, the DNA molecule was made effectively infinite. The third system was prepared by threading a 60 bp fragment fragment of overstretched dsDNA (0.50 nm/base pair) (39) through the nanopore in the 10-nm-thick membrane. To measure the effective force, a set of harmonic springs restrained the DNA displacements. Figure S6 in the Supplementary Data shows the effective force applied to DNA versus time in a simulation performed under a 1 V transmembrane bias. As it was previously suggested, the steady-state effective force does not depend on the membrane thickness. However, the force was found to depend on the DNA conformation. The absolute value of the force at 1 V was 473 ± 2 and 365 ± 2 pN for the DNA charge density of −6.1 e/nm (B-form) and −4.0 (stretched) e/nm, respectively, in the 10-nm-thick membrane. The charge density was computed assuming 0.33 and 0.5 nm basepair spacing for B-form and stretched DNA, respectively, and a nominal charge of −2e for a DNA base pair. Assuming a linear scaling of the effective force with the transmembrane bias (38), the values obtained are in agreement with a ∼1 nN rupture force observed in the SMD simulations and an ∼2 V threshold bias measured in the experiment. Note that the ratio of the effective forces cannot be predicted simply from the ratio of the charge densities because of the hydrodynamic drag of the electro-osmotic flow (38).
To discover how a mutation might affect the EcoRI–DNA dissociation energy, we analyzed a rupture in detail using constant-velocity SMD simulations on an all-atom model of the EcoRI–DNA complex. The inset to Figure 4a schematically shows the simulations protocol used: a time-dependent SMD force pulls one end of DNA away from the protein while the protein is restrained. In Figure 4a, the SMD force applied to DNA and the restraining force are shown versus simulation time. The two forces act in opposite directions; their magnitudes are equal, on average. The SMD and restraining forces are not equal exactly because, in addition to applying a force to the protein through DNA–protein interactions, the SMD force stretches DNA and acts against the hydrodynamic drag of the solvent. The instantaneous values of both forces fluctuate, and the average forces depend on the interval over which the average is taken. In Figure 4a, all forces are averaged over 0.5 ns intervals.
Figure 4.

Forces and deformations in the EcoRI–DNA complex as it is pulled apart in the SMD simulation. (a) The SMD force acting on DNA and the restraining force acting on the protein during the constant-velocity SMD simulation. A schematic of the system and the forces involved is shown in the insert. Displacement R of individual nucleotides during the SMD simulation for DNA chain A (b) and chain B (c). The dashed line shows the breakup distance Rcutoff = 2.5 Å. (d) Nucleotide numbering and coloring convention. The box encloses 6 bp of the cognate sequence recognized by EcoRI.
The displacements Ri of individual nucleotides during the SMD simulation are shown in Figure 4b and c. The nucleotides are numbered as shown in Figure 4d. The 5′-end flanking nucleotides CGC are nucleotides 1–3, the cognate nucleotides GAATTC are nucleotides 4–9 and the 3′-end flanking nucleotides GCG are nucleotides 10–12. This convention derives from the fact that the 6-bp cognate and 3-nucleotide flanking sequences are palindromic. Thus, the nucleotide n in strand A is bound to nucleotide (13 – n) in strand B. Among the atom pairs selected as a measure of the protein–DNA distance are atoms of all cognate (4–9) and two flanking (2,3) nucleotides in each DNA strand. Other flanking nucleotides are too distant from the protein to participate in specific protein–DNA interactions. In the simulation, nucleotides 9 of chain A (A9, for brevity) and 2 of chain B (i.e. B2) are the most proximal of all ‘essential’ nucleotides to the point of application of the SMD force; the SMD force does not apply to nucleotides 1–12 directly. Because of the symmetry and the protocol of the SMD simulation, the outcome of the simulation would be the same if the SMD force were applied in the opposite direction to the other DNA end and the chain identifiers A and B were swapped.
The plots of the force in Figure 4a and displacements in Figure 4b and c suggest that during the first ∼7 ns of the simulation, the stress accumulates without producing noticeable structural changes in the DNA binding site. At t ≈ 7–7.5 ns, the SMD force reaches 1 nN; the complex begins to rupture as nucleotide 2B leaves its position in the binding site. Around t ≈ 8 ns, nucleotides A9 and B3–5 (of which A9 and B4 constitute a base pair) break away in concert; 6B follows shortly. After all specific bonds between these nucleotides and the protein yield (t ≈ 8 ns), the strain temporarily decreases, which transiently lowers the SMD and restraining forces by ∼0.2–0.3 nN; see Figure 4a. As the SMD simulation continues, the strain accumulates. The rupture of the complex intensifies again at t ≈ 10 ns when the SMD and restraining forces reach their global maxima of 1.1–1.2 nN. At this time (t ≈ 10–11 ns), all remaining protein–DNA bonds rupture as nucleotides A2–8 and B7–9 move away from the protein-binding site.
Figure 4b and c clearly demonstrates that the rupture occurs in two stages. Even after the first group of nucleotides break away, the complex remains stable for ∼3 ns. As expected, flanking nucleotides B2, B3 and the cognate nucleotides A9 and B4–6, which are most proximal to the DNA end subject to the SMD force, leave the DNA binding site first. It is interesting to note that the remaining nucleotides, including flanking nucleotides A2 and A3, exhibit a collective rupture similar to brittle failure, suggesting that they all may contribute to the stability of the complex. As demonstrated in the supplement, the lack of the X-ray structures depicting equilibrium conformations of the mutant variants of DNA-EcoRI precludes the direct determination of the influence of the mutations on the rupture force from SMD simulations. To further investigate the rupture mechanism, a series of stopped-SMD simulations (vSMD = 0, see Supplementary Data) were carried out using as initial conditions select time points of the reference SMD simulation. Two of the restart points, at τ = 5 and 6 ns, precede the breakaway of the first group of nucleotides; another two, τ = 6.9 and 7.5 ns, represent the first major rupture event; the point at τ = 8.4 ns corresponds to the relaxation period between the two major rupture events, and the one at τ = 10.5 ns represents the second major breakaway of the nucleotides.
Figure 5a illustrates the behavior of the SMD force in six stopped-SMD simulations that were run starting from the conformation obtained after τ = 5, 6, 6.9, 7.5, 8.4 and 10.5 ns of the reference SMD simulation. In all stopped-SMD runs, the SMD force initially decreases but eventually becomes constant. The value of the force in the constant force regime was found to depend on τ, as shown in the insert to Figure 5a. The complex remains stressed for τ = 5 and 6 ns and, to a lesser extent, at τ = 6.9–8.4 ns. To understand this behavior, we plot in Figure 5b the protein–DNA displacement parameter R. According to the plot, the simulation trajectories can be classified into three groups: small deformation (R < 0.1 nm), τ = 5–6 ns; moderate deformation (R ∼ 0.5–1 nm), τ = 6.9–8.4 ns; and large deformation (R > 2.0 nm), τ = 10.5 ns. The sharp difference between the three groups of trajectories suggests that the EcoRI–DNA complex is strained but does not break when τ < τ1*, partially ruptures but is able to withstand a load when τ1* < τ < τ2* and breaks up completely when τ > τ2*. The threshold values τ1* and τ2* for the reference SMD run lie between 6.0–6.9 and 8.4–10.5 ns, respectively. A similar behavior is expected to occur in experiment though the numerical values τk* to be observed may depend on the loading rate.
Figure 5.

Forces and deformations in the EcoRI–DNA complex during stopped (vsmd = 0) SMD simulations. (a) The SMD force during the reference and stopped SMD simulation. The reference (vsmd = 0.5 nm/ns) SMD simulation is indicated by filled gray circles. Each stopped SMD simulation has a fragment of the reference SMD simulation of duration τ, after which the SMD velocity was set to zero. The insert shows the dependence of the SMD force averaged over the last 10 ns of each simulation on τ. (b) The displacement parameter R for the reference and stopped SMD simulations. The insert shows a close-up of R(t) for the first 15 ns of the simulations.
To elucidate the timeline of the rupture event and the relative strength of particular DNA–protein interactions, we analyzed displacements of individual nucleotides in our stopped-SMD trajectories. By analyzing the breakup order of nucleotides under different strains, we were able to rank them in the order of increasing protein-binding strength as shown on the horizontal axis of Figure 6, left to right. The detailed description of the analysis is provided in the supplement. It is natural to assume that the stronger a nucleotide is bound, the more pronounced is the effect on overall complex stability of a mutation in that nucleotide. Note that the protocols of our SMD simulations and nanopore experiments both break the symmetry of the EcoRI–DNA complex because the force is applied only to one DNA end. That is, the order in which the bonds break depends on which DNA end the force is applied and thus, the flanking nucleotides (for example B2 and A2) could have apparently different binding affinities. Hence, Figure 6 cannot be directly compared to bulk measurements or equilibrium MD simulations as those are ‘directionless’.
Figure 6.

Timeline of rupture of individual nucleotides from EcoRI. The nucleotides are listed along the horizontal axis, left to right, in the sequence they break away from their docked positions. Bonds between nucleotides of DNA chains A and B forming base pairs are shown schematically. Each data line corresponds to a particular SMD simulation. Time to rupture of each nucleotide in a particular simulation is shown along the vertical axis. The absence of a data point for a particular nucleotide on a given line means that the rupture of this nucleotide was not observed within the length of the respective simulation. All simulations, except for the reference and τ = 10.5 ns simulations, lasted ∼40 ns.
By taking into consideration the symmetry of the EcoRI–DNA complex, we qualitatively ranked the equilibrium affinity of the nucleotides to the protein. Our ranking presented in the supporting information (Table S1) is clearly correlated with the experimental data, and thus possesses a predictive force, albeit on a qualitative level. It is noteworthy that the MD simulation suggested that the mutation in the flanking nucleotide 3 would have a noticeable effect before such evidence was obtained in an experiment.
In summary, we observe a threshold voltage for dissociation of the EcoRI–DNA complex through nanopores that depends sensitively on the DNA sequence at the recognition site and the flanking nucleotides. The threshold voltage for each variant of DNA scales linearly with the corresponding change in the dissociation energy. Relying on the high sequence specificity of EcoRI, we can easily differentiate DNA sequences that differ by only one base mutation. The thresholds were relatively invariant with pore diameters from 2.5 to 4.7 nm, and so lower tolerances in processing are required making synthetic pores suitable prospectively for large-scale integration and high throughput SNP screening.
As a signature of a rupture in the EcoRI–DNA complex, we use the translocation of DNA through the pore, which is measured by PCR. The number of DNA copies that permeate the pore appears to depend dramatically on the membrane voltage. Using membranes with a smaller capacitance would improve the nanopore frequency response while at the same time lower the dielectric noise improving the current signal fidelity. Thus, smaller capacitive membranes hold the promise of providing an unambiguous current signature of a translocation obviating the need for PCR, lowering the cost of SNP screening.
SUPPLEMENTARY DATA
Supplementary Data are available at NAR Online.
ACKNOWLEDGEMENTS
We gratefully acknowledge conversations with Professor Stephen Sligar concerning the protocols for handling and star activity in restriction enzymes. The authors also gladly acknowledge supercomputer time provided by the National Center for Supercomputing Applications via Large Resources Allocation grant No. MCA05S028.
FUNDING
Grants from National Institutes of Health (R01 HG003713A, PHS 5 P41-RR05969); National Science Foundation (PHY0822613); the Petroleum Research Fund (48352-G6). Funding for open access charge was provided by the National Institutes of Health (R01 HG003713A).
Conflict of interest statement. None declared.
REFERENCES
- 1.Sidorova NY, Rau DC. Linkage of EcoRI dissociation from its specific DNA recognition site to water activity, salt concentration, and pH: separating their roles in specific and non-specific binding. J. Mol. Biol. 2001;310:801–816. doi: 10.1006/jmbi.2001.4781. [DOI] [PubMed] [Google Scholar]
- 2.Jeltsch A, Alaves J, Wolfes H, Maas G, Pingoud A. Pausing of the restriction endonuclease EcoRI during linear diffusion on DNA. Biochemistry. 1994;33:10215–10219. doi: 10.1021/bi00200a001. [DOI] [PubMed] [Google Scholar]
- 3.Jen-Jacobsen L. Protein–DNA recognition complexes: conservation of structure and binding energy in the transition state. Biopolymers. 1997;44:153–180. doi: 10.1002/(SICI)1097-0282(1997)44:2<153::AID-BIP4>3.0.CO;2-U. [DOI] [PubMed] [Google Scholar]
- 4.Lesser DR, Kurpiewski MR, Jen-Jacobson L. The energetic basis of specificity in the Eco-RI endonuclease-DNA interaction. Science. 1990;250:776–786. doi: 10.1126/science.2237428. [DOI] [PubMed] [Google Scholar]
- 5.Robinson CR, Sligar SG. Changes in solvation during DNA binding and cleavage are critical to altered specificity of the EcoRI endonuclease. Proc. Natl Acad. Sci. USA. 1998;95:2186–2191. doi: 10.1073/pnas.95.5.2186. [DOI] [PMC free article] [PubMed] [Google Scholar]
- 6.Ha JH, Spolar RS, Record MT., Jr Role of the hydrophobic effect in stability of site-specific protein–DNA complexes. J. Mol. Biol. 1989;209:801–816. doi: 10.1016/0022-2836(89)90608-6. [DOI] [PubMed] [Google Scholar]
- 7.Sen S, Nilsson L. Structure, interaction, dynamics, and solvent effects on the DNA-EcoRI complex in aqueous solution from molecular dynamics simulations. Biophys. J. 1999;77:1782–1800. doi: 10.1016/S0006-3495(99)77024-4. [DOI] [PMC free article] [PubMed] [Google Scholar]
- 8.Beveridge DL, McConnel KJ, Nirmala R, Young MA, Vijayakumar S, Ravishanker G. Molecular dynamics simulations of DNA and protein–DNA complexes including solvent: recent progress. ACS Symp. Ser. 1994;568:381–394. [Google Scholar]
- 9.Eriksson M, Hard T, Nilsson L. Molecular dynamics simulation of a DNA binding protein-free and in complex with DNA. NATO ASI Ser. C. 1994;426:441. [Google Scholar]
- 10.Duan Y, Wilkosz P, Rosenberg JM. Dynamic contributions to the DNA binding entropy of the EcoRI and EcoRV restriction endonucleases. J. Mol. Biol. 1996;264:546–555. doi: 10.1006/jmbi.1996.0660. [DOI] [PubMed] [Google Scholar]
- 11.Greenleaf WJ, Block SM. Single-molecule, motion-based DNA sequencing using RNA polymerase. Science. 2006;313:801. doi: 10.1126/science.1130105. [DOI] [PMC free article] [PubMed] [Google Scholar]
- 12.Reif M, Clausen-Schaumann H, Gaub HE. Sequence-dependent mechanics of single DNA molecules. Nature Struc. Biol. 1999;6:346–349. doi: 10.1038/7582. [DOI] [PubMed] [Google Scholar]
- 13.Koch SJ, Shundrovsky A, Jantzen BC, Wang MD. Probing protein–DNA interactions by unzipping a single DNA double helix. Biophys. J. 2002;83:1098–1105. doi: 10.1016/S0006-3495(02)75233-8. [DOI] [PMC free article] [PubMed] [Google Scholar]
- 14.Koch SJ, Wang MD. Dynamic force spectroscopy of protein–DNA interactions by unzipping DNA. Phys. Rev. Lett. 2003;91:028103-1. doi: 10.1103/PhysRevLett.91.028103. [DOI] [PubMed] [Google Scholar]
- 15.Allison DP, Kerper PS, Doktycz MJ, Spain JA, Modrich P, Larimer FW, Thundat T, Warmack RJ. Direct atomic force microscope imaging of EcoRI endonuclease site specifically bound to plasmid DNA molecules. Proc. Natl Acad. Sci. USA. 1996;93:8826–8829. doi: 10.1073/pnas.93.17.8826. [DOI] [PMC free article] [PubMed] [Google Scholar]
- 16.Zhao Q, Sigalov G, Dimitrov V, Dorvel B, Mirsaidov U, Sligar S, Aksimentiev A, Timp G. Detecting SNPs using a synthetic nanopore. NanoLetters. 2007;7:1680–1685. doi: 10.1021/nl070668c. [DOI] [PMC free article] [PubMed] [Google Scholar]
- 17.Ho C, Qiao R, Heng J, Chatterjee A, Timp R, Aluru N, Timp G. Electrolytic transport through a synthetic nanometer-diameter pore. Proc. Natl. Acad. Sci. USA. 2005;102:10445–10450. doi: 10.1073/pnas.0500796102. [DOI] [PMC free article] [PubMed] [Google Scholar]
- 18.Bookout AL, Cummins CL, Kramer MF, Pesola JM, Mangelsdorf DJ. Curr. Protocols Mol. Biol. John Wiley & Sons; 2006. High throughput real time quantitative reverse transcription PCR; pp. 15.8.1–15.8.28. [DOI] [PubMed] [Google Scholar]
- 19.Jorgensen WL, Chandrasekhar J, Madura JD, Impey RW, Klein ML. Comparison of simple potential functions for simulating liquid water. J. Chem. Phys. 1983;79:926–935. [Google Scholar]
- 20.Phillips JC, Braun R, Wang W, Gumbart J, Tajkhorshid E, Villa E, Chipot C, Skeel RD, Kale L, Schulten K. Scalable molecular dynamics with NAMD. J. Comp. Chem. 2005;26:1781–1802. doi: 10.1002/jcc.20289. [DOI] [PMC free article] [PubMed] [Google Scholar]
- 21.MacKerell AD, Bashford D, Bellott M, Dunbrack RL, Evanseck JD, Field MJ, Fischer S, Gao J, Guo H, Ha S, et al. All-atom empirical potential for molecular modeling and dynamics studies of proteins. J. Phys. Chem. B. 1998;102:3586–3616. doi: 10.1021/jp973084f. [DOI] [PubMed] [Google Scholar]
- 22.Batcho PF, Case DA, Schlick TJ. Optimized particle-mesh Ewald/multiple-time step integration for molecular dynamics simulations. J. Chem. Phys. 2001;115:4003–4018. [Google Scholar]
- 23.Isralewitz B, Izrailev S, Schulten K. Binding pathway of retinal to bacterio-opsin: a prediction by molecular dynamics simulations. Biophys. J. 1997;73:2972–2979. doi: 10.1016/S0006-3495(97)78326-7. [DOI] [PMC free article] [PubMed] [Google Scholar]
- 24.Hornblower B, Coombs A, Whitaker RD, Kolomeisky A, Picone SJ, Meller A, Akeson M. Single-molecule analysis of DNA–protein complexes using nanopores. Nat. Meth. 2007;4:315–317. doi: 10.1038/nmeth1021. [DOI] [PubMed] [Google Scholar]
- 25.Heng JB, Ho C, Kim T, Timp R, Aksimentiev A, Grinkova YV, Sligar S, Schulten K, Timp G. Sizing DNA using a nanometer-diameter pore. Biophys. J. 2004;87:2905–2911. doi: 10.1529/biophysj.104.041814. [DOI] [PMC free article] [PubMed] [Google Scholar]
- 26.Comer J, Dimitrov V, Zhao Q, Timp G, Aksimentiev A. Microscopic mechanics of hairpin DNA translocation through synthetic nanopores. Biophys. J. 2009;96:593–608. doi: 10.1016/j.bpj.2008.09.023. [DOI] [PMC free article] [PubMed] [Google Scholar]
- 27.Aksimentiev A, Heng JB, Timp G, Schulten K. Microscopic kinetics of DNA translocation through synthetic nanopores. Biophy. J. 2004;87:2086–2097. doi: 10.1529/biophysj.104.042960. [DOI] [PMC free article] [PubMed] [Google Scholar]
- 28.Smeets RMM, Keyser UF, Krapf D, Wu MY, Dekker NH, Dekker C. Salt dependence of ion transport and DNA translocation through solid-state nanopores. Nano Lett. 2006;6:89–95. doi: 10.1021/nl052107w. [DOI] [PubMed] [Google Scholar]
- 29.Fologea D, Uplinger J, Thomas B, McNabb DS, Li J. Slowing DNA translocation in a solid-state nanopore. Nano Lett. 2005;5:1734–1737. doi: 10.1021/nl051063o. [DOI] [PMC free article] [PubMed] [Google Scholar]
- 30.Smeets RMM, Keyser UF, Wu MY, Dekker NH, Dekker C. Noise in solid-state nanopores. Proc. Natl Acad. Sci. USA. 2008;105:417–421. doi: 10.1073/pnas.0705349105. [DOI] [PMC free article] [PubMed] [Google Scholar]
- 31.Goychuk I, Hanggi P. Ion channel gating: a first-passage time analysis of the Kramers type. Proc Natl Acad. Sci. USA. 2002;99:3552. doi: 10.1073/pnas.052015699. [DOI] [PMC free article] [PubMed] [Google Scholar]
- 32.Nakane J, Akeson M, Marziali A. Evaluation of nanopores as candidates for electronic analyte detection. Electrophoresis. 2002;23:2592–2601. doi: 10.1002/1522-2683(200208)23:16<2592::AID-ELPS2592>3.0.CO;2-L. [DOI] [PubMed] [Google Scholar]
- 33.Heng JB, Aksimentiev A, Ho C, Marks P, Grinkova YV, Sligar S, Schulten K, Timp G. The electromechanics of DNA in a synthetic nanopore. Biophys. J. 2006;90:1098–1106. doi: 10.1529/biophysj.105.070672. [DOI] [PMC free article] [PubMed] [Google Scholar]
- 34.Keyser UF, Koeleman BN, Van Dorp S, Krapf D, Smeets RMM, Lemay SG, Dekker NH, Dekker C. Direct force measurements on DNA in a solid-state nanopore. Nat. Phys. 2006;2:473–477. [Google Scholar]
- 35.Manning GS. Molecular theory of polyelectrolyte solutions with applications to electrostatic properties of polynucleotides. Q. Rev. Biophys. 1978;11:179–246. doi: 10.1017/s0033583500002031. [DOI] [PubMed] [Google Scholar]
- 36.Stellwagen E, Stellwagen NC. Probing the electrostatic shielding of DNA with capillary electrophoresis. Biophys. J. 2003;84:1855–1866. doi: 10.1016/S0006-3495(03)74993-5. [DOI] [PMC free article] [PubMed] [Google Scholar]
- 37.Sorel I, Pietrement O, Hamon L, Baconnais S, Le Cam E, Pastre D. The EcoRI–DNA complex as a model for investigating protein–DNA interactions by atomic force microscopy. Biochemistry. 2006;45:14675–14682. doi: 10.1021/bi060293u. [DOI] [PubMed] [Google Scholar]
- 38.Luan B, Aksimentiev A. Electro-osmotic screening of the DNA charge in a nanopore. Phys. Rev. E. 2008;78:021912-1–021912-4. doi: 10.1103/PhysRevE.78.021912. [DOI] [PMC free article] [PubMed] [Google Scholar]
- 39.Luan B, Aksimentiev A. Strain softening in stretched DNA. Phys. Rev. Lett. 2008;101:118101-1–118101-4. doi: 10.1103/PhysRevLett.101.118101. [DOI] [PMC free article] [PubMed] [Google Scholar]
Associated Data
This section collects any data citations, data availability statements, or supplementary materials included in this article.