Abstract
A specific and sensitive liquid chromatography (LC)-tandem mass spectrometric method for quantitative determination of methylprednisolone (MP) in rat plasma and liver was developed and validated using triamcinolone acetonide as an internal standard. Liquid-liquid extraction using tert-butyl methyl ether was used to extract the drug and the internal standard from plasma and liver. The separation of MP was performed on a C18 column with a mobile phase of acetonitrile:0.5% formic acid aqueous solution (85:15, v/v) over 4 min. The assay was based on the selected reaction monitoring transitions at m/z 375→161 for MP in plasma, 375→357 for MP in liver, and 435→415 for internal standard in both plasma and liver. The lower limit of quantification was 20 ng/mL based on 100 μL of plasma or liver homogenate. Intra- and inter-day assay variations were ≤15%, and the accuracy values were between 85.8 and 118%. The extraction recoveries ranged from 76.8 to 79.2% for plasma and 76.8 to 80.8% for liver across the calibration curve range. The method was successfully applied to measurement of low concentrations of regenerated MP in plasma and liver after intravenous administration of a single dose (5 mg/kg) of a liver-targeted dextran prodrug of MP to rats.
Keywords: Methylprednisolone, Dextran-methylprednisolone prodrug, Rat plasma, Rat liver, Liquid chromatography-tandem mass spectrometry, Pharmacokinetics
1. Introduction
Methylprednisolone (MP) is a glucocorticoid with well-defined anti-inflammatory and immunosuppressive effects, which has been widely used for prevention of graft rejection in organ transplantation [1,2]. However, the use of steroids and other immunosuppressants in organ transplantation has been associated with significant toxicity, such as diabetes, hypertension, Cushing syndrome, and osteoporosis [3–5]. Recently, we synthesized a macromolecular prodrug of MP using dextran as a carrier and succinic acid as a linker, and investigated its hydrolysis kinetics [6], pharmacokinetics [7], and pharmacodynamics [8,9] in rats. It was demonstrated that the prodrug would selectively accumulate and gradually release MP in the liver and spleen, resulting in a more intense and sustained immunosuppressive activity in these organs, compared to administration of an equal dose of the parent drug. Further studies [10] in a rat transplantation model showed that this dextran prodrug of MP is more effective than the parent drug in preventing rejection of the liver allograft. However, despite very high accumulation of the conjugate in the liver and spleen, the release of MP from the conjugate was slow and incomplete [6,9]. Therefore, the second generation dextran-MP (DMP) prodrugs with various peptides as linkers were synthesized and investigated in the presence of various peptidases, rat liver lysosomes, and buffers with different pH values [11]. These newly developed dextran conjugates of MP with peptide linkers exhibited promise for controlled delivery of MP in liver lysosomes. However, further pharmacokinetic studies in animals are needed to test the selective delivery of MP to the liver and the regeneration kinetics of MP after systemic administration of dextran-peptide-MP conjugates.
A prerequisite for pharmacokinetic studies involving regeneration of MP from its macromolecular prodrugs is a sensitive assay capable of measurements of low concentrations of MP in small volumes of biological samples in animals such as rodents. Very recently [12], LC coupled with tandem mass spectrometry (LC-MS/MS) was used to estimate the concentrations of a number of immunosuppressants, including MP, after solid-phase extraction of the analytes from 0.5 mL of human plasma. Additionally, other LC-MS/MS assays have been reported for the measurement of MP in urine [13,14]. However, to date, no literature on the determination of MP in rat plasma (≤ 100 μL) and/or the liver tissue using LC-MS or LC-MS/MS is available. Therefore, the purpose of this study was to develop a novel LC-MS/MS method for the measurement of regenerated MP in small volumes of rat plasma and liver. The assay was successfully applied to determination of the in vitro stability of DMP in biological samples and to a pharmacokinetic study in rats after intravenous administration of the prodrug DMP or the parent drug MP at a single MP-equivalent dose of 5 mg/kg.
2. Experimental
2.1. Materials
Dextran with an average molecular weight of 23,500 was obtained from Dextran Products Ltd. (Scarborough, Ontario, Canada). MP and MP succinate were purchased from Steraloids (Newport, RI, USA). Triamcinolone acetonide, as an internal standard (IS), was obtained from Sigma (St. Louis, MO, USA). HPLC grade acetonitrile was from VWR Scientific (Minneapolis, MN, USA). Tert-butyl methyl ether (TBME) was obtained from Fisher (Fair Lawn, NJ, USA). Rat plasma was purchased from Lampire Biological Laboratories (Pipersville, PA, USA). All other reagents were analytical grade and obtained through commercial sources.
2.2. Synthesis of DMP
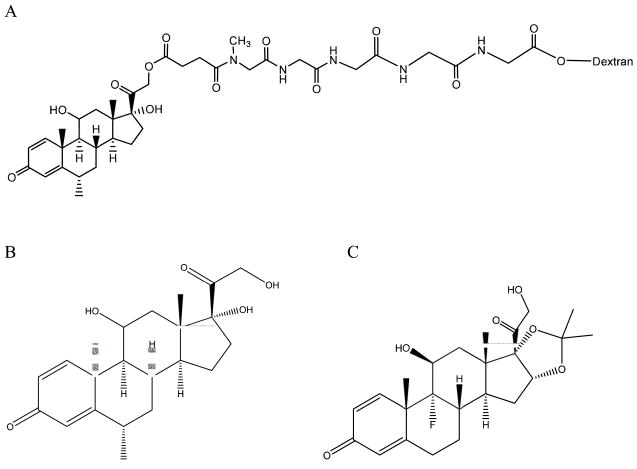
DMP conjugate with a peptide linker consisting of methyl Gly-Gly-Gly-Gly-Gly (Fig. 1) was synthesized from dextran 23,500 and MP succinate as described before [11]. The degree of substitution of MP and the purity of the conjugate were also examined as explained before [11].
Fig. 1.
Chemical structure of (A) dextran-peptide-methylprednisolone succinate prodrug, (B) methylprednisolone and (C) triamcinolone acetonide (internal standard).
2.3. LC-MS/MS instrumentation
LC-MS/MS system was from Varian (Palo Alto, CA, USA) and consisted of a ProStar 430 autosampler, two ProStar 210 pumps, and a 1200 L triple quadrupole mass spectrometer equipped with an electrospray ionization source. Varian MS workstation version 6.8 software was used for data acquisition and processing.
2.4. Liquid chromatographic conditions
The chromatographic separation was performed on a Pursuit C18 column (150 mm × 2.0 mm, 5 μm particle size, Varian Inc., Lake Forest, CA, USA) at ambient temperature. The same packing material (MetaGuard guard cartridge, 4 mm×2.0 mm, Varian Inc., Lake Forest, CA, USA) was used to extend the life of the analytical column. The mobile phase consisted of acetonitrile: 0.5% (v/v) formic acid aqueous solution (85:15, v/v) operated at a flow rate of 0.2 mL/min. The injection volume was 10 μL, and the analysis time was 4 min per sample.
2.5. Mass spectrometer conditions
The ESI-MS spectrometer was operated in the positive ion mode. The electrospray capillary voltage was set to 60 V. Nitrogen was used as a drying gas for solvent evaporation. The API housing and drying gas temperatures were kept at 50 and 275 °C, respectively. Protonated analyte molecules were subjected to collision induced dissociation using argon as the collision gas to yield product ions for MP and IS. The scan time was 0.8 s and the detector multiplier voltage was set to 1100 V. Selected reaction monitoring (SRM) of the precursor–product ion transitions m/z 375→161 for MP in plasma, 375→357 for MP in liver, and 435→415 for IS in plasma and liver was used for quantification. The collision energy was 18 and 7.5 eV for MP at 375→161 and 375→357, respectively, and 5.5 eV for IS.
2.6. Standard and working solutions
Individual stock solutions of MP (1 mg/mL) and IS (5 μg/mL) were prepared by accurately weighing the required amounts into separate volumetric flasks and dissolving in acetonitrile.
The calibration standard for MP was prepared by spiking 4.95 mL of blank rat plasma with 50 μL of MP stock solution. The resulting plasma standard had a concentration of 10,000 ng/mL. Further dilutions were made from this stock with blank plasma to afford plasma standards in the range of 20–5000 ng/mL. For preparation of liver standards, blank livers were collected from male Sprague-Dawley rats that had not received any drug treatment. Subsequently, the blank liver tissue was homogenized in three volumes of 2% (v/v) acetic acid solution using a tissue homogenizer (Biospec Products, Bartlesville, OK, USA) at a speed of 10,000 rpm for 2 min. Similar to plasma standards, the liver homogenate standards were prepared by first adding 50 μL of MP stock solution to 4.95 mL of the homogenate. Liver homogenate standards in the range of 20–1000 ng/mL were then prepared by diluting this homogenate with blank homogenate.
2.7. Sample preparation
To 100 μL of plasma or liver homogenate sample was added 10 μL of IS solution. Following the addition of 1.5 mL of TBME, the sample was vortex-mixed for 10 min and then centrifuged at 10,000 rpm for 5 min. The resultant supernatant (1.2 mL) was transferred to another tube and dried under vacuum at 40 °C. The dried residue was reconstituted in 50 μL of acetonitrile and vortex-mixed for 1 min. After centrifugation at 10,000 rpm for 5 min, the supernatant was transferred to an autosampler vial, and a 10-μL aliquot of the sample was injected into LC-MS/MS.
2.8. Method validation
2.8.1. Selectivity
To serve as blanks, plasma and liver samples were obtained from six different sources and analyzed to assure that they were free of interfering response values, and the results were compared with those obtained from an aqueous solution of MP at the lower limit of quantification (LLOQ). The blank liver and plasma samples were also used to test the matrix effect. This was done by comparing the response values of the extracted blank samples that were spiked with the drug to those of standards injected directly.
2.8.2. Extraction recovery
The extraction recovery of MP from plasma and liver was determined at three concentrations at the lower, middle, and higher parts of the calibration curves (50, 500, and 2000 ng/mL for plasma and 50, 200, and 800 ng/mL for liver homogenate). Samples (n = 7) were then subjected to the extraction procedure, and the resultant MP peak areas were compared to those obtained from direct injection of standard solutions of equivalent concentrations. The recovery of IS was determined similarly.
2.8.3. Linearity
The linearity of the method was evaluated by calibration curves (n = 5) in the range of 20–5000 ng/mL and 20–1000 ng/mL for plasma and liver, respectively. Calibration curves were constructed by plotting peak area ratios of MP to IS against concentration with a weight of 1/x2.
2.8.4. Accuracy and precision
The intra- and inter-day accuracy and precision were evaluated by analysis of LLOQ and low, middle, and high quality control (QC) samples with six determinations per concentration on the same day over three days. The concentration of each sample was determined using calibration standards prepared on the same day. Accuracy was expressed as percentage value (% accuracy = [measured concentration/nominal concentration] × 100%). The precision was estimated as percentage relative standard deviation (%RSD). For acceptable intra- and inter-day values, accuracy should be within 85–115% and RSD values should be ≤15% over the calibration range, except at the LLOQ, where accuracy should be between 80 and 120% and RSD should not exceed 20%.
2.9. Application of the method
2.9.1. In vitro stability of the prodrug during sample preparation and/or storage
Because of the relatively high in vivo concentrations of dextran prodrugs of MP in plasma and/or liver, compared with the regenerated MP [7], even a small degradation of the conjugate in vitro can significantly overestimate the MP concentrations regenerated from the conjugate in vivo. A previous work on the in vitro stability of dextran-peptide-MP prodrugs showed that the conjugates are more stable when acetic acid was added to the samples [11]. Therefore, the in vitro stability of DMP in the plasma and liver samples was studied in the presence and absence of acid. Blank plasma was spiked with 10% acetic acid solution (4:1, v/v) or water (control). Similarly, blank liver was homogenized with three volumes of 2% acetic acid solution or water. A DMP aqueous solution was then added to plasma or liver homogenate to produce a final concentration of 10 μg/mL (MP equivalent).
To determine the stability of the samples during sample preparation and analysis, a set of spiked samples were prepared at room temperature and analyzed for their content of released MP without any storage. The measured values of MP in these samples were then compared with the free MP impurity in the DMP powder. Further, to determine the stability of the samples during storage, additional sets of samples were stored at −20 °C or −80 °C, and aliquots were analyzed at 3, 7, and 14 days after storage. All determinations were conducted in triplicates.
2.9.2. Pharmacokinetic study
All procedures involving animals were conducted in accordance with the Principles of Laboratory Animal Care (NIH publication #85–23, revised in 1985), and approved by our Institutional Animal Care and Use Committee. Adult male Sprague-Dawley rats, weighing between 250 and 300 g, were obtained from Charles River Lab (Wilmington, MA, USA) and already had a polyethylene cannula inserted into the right jugular vein. The rats were housed in standard cages and allowed free movement and access to food and water during the whole experiment.
The dosing solution of the prodrug DMP was dissolved in physiological saline to produce a concentration of 5 mg/mL (MP equivalent). The dosing solution of the parent drug MP (5 mg/mL) was dissolved in a mixture of polyethylene glycol 400: ethanol: saline (6.8: 1.2: 2, v/v) [15]. A single 5 mg/kg (MP equivalent) dose of either MP or DMP was administered into the tail veins of rats that were under mild isoflurane anesthesia. At designated time points after dosing, blood samples (0.3 mL) were taken and centrifuged in heparin-coated microcentrifuge tubes to obtain plasma. Plasma sample (80 μL) was transferred to a silanized microcentrifuge tube containing 20 μL of 10% acetic acid solution to prevent DMP hydrolysis in vitro. At the end of the experiments, animals were euthanized using carbon dioxide, and the liver was perfused via portal vein using ice-cold saline and blotted dry. All the samples were stored at −80 °C until analysis within a week.
3. Results and discussion
3.1. Liquid chromatography- mass spectrometry
The mobile phase optimization was accomplished by comparing various solvent systems composed of mixtures of methanol, acetonitrile, and formic acid. Methanol caused serious ion suppression with a peak area reduction of approximately 30% compared to acetonitrile. Higher formic acid concentrations resulted in sharp and narrow peaks. The mobile phase consisting of a mixture of acetonitrile: 0.5% formic acid aqueous solution (85:15) was found to be suitable for separation and ionization of MP and IS. The selection of SRM mode and associated acquisition parameters were evaluated for best response under positive mode by infusing a standard solution via a syringe pump into the mobile phase. The optimized responses for MP and IS were obtained. For MP, several possible ion transitions could be considered (m/z 375→357, 375→339, 375→321, 375→253, and 375→161). SRM transitions of m/z 375→161 and 375→357 were selected for MP in plasma and liver, respectively, because they were specific and abundant ion transitions compared to other ion transitions. SRM of m/z 375→161 was selected for plasma because interferences were found at the SRM of m/z 375→357 in this matrix.
3.2. Sample preparation, selectivity, and extraction recovery
The pretreatment of the plasma and liver samples proved to be very suitable for a protein-rich biological matrix. In our previous extraction method for HPLC assay of MP [16], we used a double-extraction method using hexane and methylene chloride to extract MP from plasma. Here, a one-step extraction using TBME as the solvent was selected for both plasma and liver samples. As demonstrated in Figures 2 and 3, analysis of the plasma and liver samples prepared using extraction with TBME showed no endogenous or extraneous peak interferences with MP or IS.
Fig. 2.
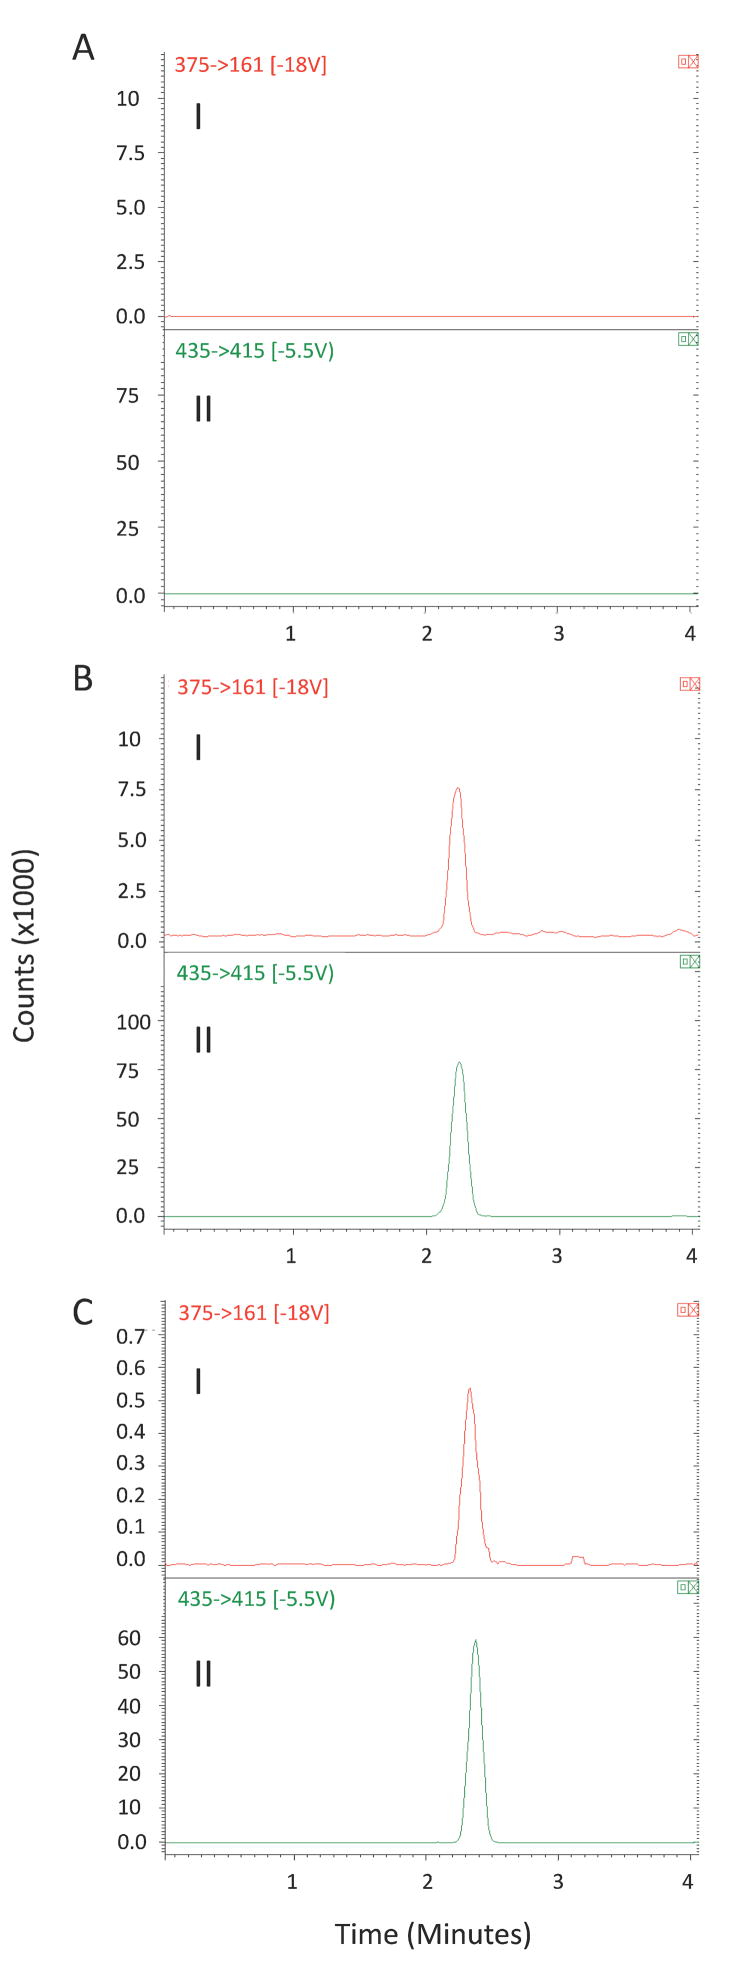
Representative SRM chromatograms (I: m/z 375 →161 for MP; II: m/z 435→415 for internal standard) for (A) blank plasma containing no internal standard; (B) a spiked plasma containing MP (200 ng/mL) and triamcinolone acetonide (500 ng/mL); (C) a plasma sample obtained 4 h after intravenous administration of DMP.
Fig. 3.
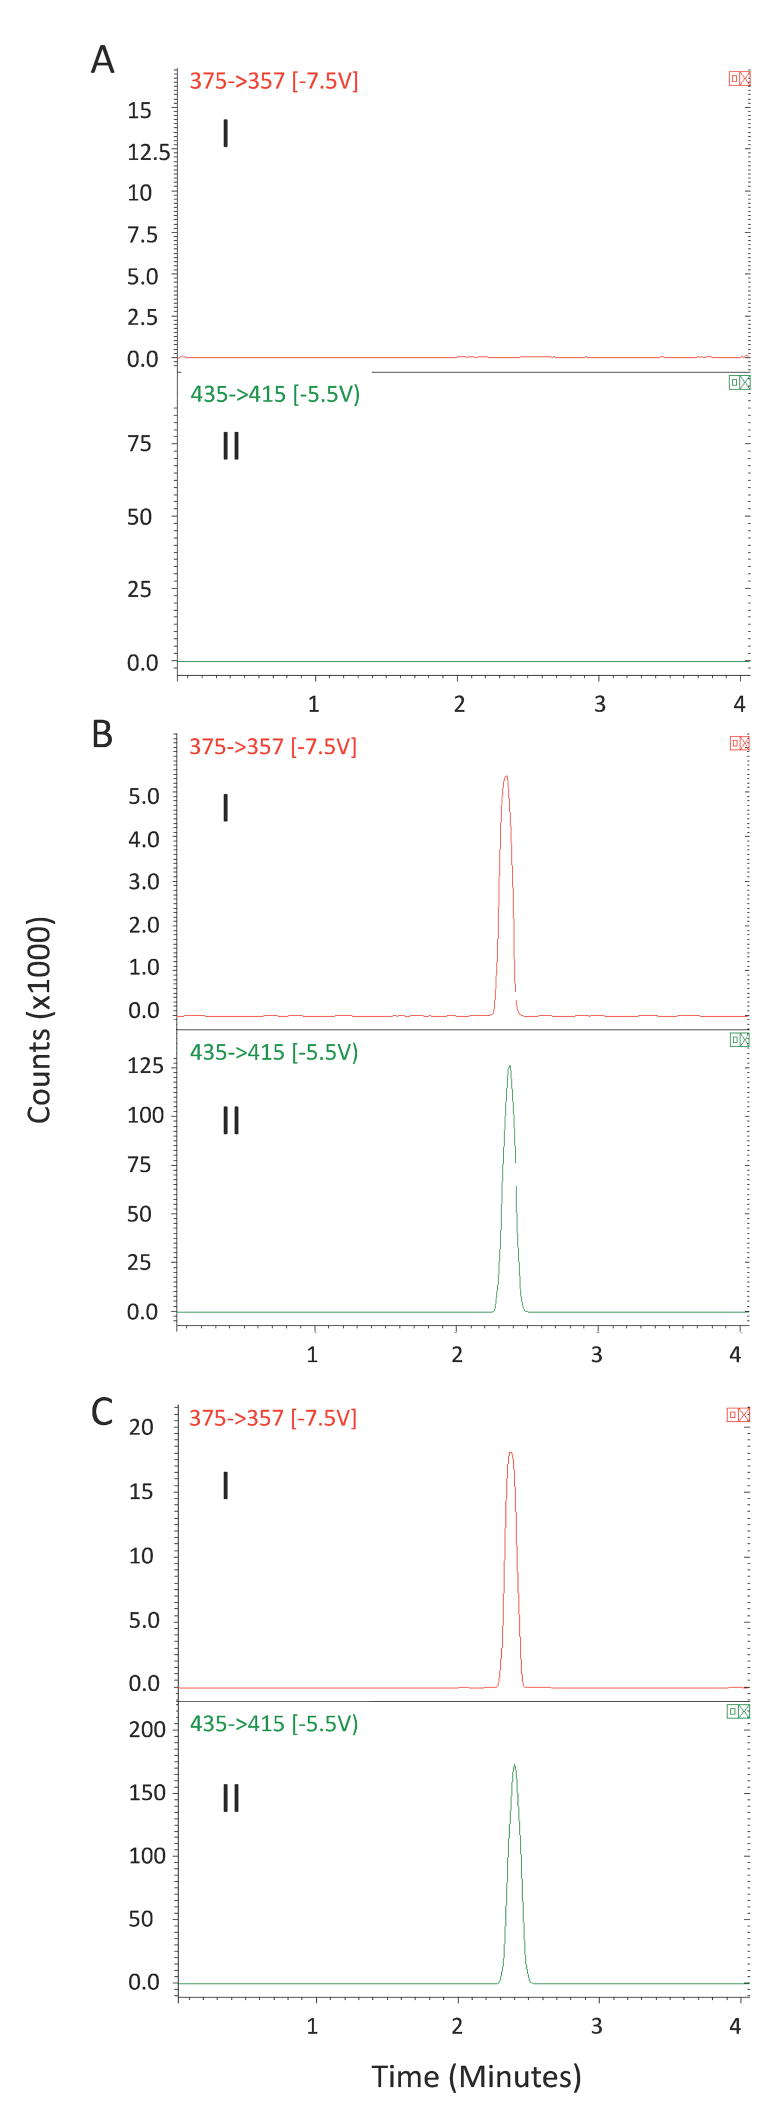
Representative SRM chromatograms (I: m/z 375 →357 for MP; II: m/z 435→415 for internal standard) for (A) blank liver homogenate containing no internal standard; (B) a spiked liver homogenate containing MP (100 ng/mL) and triamcinolone acetonide (500 ng/mL); (C) a liver sample obtained 8 h after an intravenous administration of DMP.
The mean extraction recoveries for MP in plasma were 78.3 ± 5.4% at 50 ng/ml, 79.2 ± 5.5% at 500 ng/mL, and 76.8 ± 5.7% at 2000 ng/ml. The mean recoveries for MP in liver were 80.7 ± 8.5%, 76.8 ± 6.0%, and 80.8 ± 6.6% at the concentrations of 50, 200 and 800 ng/mL, respectively. The mean recoveries for IS from plasma and liver were 86.1 ± 8.8% and 98.1 ± 12.1%, respectively. These results suggested that there was no relevant difference in extraction recovery at different concentrations of MP in plasma or liver homogenate samples. Additionally, the liquid-liquid extraction method used here may be less costly than the previously reported [12] solid-phase extraction of MP.
Chromatographic conditions may cause co-elution of endogenous compounds that are undetected by the MS-MS but may affect the ionization efficiency. Therefore, the effect of matrix on the response of the analyte was also evaluated. However, no matrix effect was detected in our study.
3.3. Linearity and lower limit of quantification
The calibration model was selected based on the analysis of the data by linear regression with intercepts and 1/x2 weighting factor. Representative linear equations for MP in plasma and liver were y = 0.000576 x − 0.00373 in the range of 20–5000 ng/mL and y = 0.00289 x − 0.0183 over the concentration range of 20–1000 ng/mL, respectively. Each standard point in every calibration curve was back calculated using its own equation. The non-zero standards showed less than 20% deviation at the 20 ng/mL concentration and less than 15% deviation at all other concentration levels. The coefficients of determination (r2) for MP in plasma and liver were ≥ 0.996. The value of LLOQ was 20 ng/mL for DMP in both plasma and liver, based on 100 μL of plasma or liver homogenate.
3.4. Accuracy and precision
The results of the accuracy and precision are presented in Table 1. The intra- and inter-day accuracy for MP at 20, 50, 500 and 2000 ng/mL levels in rat plasma fell in the ranges of 85.8–118% and 89.3–116%, and the intra- and inter-day precision (RSD) were in the ranges of 2.52–13.1% and 7.10–12.7%, respectively. The intra- and inter-day accuracies for MP at concentrations of 20, 50, 200 and 800 ng/mL in rat liver were in the ranges of 91.0–99.3% and 92.4–101%, and the intra- and inter-day precisions (RSD) were in the ranges of 2.75–12.6% and 3.61–15.2%, respectively. Theses data indicate that the repeatability, intermediate precision, and bias values of the assay are within the acceptance limits of ± 20% at LLOQ and ±15% at other concentration levels.
Table 1.
Intra- and inter-day accuracy and precision of the method for the determination of MP in plasma and liver (n = 6)
| Concentration(ng/mL) | Intra-day |
Inter-day |
|||
|---|---|---|---|---|---|
| Accuracy | RSD (%) | Accuracy | RSD (%) | ||
| Plasma | 20 | 118 | 5.60 | 116 | 10.2 |
| 50 | 103 | 13.1 | 97.7 | 12.7 | |
| 500 | 85.8 | 6.09 | 89.3 | 7.10 | |
| 2000 | 97.5 | 2.52 | 100 | 8.43 | |
| Liver | 20 | 99.3 | 12.6 | 93.4 | 15.2 |
| 50 | 91.0 | 3.73 | 92.4 | 3.76 | |
| 200 | 98.3 | 4.36 | 94.8 | 5.33 | |
| 800 | 97.5 | 2.75 | 101 | 3.61 | |
3.5. Application of the method
3.5.1. In vitro stability of the prodrug during sample preparation and/or storage
When acetic acid was added to spiked samples and samples were prepared at room temperature and analyzed without any storage, the MP values were 1.71 ± 0.17% and 1.33 ± 0.05% in plasma or liver samples, respectively. These values are close to the free MP impurity (0.83 ± 0.09%) in the DMP powder, indicating that regeneration of MP during sample preparation and analysis at room temperature is negligible in the presence of acetic acid. However, when acetic acid was not added to the samples, the measured MP levels in the freshly-prepared plasma and liver samples were 8.35 ± 0.59% and 4.76 ± 0.40%, respectively. The substantial generation of MP in plasma samples during sample preparation in the absence of acetic acid is consistent with our previous results, which demonstrated that the half-life of DMP in rat blood at 37 °C is 4.67 h [11].
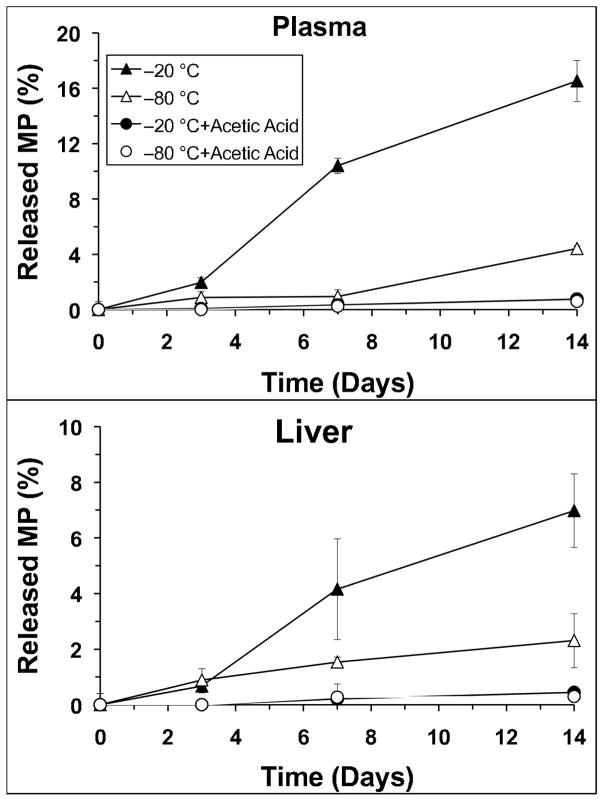
Figure 4 depicts the stability data in plasma or liver samples during storage at −20 °C or −80 °C for 14 days. These data were corrected for the MP values measured in samples analyzed without any storage (time zero). In the absence of acetic acid, significant amounts of MP were generated during the storage at −20 °C in both plasma (Fig. 4, top) and liver (Fig. 4, bottom). Reducing the storage temperature to −80 °C improved the storage stability of the conjugate, although relatively substantial amounts of MP were still generated in vitro in the absence of acetic acid. Addition of acetic acid to samples before storage almost completely prevented the in vitro generation of MP from DMP in both plasma and liver at both storage temperatures (Fig. 4) during the two-week study period. Therefore, the short-term (room temperature sample preparation) and long-term (storage at −20 or −80 °C) stability data indicate that the addition of acetic acid not only prevents hydrolysis during the storage (Fig. 4), but is also necessary for the stability of DMP during sample preparation.
Fig. 4.
The stability of DMP in (top) plasma or (bottom) liver stored with or without acetic acid at −20 °C or −80 °C. Symbols and error bars represent mean and SD values, respectively (n = 3).
3.5.2. Application to the pharmacokinetic study
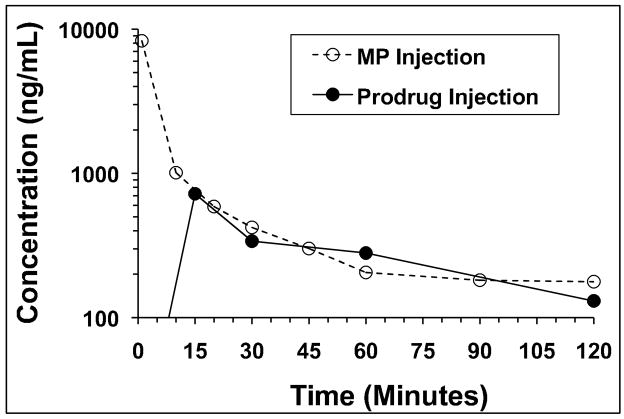
The developed assay was applied to a pharmacokinetic study after intravenous administration of either DMP or MP to rats at a dose of 5 mg/kg (MP equivalent). The plasma concentration-time profiles of MP following intravenous administration of DMP or MP are shown in Fig. 5. Additionally, the concentrations of regenerated MP in the liver at 8 hr following the administration of DMP were 573 and 707 ng/g in two rats. In contrast, no MP is measurable in the liver 8 hr after the administration of the parent drug, consistent with the rapid decline of the liver concentration of the drug after the parent drug administration [7].
Fig. 5.
The plasma concentration-time profiles of MP after single intravenous administration of DMP (closed circles) or MP (open circles) to rats at a dose of 5 mg/kg.
4. Conclusion
The pharmacokinetic analysis of MP regenerated from its prodrugs relies on a highly sensitive assay, capable of determining MP in plasma and liver at a wide concentration range after systemic administration of the prodrugs. Additionally, the relatively low concentrations of regenerated MP in the presence of much higher concentrations of the prodrug in vivo requires validated sample preparation and storage methods, which prevent the in vitro release of MP. Both of these challenges were met by the method reported here. The LC-MS/MS assay reported here has demonstrated a rapid separation and specific identification of MP from rat plasma and liver. Sample clean-up only involves a simple and short solvent extraction step, allowing sufficient sample-throughput to be applied to pharmacokinetic studies of MP. The results of the validation show that the method is reproducible and accurate. The analysis requires only 100 μL of plasma, which is advantageous in pharmacokinetic studies in small animals. Thus, the method proved to be applicable for further pharmacokinetic studies of MP regenerated from DMP. Additionally, the method may also be applied to the measurements of MP in plasma and liver samples after the administration of the parent drug.
Acknowledgments
This study was supported by a grant from the National Institute of General Medical Sciences of NIH (R01 GM069869).
Footnotes
Publisher's Disclaimer: This is a PDF file of an unedited manuscript that has been accepted for publication. As a service to our customers we are providing this early version of the manuscript. The manuscript will undergo copyediting, typesetting, and review of the resulting proof before it is published in its final citable form. Please note that during the production process errors may be discovered which could affect the content, and all legal disclaimers that apply to the journal pertain.
References
- 1.Girardin C, St-Louis G. Transplantation. 1996;62:1377. doi: 10.1097/00007890-199611150-00041. [DOI] [PubMed] [Google Scholar]
- 2.Czock D, Keller F, Rasche FM, Haussler U. Clin Pharmacokinet. 2005;44:61. doi: 10.2165/00003088-200544010-00003. [DOI] [PubMed] [Google Scholar]
- 3.Boitard C, Bach JF. Adv Nephrol Necker Hosp. 1989;18:335. [PubMed] [Google Scholar]
- 4.Asfar S, Metrakos P, Fryer J, Verran D, Ghent C, Grant D, Bloch M, Burns P, Wall W. Transplantation. 1996;61:1377. doi: 10.1097/00007890-199605150-00016. [DOI] [PubMed] [Google Scholar]
- 5.Jusko WJ, Ludwig EA, Evans WE, Schentag JJ, Jusko WJ, editors. Applied Therapeutics. Vancouver WA: 1992. Applied pharmacokinetics: principles of therapeutic drug monitoring; p. 27. [Google Scholar]
- 6.Mehvar R, Dann RO, Hoganson DA. J Control Release. 2000;68:53. doi: 10.1016/s0168-3659(00)00234-0. [DOI] [PubMed] [Google Scholar]
- 7.Zhang X, Mehvar R. J Pharm Sci. 2001;90:2078. doi: 10.1002/jps.1158. [DOI] [PubMed] [Google Scholar]
- 8.Mehvar R, Hoganson DA. Pharm Res. 2000;17:1402. doi: 10.1023/a:1007555107691. [DOI] [PubMed] [Google Scholar]
- 9.Chimalakonda AP, Mehvar R. Pharm Res. 2003;20:198. doi: 10.1023/a:1022358702643. [DOI] [PubMed] [Google Scholar]
- 10.Chimalakonda AP, Montgomery DL, Weidanz JA, Shaik IH, Nguyen JH, Lemasters JJ, Kobayashi E, Mehvar R. Transplantation. 2006;81:678. doi: 10.1097/01.tp.0000177654.48112.b6. [DOI] [PMC free article] [PubMed] [Google Scholar]
- 11.Penugonda S, Kumar A, Agarwal HK, Parang K, Mehvar R. J Pharm Sci. 2008;97:2649. doi: 10.1002/jps.21161. [DOI] [PMC free article] [PubMed] [Google Scholar]
- 12.DiFrancesco R, Frerichs V, Donnelly J, Hagler C, Hochreiter J, Tornatore KM. J Chromatogr B Analyt Technol Biomed Life Sci. 2007;859:42. doi: 10.1016/j.jchromb.2007.09.003. [DOI] [PubMed] [Google Scholar]
- 13.Vree TB, Maljers L, VandenBorg N, Nibbering NMM, VerweyVanWissen CPWGM, Lagerwerf AJ, Maes RAA, Jongen PJH. J Pharm Pharmacol. 1999;51:1155. doi: 10.1211/0022357991776697. [DOI] [PubMed] [Google Scholar]
- 14.Mazzarino M, Botre F. Rapid Commun Mass Spectrom. 2006;20:3465. doi: 10.1002/rcm.2729. [DOI] [PubMed] [Google Scholar]
- 15.Kong AN, Jusko WJ. J Pharm Sci. 1991;80:409. doi: 10.1002/jps.2600800502. [DOI] [PubMed] [Google Scholar]
- 16.Mehvar R, Dann RO, Hoganson DA. J Pharmaceut Biomed Anal. 2000;22:1015. doi: 10.1016/s0731-7085(00)00253-3. [DOI] [PubMed] [Google Scholar]


