Abstract
Chromogranin A (CHGA), a protein released from secretory granules of chromaffin cells and sympathetic nerves, triggers endothelin-1 release from endothelial cells. CHGA polymorphisms associate with an increased risk for ESRD, but whether altered CHGA–endothelium interactions may explain this association is unknown. Here, CHGA led to the release of endothelin-1 and Weibel–Palade body exocytosis in cultured human umbilical vein endothelial cells. In addition, CHGA triggered secretion of endothelin-1 from glomerular endothelial cells and TGF-β1 from mesangial cells cocultured with glomerular endothelial cells. In humans, plasma CHGA correlated positively with endothelin-1 and negatively with GFR. GFR was highly heritable in twin pairs, and common promoter haplotypes of CHGA predicted GFR. In patients with progressive hypertensive renal disease, a CHGA haplotype predicted rate of GFR decline. In conclusion, these data suggest that CHGA acts through the glomerular endothelium to regulate renal function.
Chromogranin A (CHGA) is the major soluble protein released from secretory granules of chromaffin cells and sympathetic nerves,1 in which it is costored and coreleased with catecholamines. Increased serum CHGA has been detected not only in patients with essential hypertension2 but also hypertensive consequences such as cardiac3 or renal4 failure.
In hypertensive ESRD, we recently reported that genetic polymorphism at CHGA influenced disease risk/susceptibility5. We also found a correlation between endothelin-1 (EDN1) and CHGA secretion; we then determined that the CHGA locus is a trans-quantitative trait locus for EDN1 secretion and found that CHGA itself can trigger EDN1 release from endothelial cells.6
EDN1 may play multiple roles in chronic kidney disease, such as elevating intraglomerular pressure7,8 and triggering renal interstitial fibroblasts to proliferate with increased extracellular matrix production9. Could EDN1 secretion provide a mechanistic link between CHGA and renal dysfunction?
Here, we explored the mechanism of CHGA action on EDN1 secretion from endothelial cells and investigated the effects of the association of CHGA and EDN1 on renal traits. Our results suggest a glomerular pathway whereby CHGA may alter renal function.
RESULTS
Human CHGA Triggers Secretion of EDN1 from Endothelial Cells
CHGA Regions and EDN1 Release
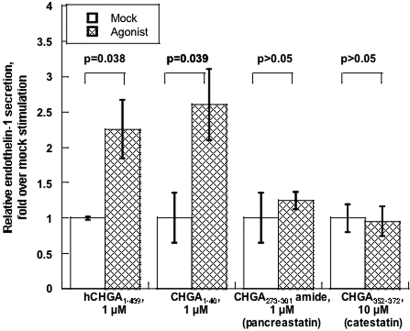
First, we tested which region of CHGA could induce the secretion of EDN1 from cultured human umbilical vein endothelial cells (HUVECs). Human CHGA1–439 (full-length), CHGA1–40 (the amino terminus), CHGA273–301-amide (pancreastatin), and catestatin (CHGA352–372) were tested for 15 min. Either full-length CHGA (P = 0.038) or CHGA1–40 (P = 0.039) induced EDN1 release, whereas neither pancreastatin nor catestatin were effective (Figure 1).
Figure 1.
CHGA region-specific stimulation of EDN1 release from HUVECs. Release of EDN1 from unstimulated control cells was set as 100%. Data are shown as fold stimulation over mock (buffer alone) results. Results are presented as mean ± SEM over three measurements.
Time Course of Release and Dose/Response
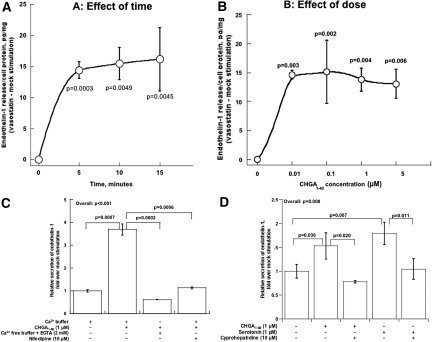
We conducted dose/response (10 to 5000 nM) and time course (5 to 15 min) experiments. CHGA1–40-mediated release of EDN1 was maximal by 5 min of exposure, at 10 nM peptide (Figure 2, A and B). In other experiments,6 full-length CHGA1–439 at concentrations down to 10 nM was effective at releasing EDN1.
Figure 2.
CHGA1–40-induced secretion of EDN1 from human endothelial cells. (A) Effect of time. Results are presented as mean ± SEM over three measurements. Data are shown as net EDN1 release (CHGA1–40 minus mock stimulation). HUVECs were incubated with 1 μM CHGA1–40 for the indicated times. (B) Effect of dose. Results are presented as mean ± SEM over three measurements. Data are shown as net EDN1 release (CHGA1–40 minus mock stimulation). HUVECs were incubated with the indicated concentrations of CHGA1–40 for 15 min. (C) Dependence on extracellular calcium. HUVECs were incubated for 15 min with the indicated concentrations of CHGA1–40, with or without calcium in the medium. Release of EDN1 from unstimulated controls was set as 100%. Data are shown as fold release over control. Results are presented as mean ± SEM over three measurements. (D) Probing a serotonin pathway. HUVECs were incubated for 15 min with the indicated concentrations of agonists (CHGA1–40 or serotonin), with or without serotonin antagonist (cyproheptadine). Release of EDN1 from unstimulated controls was set as 100%. Data are shown as fold release over control. Results are presented as mean ± SEM over three measurements.
Dependence of Release on Extracellular Calcium
To probe the role of calcium in secretion of EDN1, we treated HUVECs with CHGA1–40 in either the presence or absence of extracellular calcium, with or without the L-type voltage-gated calcium channel antagonist nifedipine. Blockade of calcium entry, by either removal of calcium from the incubation buffer or inclusion of the dihydropyridine, reduced the amount of EDN1 released by CHGA1–40-stimulated cells (Figure 2C).
Blockade of Release by a Serotonin Antagonist
Because serotonin is a potent stimulus to EDN1 release by endothelial cells, we explored whether serotonin receptors mediate CHGA1–40 induction of EDN1 secretion. Both CHGA1–40 and serotonin itself triggered EDN1 release, and each response was blocked by cyproheptadine (Figure 2D).
CHGA and the Weibel–Palade Body
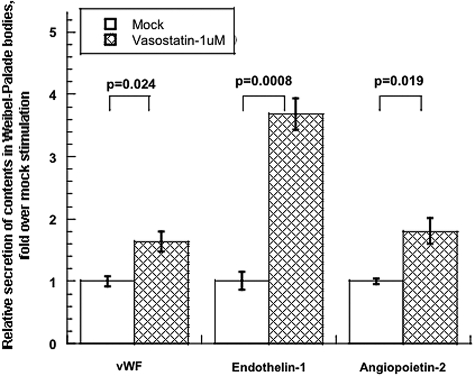
Weibel–Palade bodies are storage vesicles for multiple endothelial cell secretory products, including not only EDN1 but also von Willebrand Factor (vWF), angiopoietin-2, and P-selectin. We therefore tested whether the secretion of such other peptides in HUVECs could be activated by CHGA1–40. EDN1, vWF, and angiopoietin-2 were coreleased in response to CHGA1–40 (Figure 3).
Figure 3.
CHGA1–40 induces secretion of multiple Weibel–Palade body constituents from HUVECs. Basal release of indicated constituents from unstimulated controls was normalized to 100%. Data are shown as fold stimulation over control. Results are presented as mean ± SEM over three measurements for 15 min.
CHGA1–40 Induces Secretion of EDN1 from Mouse Glomerular Endothelial Cells
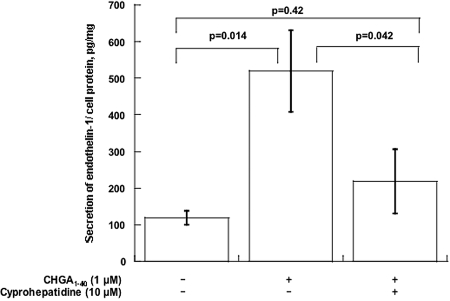
Mouse glomerular endothelial cells in culture were incubated with or without CHGA1–40 (1 μM) for 24 h. In this setting, CHGA1–40 provoked secretion of EDN1, an action blocked by the serotonin antagonist cyproheptadine (Figure 4).
Figure 4.
CHGA1–40 induces EDN1 secretion from MGENCs. Mouse glomerular capillary endothelial cells were incubated with the indicated concentrations of CHGA1–40, with or without cyproheptadine (serotonin antagonist), for 24 h. Data are shown as EDN1 normalized to cell protein. Results are presented as mean ± SEM over three measurements.
Human CHGA1–40 Induces TGF-β-1 Secretion from Mesangial Cells
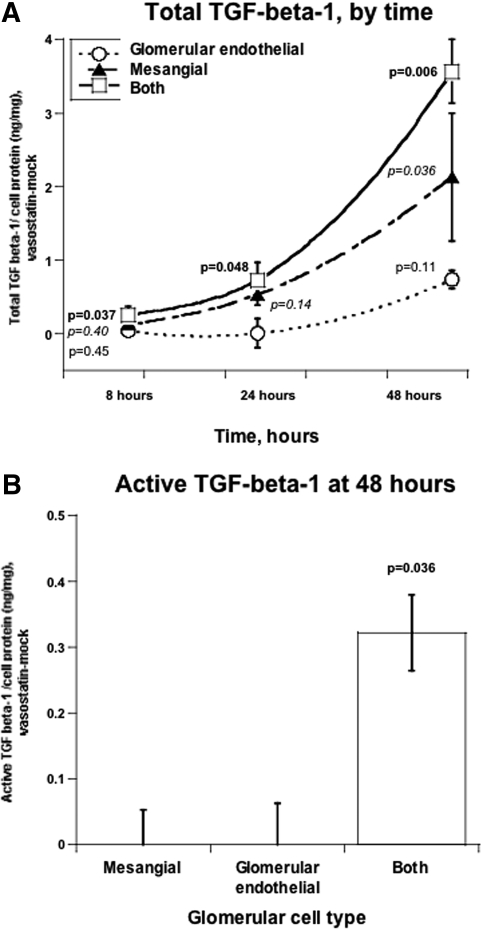
When mesangial cells were cultured alone, CHGA1–40 increased secretion of total TGF-β-1 only by 48 h (P = 0.036). However, when mesangial and glomerular endothelial cells were cocultured, the increase of TGF-β-1 was apparent by 8 to 24 h and substantially greater at 48 h (Figure 5A). Only in the setting of coculture did activated TGF-β-1 increase in response to CHGA at 48 h of coculture (P = 0.036, Figure 5B). We also tested activated TGF-β-1 at 8 and 24 h of coculture; however, activated TGF-β-1 was beneath the detection limit at these earlier time points.
Figure 5.
CHGA1–40 induces TGF-β-1 secretion from MMCs. Mouse mesangial cells were cocultured (see Concise Methods), with or without a MGENC layer, and incubated with CHGA1–40 (1 μM) for the indicated times. Data are shown as net TGF-β-1 release (CHGA1–40 minus mock stimulation). (A) Total TGF-β-1, by time. Release of total TGF-β-1 was measured at different time points. (B) Active TGF-β-1 at 48 h. Release of active TGF-β-1 was measured at 48 h.
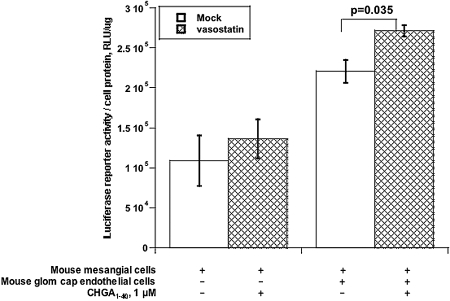
To probe whether the TGF-β-1 secreted in response to CHGA1–40 was functional, we transfected the p3TP-Lux reporter for TGF-β-1 signal transduction10 into mesangial cells, followed by CHGA1–40 (or mock) stimulation for 72 h. When mesangial cells were cultured alone, no CHGA1–40 stimulation of p3TP-Lux activity was detected. However, during coculture of glomerular mesangial and endothelial cells, p3TP-Lux activity was augmented and further stimulated by CHGA1–40 (P = 0.035, Figure 6).
Figure 6.
CHGA1–40 increases TGF-β-1-responsive p3TP-Lux activity in coculture of mouse mesangial and endothelial cells. Only the mesangial cell layer was transfected with p3TP-Lux, then cocultured with or without an endothelial cell layer (separated by a semipermeable membrane), and incubated with CHGA1–40 for 72 h. Luciferase activity was normalized to cell protein. 3TP, a chimeric promoter with three TPA (phorbol ester) response elements upstream of a plasminogen activator inhibitor 1 promoter; Lux, luciferase reporter.
CHGA, GFR, and Endothelin In Vivo: Studies in Healthy Twin and Sibling Pairs without Renal Disease
We tested the association of CHGA secretion with EDN1 or renal traits in a large series of twin and sibling pairs, each with normal renal function (plasma creatinine ≤1.5 mg/dl). Plasma CHGA (at h2 = 45 ± 12%, P < 0.0001), plasma EDN1 (at h2 = 58 ± 5%, P < 0.0001), and GFR (at h2 = 78 ± 3%, P < 10−25) were each substantially heritable.6,11 Plasma CHGA was positively correlated with EDN1 (ρ = 0.212, n = 707, P < 0.001) and negatively correlated with GFR (ρ = −0.201, n = 696, P < 0.001, Table 1).
Table 1.
CHGA correlations (nonparametric, Spearman rank) with human endothelial and renal traitsa
| CHGA (nM) | EDN1 (pg/ml) | GFR (ml/min per1.73 m2) | |
|---|---|---|---|
| CHGA (nM) | |||
| Correlation coefficient | 1.0 | 0.212 | −0.201 |
| Significance (two-tailed) | − | <0.001 | <0.001 |
| N | 714 | 707 | 696 |
| EDN1 (pg/ml) | |||
| Correlation coefficient | 1.0 | −0.054 | |
| Significance (two-tailed) | − | 0.150 | |
| N | 754 | 700 | |
| GFR (ml/min per 1.73 m2) | |||
| Correlation coefficient | 1.0 | ||
| Significance (two-tailed) | − | ||
| N | 706 |
Subjects were twins and siblings. Each individual had normal renal function (plasma creatinine ≤1.5 mg/dl).
When individuals were stratified into quantiles above and below the median plasma CHGA concentration (±3.4 nM CHGA; Online Figure 1 and Table 2), both plasma EDN1 concentration and GFR aggregated with CHGA group: The higher CHGA group (n = 341) displayed higher EDN1 (by approximately 0.2 pg/ml, P = 0.021) and lower GFR (by approximately 9 ml/min per 1.73 m2, P = 3.44 × 10⁻⁵).
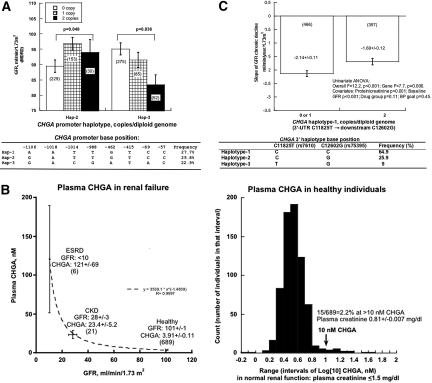
We then investigated whether the common genetic variation across the CHGA locus influences the GFR trait. As previously reported, 12 there were three blocks of linkage disequilibrium across the locus (Online Figure 2), with the most 5′ block encompassing the promoter. Eight common single nucleotide polymorphism (SNP) variants in the CHGA proximal promoter (within block 1) formed haplotypes that influenced GFR in white twins and siblings: Copy number of promoter haplotype-2 (GATTGTCC; P = 0.048) and haplotype-3 (GACGATAC; P = 0.036) influenced GFR (Figure 7A), with haplotype-3 dose-dependently associated with lower GFR. Thus, quantitative change in CHGA, driven by promoter variation, seems to underlie changes in GFR and endothelin.6 Might such variation also change processing of CHGA to its bioactive peptide? We13 and Stridsberg et al.14 have observed a reciprocal relationship between the circulating concentrations of CHGA and its fragments, likely reflecting processing of the prohormone to its active fragments in plasma.
Figure 7.
CHGA and GFR in vivo. (A) CHGA promoter common haplotypes: Effects on GFR in twin and sibling pairs. Haplotypes were inferred from eight common SNPs spanning the proximal promoter (see inset). Individuals included in this marker-on-trait analysis are of European ancestry. GFR was estimated by the Modification of Diet in Renal Disease algorithm and presented as mean ± SEM. Statistical significance was tested by generalized estimating equation. (B) Plasma CHGA in renal disease and healthy individuals. Left: Plasma CHGA in ESRD (GFR <10 ml/min), CKD (GFR 28 ± 3 ml/min), and healthy individuals (twins and siblings; GFR 101 ± 1 ml/min). Plasma CHGA rises exponentially as GFR declines. Right: Plasma CHGA distribution (frequency histogram) in healthy individuals (twins and siblings; plasma creatinine ≤1.5 mg/dl). To accommodate outliers, values were Log10-transformed. Plasma CHGA was present at ≥10 nM (a dose which can trigger Weibel–Palade body exocytosis) even in approximately 2% of subjects with normal renal function. (C) CHGA 3′ genetic variation: Effects on GFR decline in black hypertensive renal disease (NIDDK AASK). The dependent variable is chronic decline in GFR (i.e., GFR slope, in ml/min per 1.73 m2), measured by serial [125I]-iothalamate clearance, beginning 3 mo after initiation of the trial. All subjects are plotted, including those with both minimal proteinuria (≤0.22 g/g) and detectable proteinuria (>0.22 g/g).
Although CHGA promoter haplotypes predicted GFR (Figure 7A), the individual SNPs did not, despite the fact that haplotype-3 differs from haplotypes-1 and -2 at positions −1014, −988, −462, and −89, raising the likelihood of functionally synergistic/nonadditive SNP-by-SNP interactions within the proximal promoter. Indeed, using promoter/reporter plasmids, we have found that at least five of the CHGA promoter variants (including −1014, −988, −462, −415, and −89) alter luciferase reporter activity.12,15
CHGA and GFR in Renal Disease
Renal Failure
Plasma CHGA was measured across a spectrum of renal function. Plasma CHGA rose systematically as renal function declined (Figure 7B), from healthy individuals (GFR 101 ± 1 ml/min), to subjects with chronic kidney disease (CKD, GFR 28 ± 3 ml/min), to subjects with ESRD (GFR <10 ml/min); indeed, the rise was exponential with fall in GFR. In all subjects with renal insufficiency (CKD or ESRD), CHGA was elevated to >10 nM, a concentration that triggered Weibel–Palade body exocytosis.6
We evaluated the frequency distribution of plasma CHGA values in subjects with normal renal function (Figure 7B). In these subjects with serum creatinine averaging 0.81 ± 0.007 mg/dl, CHGA values (mean 3.9 ± 0.1 nM) were unimodally distributed, although skewed toward higher values. In these healthy subjects with unimpaired renal function, approximately 2.2% exhibited CHGA >10 nM, an active concentration for Weibel–Palade body exocytosis (Figure 3).6
Progressive Renal Disease: Hypertensive Nephrosclerosis
In 830 subjects from the National Institute of Diabetes and Digestive and Kidney Diseases (NIDDK) African American Study of Kidney Disease and Hypertension (AASK) trial, the slope of chronic (post-3-mo) decline of GFR was influenced by genetic variation at CHGA, with the most prominent effect (P = 0.006) from haplotype-1 in the 3′-haplotype block (Figure 7C). The effect was also seen for diploid haplotype pairs in that block (P = 0.007). The effect persisted during permutation testing (P = 0.033) and was also seen in the subset of individuals with lower proteinuria (≤0.22 g/g at entry (n = 579, P = 0.041).
To probe the role of treatment group or BP goal, we included these as covariates, but they did not influence the effect of haplotype on GFR slope (Figure 7C). We explored whether diploid genotypes at CHGA were equally distributed among the three drug groups; in three-by-three genotype-by-drug contingency tables, there was no deviation from the null expectation for the associated haplotypes (χ2 = 5.592; P = 0.99).
To explore the potential role of genetic admixture, 126 biallelic markers were genotyped in the entire cohort. Generalized analysis of molecular variance (GAMOVA) analysis indicated that people with similar predictor variables (GFR slope, ml/min per 1.73 m2/yr) were not genetically more related to each other than expected by chance alone, in either all subjects (P = 0.45) or those with lower proteinuria (P = 0.87). Therefore, the specific haplotype differences in GFR slope trait means that we observed cannot be attributed to differential admixture between the higher and lower GFR decline rate groups.
DISCUSSION
Overview
A role for the sympathetic nervous system in progression of renal failure (as well as control of renal function) is increasingly appreciated.16–20 Targeted ablation studies suggest that CHGA plays a catalytic role in the formation of catecholamine storage vesicles.21,22 In light of genetic association of CHGA with hypertensive ESRD,5 the objective of the present study was to characterize how CHGA can influence renal function. Here, we found that CHGA induced calcium-dependent secretion of all Weibel-Palade body constituents (including EDN1) from the endothelium and the effect mapped to the CHGA amino terminus (CHGA1–40). CHGA increased TGF-β-1 secretion from mesangial cells, especially in the presence of glomerular endothelial cells. Plasma CHGA correlated directly with EDN1 and inversely with GFR, and CHGA promoter haplotypes predicted GFR in humans. The results suggest that CHGA may influence glomerular function by a pathway initiating in the endothelium.
CHGA and EDN1
The amino terminus of CHGA gives rise to the “vasostatin” domains, including the conserved (across species) CHGA1–76 and CHGA1–113 domains.23,24 Synthetic CHGA1–40 spans the very hydrophobic disulfide-bounded domain of the molecule: C17IVEVISDTLSKPSPMPVSQEC38. A new range of physiologic/pharmacologic functions have been reported for this region in recent years,25 including effects on the endothelium.26 In this study, CHGA1–40 reproduced the novel endothelial function of triggering EDN1 secretion,6 whereas other fragments of CHGA, such as pancreastatin (CHGA273–301) and catestatin (CHGA352–372) did not show this action.
CHGA-induced EDN1 secretion arrived at a maximum by approximately 5 min, suggesting post-translational release from a storage pool. Weibel–Palade bodies are the principal endothelial storage vesicles for EDN1; here we found that CHGA induced secretion of not only EDN1 but also multiple other Weibel–Palade body constituents (vWF and angiopoietin-2), suggesting exocytosis (all-or-none corelease) of the entire Weibel–Palade body. Increments of cytoplasmic calcium are important for Weibel–Palade body secretion27; consistent with this observation, we noted that CHGA-evoked EDN1 secretion was inhibited when extracellular calcium entry was blocked by either removal of calcium from the medium or by a calcium channel antagonist (Figure 2C).
The precise mechanism whereby CHGA triggers Weibel–Palade body exocytosis has not been established, but serotonin triggered similar transmitter release (Figure 2D), and the 5-HT receptor antagonist cyprohepatidine blocked the effects of both serotonin and CHGA1–40. However, although cyproheptadine is best characterized as a serotonin 5-HT2 (G protein-coupled receptor) receptor antagonist, it may also function as an antihistaminic and calcium channel antagonist. Although Schluter and Bohnensack28 reported that serotonin-induced vWF secretion from HUVECs does not require increased cytoplasmic calcium, CHGA might act on a different 5-HT receptor subtype, such as 5-HT3, which is a 5-HT-gated cation channel.29
Glomerular capillary endothelial cells represent a highly differentiated subset of endothelial cells, although their Weibel–Palade bodies are less well studied than those in large vessel endothelial cells.30 Such cells are clearly a major local source of EDN1,31 and CHGA induction of EDN1 secretion by cultured glomerular endothelial cells (Figure 4) suggests a direct intrarenal action of CHGA.
CHGA and TGF-β-1
The cytokine TGF-β-1 and EDN1 play reciprocal profibrotic actions in the kidney.32 CHGA induced secretion of total TGF-β-1 from mesangial cells by 48 h (Figure 5A), although we could not detect an increment in activated TGF-β-1 from these cells alone (Figure 5B). By 48 h, the increment of total TGF-β-1 in the renal (mesangial/endothelial) coculture group was greater than the sum of endothelial plus mesangial cells in isolation, suggesting a synergistic response by glomerular cell types, borne out by the unique appearance of activated TGF-β-1 only upon coculture (Figure 5B). The synergistic action of the two cultured glomerular cell types on TGF-β-1 secretion (Figure 5, A and B), coupled with the experimental design of membrane-separated cell types, suggests that a soluble mediator such as EDN1 mediates the cell-by-cell interaction.
The p3TP-Lux vector couples three TPA (phorbol ester) response elements to a plasminogen activator inhibitor 1 promoter, giving rise to a reagent widely used as a probe of TGF-β-1 signaling.10 Mesangial cell p3TP-Lux activity was augmented by coculture with glomerular endothelial cells (Figure 6), and the presence of endothelial cells permitted an increment in p3TP-Lux activity in response to CHGA. Thus, TGF-β-1 released by CHGA seems to yield the typical signaling profile of that cytokine.
CHGA in the Regulation of GFR: Clinical Implications
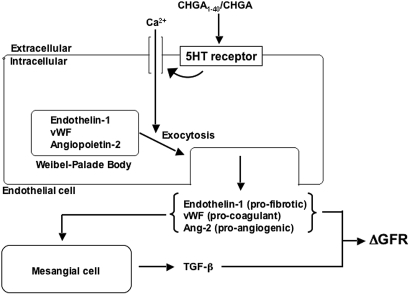
In healthy individuals, the CHGA, EDN1, and GFR traits were each highly heritable, the CHGA trait correlated with both EDN1 and GFR (Table 2), and the range of normal plasma CHGA concentrations (Figure 7C) overlapped the range that could trigger Weibel–Palade body exocytosis (Figure 3).6 A heritable, genetic influence of CHGA upon the GFR trait is suggested by effect of CHGA common haplotypes upon GFR (Figure 7A). Lack of a significant correlation between EDN1 and GFR (Table 1) suggests that factors other than EDN1 act to influence GFR; indeed, we identified CHGA-induced release of other endothelial mediators that could influence renal function (Figure 8), including the procoagulant vWF and the proangiogenic angiopoietin-2.
Table 2.
CHGA secretion in vivo as a predictor of EDN1 and GFR in humansa
| CHGA Quantiles
|
P (two-tailed) | ||||
|---|---|---|---|---|---|
| Lower (<3.4 nM)
|
Higher (≥3.4 nM)
|
||||
| N | Mean ± SEM | N | Mean ± SEM | ||
| Demographic | |||||
| Sex (M/F) | 349 | 92/257 | 341 | 84/257 | 0.187 |
| Ethnicity (white/black/other) | 349 | 213/32/104 | 341 | 245/30/66 | 0.038 |
| BP status (NT/HT) | 347 | 311/36 | 341 | 303/38 | 0.614 |
| FH (+/−/unknown) | 348 | 186/130/32 | 341 | 173/133/34 | 0.758 |
| Age (yrs) | 349 | 37.3 ± 0.8 | 341 | 40.9 ± 0.9 | 0.002 |
| Physiological | |||||
| SBP (mmHg) | 333 | 131.1 ± 0.9 | 327 | 130.2 ± 0.9 | 0.481 |
| DBP (mmHg) | 333 | 72.2 ± 0.6 | 327 | 71.1 ± 0.5 | 0.161 |
| HR (beats/min) | 333 | 70.0 ± 0.6 | 327 | 70.2 ± 0.7 | 0.736 |
| GFR (MDRD, ml/min per 1.73 m2) | 349 | 104.8 ± 1.5 | 341 | 96.1 ± 1.4 | 3.44 × 10⁻⁵ |
| Biochemical | |||||
| Plasma CHGA (nM) | 349 | 2.73 ± 0.02 | 341 | 5.12 ± 0.21 | 1.01 × 10⁻²⁸ |
| Plasma EDN1 (pg/ml) | 347 | 1.31 ± 0.05 | 338 | 1.52 ± 0.07 | 0.021 |
NT/HT, normotensive/hypertensive; FH, family histories for hypertension (in a first-degree relative before the age of 60 yr); SBP, systolic BP; DBP, diastolic BP; HR, heart rate.
Figure 8.
CHGA: Model for actions on endothelial cell secretion and renal function. The diagram presents a hypothetical framework synthesizing the results of experiments on cultured cells and studies in humans.
Finally, in subjects with progressive renal disease (Figure 7C), CHGA genetic variation predicted an increased rate of decline in GFR. Why did a promoter block of CHGA best predict GFR in healthy individuals (Figure 7A), whereas a 3′ block best predicted GFR decline in subjects with renal dysfunction (Figure 7C)? Functional studies of genetic variants in these CHGA domains have now established that variants in both the proximal promoter12 and the 3′ untranslated region5 are functional and capable of influencing disease traits. In our previous case/control studies of hypertensive renal disease, 3′ untranslated region variation was best associated with ESRD,5 whereas promoter variation resulting in alterations of nuclear hormone receptor transactivation may influence BP.12
Conclusions and Perspectives
Our data suggest that CHGA, although initially studied as a regulator of catecholamine storage and release, also seems to play a role in endothelial function, including cellular actions in the glomerulus. Such direct glomerular actions suggest a pathway whereby common genetic variation at the CHGA locus influences renal function, in healthy individuals and those with renal disease. Such findings point to new approaches to the pathophysiology, diagnosis, staging, treatment, and prognosis of hypertensive renal disease.
CONCISE METHODS
Reagents: Proteins and Peptides
Full-length recombinant human CHGA was expressed in Escherichia coli and purified by its 6-His affinity tag, as described previously; the resulting protein was homogeneous by SDS-PAGE and had the expected mass by matrix-assisted laser desorption ionization (MALDI) mass spectrometry as well the expected amino-terminal sequence by an automated Edman procedure.33 Human CHGA synthetic fragments spanning amino acids 1 to 40 (the amino terminus), 352 to 372 (catestatin), and 273 to 301-amide (pancreastatin-amide) were synthesized by the solid-phase method and purified to >90% homogeneity by reverse-phase HPLC on C-18 columns, then evaluated analytically by diagnostic HPLC and mass spectrometry. CHGA1–40 was allowed to disulfide-cyclize at its two endogenous Cys residues (Cys17 and Cys38) at room temperature and neutral pH in aqueous buffer; disulfide cyclization was verified by MALDI mass spectrometry, confirming loss of 2H mass.
Cell Culture, Secretion, and Transfection
Primary HUVECs were purchased from Vec Technologies and grown in culture medium MCDB131. Cells were grown in 75 cm2 flasks, and passage 3 cells were split into 12-well culture dishes and subsequently stimulated for the indicated times and concentrations of secretagogue in Krebs–Ringer buffer (125 mM NaCl, 5 mM KCl, 1 mM Na3PO4, 1 mM MgSO4, 2 mM CaCl2, 5.5 mM glucose, 20 mM Hepes, pH 7.4). EDN1, vWF, and angiopoietin-2 were measured in the culture supernatants by ELISA.
Mouse glomerular capillary endothelial cells (MGENCs), derived from tsA58 mice bearing the temperature-sensitive SV40 large T antigen, were a gift from Drs. Nese Akis and Janos Peti-Peterdi (University of Southern California).34 Cells were grown in DMEM with 25 mM Hepes and 7.5% FBS and then split to 12-well culture dishes for 24 h before secretion assay of EDN1.
Mouse mesangial cells (MMCs), from mice bearing an SV40 early region (large T antigen) transgene, were purchased from the American Type Culture Collection (CRL-1927) and grown in the recommended medium (3:1 mixture of DMEM and Ham's F12, with 14 mM Hepes and 5% FBS). Mouse mesangial cells were transfected (at 50 to 60% confluence) with 1 μg of p3TP-Lux, encoding a luciferase reporter under the control of a TGF-β-1-responsive “3TP” promoter that contains three consecutive TPA (phorbol ester) response elements and a portion of the plasminogen activator inhibitor 1 promoter region,10 by the cationic liposome method (Superfect; Qiagen, Valencia, CA).
Cell culture inserts (Corning Transwell polyester membrane inserts, pore size 0.4 μm) were used for coculture of MMCs and MGENCs. Mouse glomerular capillary endothelial cells were grown on the lower layer with complete medium (2 to 2.5 ml), whereas MMCs were grown on the upper layer (inserts) with complete medium (1 to 1.5 ml).
TGF-β-1 Secretion Experiments
For MMCs cultured alone, cells were grown on 12-well culture dishes until 60% confluence, and serum-free medium was added overnight, whereupon the indicted concentration of CHGA1–40 was added. The culture supernatant was collected at indicated time points to measure TGF-β-1. For cocultured MMCs and MGENCs, cells at 60% confluence were treated with serum-free medium overnight, and CHGA1–40 was added in the lower layer for the indicated time points. Culture supernatant in the upper layer was collected to measure TGF-β-1.
TGF-β-1-Responsive Transcription Experiments: 3TP-Lux Activity Assay
Mouse mesangial cells were transfected (at 50 to 60% confluence) with 1 μg of p3TP-Lux10 by the cationic liposome method (Superfect, Qiagen) and then treated with or without CHGA1–40 (1 μM) for 72 h as described for MMCs or MMC/MGENC coculture. The firefly luciferase activities in the cell lysates were measured, and the results were expressed as the ratio of firefly/cell protein activity. Each experiment was repeated a minimum of three times.
Assays
EDN1
Plasma EDN1 and EDN1 in cell culture supernatants were measured using the QuantiGlo human/mouse EDN1 sandwich luminescent immunoassay method (R&D Systems, Minneapolis, MN), based on a human ET-1 21-mer cyclic synthetic peptide epitope (CSCSSLMDKECVYFCHLDIIW). The assay recognizes both natural and synthetic human ET-1. Pertinent molar percentage cross-reactivities were: human big-ET-1 (38 amino acid form), 0.02%; human endothelin-2, 27.4%; human endothelin-3, 7.8%; human big endothelin-2, 0.01%. The typical intra-assay coefficient of variation was 1.5 to 2.5%, whereas the interassay coefficient was 5.4 to 10.2%. Typical ET-1 recovery from serum was 92%. The typical lower limit of detection was <0.16 pg/ml.
vWF
vWF in supernatants was measured by an ELISA based on human vWF (American Diagnostica, Stamford, CT), with a working range of 0.5 to 10 mU/ml and a lower limit of detection of 0.1 mU/ml (where 1 mU = approximately 10 ng).
Angiopoietin-2
Angiopoietin 2 in supernatants was measured with an ELISA based on the human protein (R&D Systems). The assay sensitivity was approximately 8 pg/ml and displayed a log-linear range over 50 to 3000 pg/ml. Average recovery of exogenous antigen added to media was 103%. Assay coefficients of variation were: intra-assay, 4 to 7%; interassay, 7 to 10%. The assay equivalently recognizes natural and recombinant human angiopoietin-2, but other cytokines do not cross-react, even at concentrations of 50 ng/ml.
TGF-β-1
TGF-β-1 was measured in cell culture supernatants by ELISA (R&D Systems). Both total TGF-β-1 and active TGF-β-1 (activated with 1 N HCl and then neutralized with 1.2 N NaOH/0.5 M Hepes) were tested in each sample. The assay sensitivity was approximately 4.6 pg/ml and displayed a log-linear range over 31 to 2000 pg/ml. Average recovery of exogenous antigen added to media was 105%. Assay coefficients of variation were: intra-assay, 2 to 3%; interassay, 6 to 8%. The assay equivalently recognizes natural and recombinant mouse TGF-β-1, but other cytokines do not cross-react, even at concentrations of 50 ng/ml.
CHGA in Human Plasma
EDTA-anticoagulated plasma was frozen and stored at −70°C before assay. A RIA based on polyclonal rabbit antisera to epitope CHGA116–439 also cross-reacts with full-length human CHGA1–439.35–37 [125I]-radiolabeling of the protein was enabled by endogenous Tyr residues. The CHGA RIA has been described in detail elsewhere.35–37
Healthy Individuals: Twin and Sibling Pairs
There were 690 individuals: 176 males and 514 females; 458 white, 62 black, and 270 of other ethnicities; 516 twins (176 monozygotic pairs and 82 dizygotic pairs) and 174 siblings of twins or members of other sibships. Ages were 15 to 84 yrs old. Eleven percent of the individuals had essential hypertension. Six-hundred-fourteen individuals were normotensive, and 74 (11%) were hypertensive (28 [7.5%] treated with antihypertensive medications). Antihypertensive drugs included angiotensin-converting enzyme inhibitors (18), diuretics, (9) β-adrenergic antagonists (9), α-adrenergic agonists (1), angiotensin receptor antagonists (4), or calcium channel antagonists (7); because of combination therapy, these numbers total >28. None of the subjects had a history of renal failure, and each had a plasma creatinine concentration ≤1.5 mg/dl. Subjects were volunteers from Southern California, and each gave informed, written consent; the protocol was approved by the University of California at San Diego (UCSD) Human Research Protection Program. BP, heart rate, and cardiac output were obtained noninvasively in seated subjects with an oscillometric device (DynaPulse, San Diego, CA). Triplicate values (within ±10%) were averaged. GFR was estimated from plasma creatinine, age, sex, and body size, using the simplified NIDDK Modification of Diet in Renal Disease algorithm: GFR (ml/min) = (186) * (pCr−1.154) * (Age−0.203) * (0.742 [if female]) * (1.21 [if black]). For genetic (marker-on-trait) studies, only subjects of a single ethnicity were included.
Renal Disease
Plasma CHGA in Renal Disease
Plasma CHGA was measured in two groups of patients with renal insufficiency: one with ESRD (n = 6), with GFR <10 ml/min, and one with CKD (n = 21), with GFR 23.4 ± 5.2 ml/min.
CHGA Genotype and GFR in Progressive Renal Disease
We studied patients from the NIDDK AASK,38 each of self-identified sub-Saharan African ancestry, with hypertension and a diagnosis of progressive hypertensive renal disease (nephrosclerosis). At entry, each subject had two measurements of GFR by [125I]-iothalamate clearance of 20 to 65 ml/min per 1.73 m2. Exclusion criteria included history of diabetes or other renal disease or proteinuria >2.5 g/g of creatinine. On the basis of a 3 × 2 factorial design, participants were randomized to one of two goal BP ranges (half to a “usual” mean arterial pressure goal of 102 to 107 mmHg and half to a lower mean arterial pressure goal of ≤92 mmHg) and to double-blinded treatment with one of three antihypertensive drug classes: 40% to β-blockade with metoprolol, 50 to 200 mg/d; 40% to angiotensin converting enzyme inhibition with ramipril, 2.5 to 10 mg/d; and 20% to calcium channel blockade with amlodipine, 5 to 10 mg/d. GFR was assessed by renal clearance of [125I]-iothalamate at baseline twice, then at 3 and 6 mo, and then every 6 mo thereafter. Eight-hundred-thirty subjects were studied, 549 of whom were in a lower proteinuria (≤0.22 g/g of creatinine) subgroup that displayed the most dynamic changes in GFR during the trial.38
Genomics
Single nucleotide polymorphisms at CHGA were discovered by resequencing. Genomic DNA was typed using a MALDI time-of-flight mass spectrometry system developed by Sequenom, according to a published protocol.39 The average genotyping call rate was 96.6% (range, 89.7 to 99.7%), and reproducibility of this genotyping method was verified with 50 blinded replicate samples, yielding 98.8% concordance. Single nucleotide polymorphisms evaluated in this study had minor allele frequencies of ≥4%. Single nucleotide polymorphisms typed across the CHGA locus included: promoter (G-1106A, rs9658628; A-1018T, rs9658629; T-1014C, rs9658630; T-988G, rs9658631; G-462A, rs9658634; T-415C, rs9658635; C-89A, rs7159323; C-57T, rs9658638); intron D (T5088A, rs735726); exon 6 (G8540C, Glu246Asp, rs9658655); exon 7 (C9610T, Arg381Trp, rs729940); exon 8/3′ untranslated region (C11825T, rs7610); and downstream (G12602C, rs875395). Base positions are numbered with respect to (−/+) the transcriptional cap site.
Population Admixture
African Americans represent an admixed population with genetic contributions from both African and European biogeographic origins. To confirm that AASK individuals with or without trait-associated genotypes were of comparable overall genetic background and the observed associations were not simply an artifact of differential admixture between higher and lower GFR decline rate, GAMOVA40 was used to test for and quantify the relationship between the overall genetic background of the subjects and the quantitative phenotype GFR decline rate (chronic GFR slope), with an identity-by-state distance matrix based on genotypes at 126 biallelic markers. The admixture analysis was done in all individuals and in the lower proteinuria subgroup.
Statistical Analysis
Heritability (h2) was evaluated using monozygotic and dizygotic twin data by variance components in SOLAR.41 Haplotypes across the CHGA promoter were inferred by the HAP imperfect phylogeny method (version 3.0).42 Patterns of linkage disequilibrium and haplotype blocks were visualized by Haploview43. For twins and siblings, descriptive (mean ± SEM) and inferential statistics were computed with generalized estimating equations in SAS (SAS, Cary, NC) to take into account intratwin-pair correlations.44 One-way ANOVA with least significant difference post hoc correction and unpaired t tests were conducted in SPSS (SPSS, Chicago, IL).
DISCLOSURES
None.
Supplementary Material
Acknowledgments
This work was supported by the National Institutes of Health, Department of Veterans Affairs, and International Society of Nephrology. We appreciate the assistance of the UCSD General Clinical Research Center (RR00827), the UCSD Comprehensive Research Center in Health Disparities (MD000220), and the International Society of Nephrology (fellowship to Y.C.).
Published online ahead of print. Publication date available at www.jasn.org.
See related editorial, “Glomerular Filtration: Still Sympathetic to Endothelin's Influence?’ on pages 1427–1429.
REFERENCES
- 1.Banks P, Helle K: The release of protein from the stimulated adrenal medulla. Biochem J 97: 40C–41C, 1965 [DOI] [PMC free article] [PubMed] [Google Scholar]
- 2.O'Connor DT: Plasma chromogranin A: Initial studies in human hypertension. Hypertension 7: I76–I79, 1985 [DOI] [PubMed] [Google Scholar]
- 3.Ceconi C, Ferrari R, Bachetti T, Opasich C, Volterrani M, Colombo B, Parrinello G, Corti A: Chromogranin A in heart failure; a novel neurohumoral factor and a predictor for mortality. Eur Heart J 23: 967–974, 2002 [DOI] [PubMed] [Google Scholar]
- 4.Hsiao R, Mezger M, O'Connor D: Chromogranin A in uremia: Progressive retention of immunoreactive fragments. Kidney Int 37: 955–964, 1990 [DOI] [PubMed] [Google Scholar]
- 5.Salem R, Cadman P, Chen Y, Rao F, Wen G, Hamilton B, Rana B, Smith D, Stridsberg M, Ward H, Mahata M, Mahata S, Bowden D, Hicks P, Freedman B, Schork N, O'Connor DT: Chromogranin A polymorphisms are associated with hypertensive renal disease. J Am Soc Nephrol 19: 600–614, 2008 [DOI] [PMC free article] [PubMed] [Google Scholar]
- 6.Lillie EO, Mahata M, Khandrika S, Rao F, Bundey RA, Wen G, Chen Y, Taupenot L, Smith DW, Mahata SK, Ziegler MG, Cockburn M, Schork NJ, O'Connor DT: Heredity of endothelin secretion: human twin studies reveal the influence of polymorphism at the chromogranin A locus, a novel determinant of endothelial function. Circulation 115: 2282–2291, 2007 [DOI] [PubMed] [Google Scholar]
- 7.Benigni A: Defining the role of endothelins in renal pathophysiology on the basis of selective and unselective endothelin receptor antagonist studies. Curr Opin Nephrol Hypertens 4: 349–353, 1995 [DOI] [PubMed] [Google Scholar]
- 8.Goddard J, Johnston NR, Hand MF, Cumming AD, Rabelink TJ, Rankin AJ, Webb DJ: Endothelin-A receptor antagonism reduces blood pressure and increases renal blood flow in hypertensive patients with chronic renal failure: A comparison of selective and combined endothelin receptor blockade. Circulation 109: 1186–1193, 2004 [DOI] [PubMed] [Google Scholar]
- 9.Ong AC, Jowett TP, Firth JD, Burton S, Kitamura M, Fine LG: Human tubular-derived endothelin in the paracrine regulation of renal interstitial fibroblast function. Exp Nephrol 2: 134, 1994 [PubMed] [Google Scholar]
- 10.Wrana JL, Attisano L, Carcamo J, Zentella A, Doody J, Laiho M, Wang XF, Massague J: TGFβ signals through a heteromeric protein kinase receptor complex. Cell 71: 1003–1014, 1992 [DOI] [PubMed] [Google Scholar]
- 11.Rao F, Wessel J, Wen G, Zhang L, Rana BK, Kennedy BP, Greenwood TA, Salem RM, Chen Y, Khandrika S, Hamilton BA, Smith DW, Holstein-Rathlou NH, Ziegler MG, Schork NJ, O'Connor DT: Renal albumin excretion: Twin studies identify influences of heredity, environment, and adrenergic pathway polymorphism. Hypertension 49: 1015–1031, 2007 [DOI] [PubMed] [Google Scholar]
- 12.Chen Y, Rao F, Rodriguez-Flores JL, Mahapatra NR, Mahata M, Wen G, Salem RM, Shih PA, Das M, Schork NJ, Ziegler MG, Hamilton BA, Mahata SK, O'Connor DT: Common genetic variants in the chromogranin A promoter alter autonomic activity and blood pressure. Kidney Int 74: 115–125, 2008 [DOI] [PMC free article] [PubMed] [Google Scholar]
- 13.O'Connor DT, Zhu G, Rao F, Taupenot L, Fung MM, Das M, Mahata SK, Mahata M, Wang L, Zhang K, Greenwood TA, Shih PA, Cockburn MG, Ziegler MG, Stridsberg M, Martin NG, Whitfield JB: Heritability and genome-wide linkage in US and Australian twins identify novel genomic regions controlling chromogranin A: Implications for secretion and blood pressure. Circulation 118: 247–257, 2008 [DOI] [PMC free article] [PubMed] [Google Scholar]
- 14.Stridsberg M, Eriksson B, Oberg K, Janson ET: A panel of 11 region-specific radioimmunoassays for measurements of human chromogranin A. Regul Pept 117: 219–227, 2004 [DOI] [PubMed] [Google Scholar]
- 15.Wen G, Mahata SK, Cadman P, Mahata M, Ghosh S, Mahapatra NR, Rao F, Stridsberg M, Smith DW, Mahboubi P, Schork NJ, O'Connor DT, Hamilton BA: Both rare and common polymorphisms contribute functional variation at CHGA, a regulator of catecholamine physiology. Am J Hum Genet 74: 197–207, 2004 [DOI] [PMC free article] [PubMed] [Google Scholar]
- 16.Amann K, Rump LC, Simonaviciene A, Oberhauser V, Wessels S, Orth SR, Gross ML, Koch A, Bielenberg GW, Van Kats JP, Ehmke H, Mall G, Ritz E: Effects of low dose sympathetic inhibition on glomerulosclerosis and albuminuria in subtotally nephrectomized rats. J Am Soc Nephrol 11: 1469–1478, 2000 [DOI] [PubMed] [Google Scholar]
- 17.Campese VM, Kogosov E: Renal afferent denervation prevents hypertension in rats with chronic renal failure. Hypertension 25: 878–882, 1995 [DOI] [PubMed] [Google Scholar]
- 18.Converse RL Jr, Jacobsen TN, Toto RD, Jost CM, Cosentino F, Fouad-Tarazi F, Victor RG: Sympathetic overactivity in patients with chronic renal failure. N Engl J Med 327: 1912–1918, 1992 [DOI] [PubMed] [Google Scholar]
- 19.DiBona GF, Sawin LL: Effect of renal nerve stimulation on NaCl and H2O transport in Henle's loop of the rat. Am J Physiol 243: F576–F580, 1982 [DOI] [PubMed] [Google Scholar]
- 20.Hansen J, Victor RG: Direct measurement of sympathetic activity: New insights into disordered blood pressure regulation in chronic renal failure. Curr Opin Nephrol Hypertens 3: 636–643, 1994 [DOI] [PubMed] [Google Scholar]
- 21.Kim T, Loh YP: Chromogranin A: A surprising link between granule biogenesis and hypertension. J Clin Invest 115: 1711–1713, 2005 [DOI] [PMC free article] [PubMed] [Google Scholar]
- 22.Mahapatra NR, O'Connor DT, Vaingankar SM, Hikim AP, Mahata M, Ray S, Staite E, Wu H, Gu Y, Dalton N, Kennedy BP, Ziegler MG, Ross J, Mahata SK: Hypertension from targeted ablation of chromogranin A can be rescued by the human ortholog. J Clin Invest 115: 1942–1952, 2005 [DOI] [PMC free article] [PubMed] [Google Scholar]
- 23.Aardal S, Helle KB, Elsayed S, Reed RK, Serck-Hanssen G: Vasostatins, comprising the N-terminal domain of chromogranin A, suppress tension in isolated human blood vessel segments. J Neuroendocrinol 5: 405–412, 1993 [DOI] [PubMed] [Google Scholar]
- 24.Helle KB, Serck-Hanssen G, Aardal S: Functional aspects of the adrenal medullary chromogranins. Neurochem Int 22: 353–360, 1993 [DOI] [PubMed] [Google Scholar]
- 25.Tota B, Quintieri AM, Di Felice V, Cerra MC: New biological aspects of chromogranin A-derived peptides: Focus on vasostatins. Comp Biochem Physiol A Mol Integr Physiol 147: 11–18, 2007 [DOI] [PubMed] [Google Scholar]
- 26.Belloni D, Scabini S, Foglieni C, Veschini L, Giazzon A, Colombo B, Fulgenzi A, Helle K, Ferrero M, Corti A, Ferrero E: The vasostatin-I fragment of chromogranin A inhibits VEGF-induced endothelial cell proliferation and migration. FASEB J 21: 3052–3062, 2007 [DOI] [PubMed] [Google Scholar]
- 27.Newby AC, Henderson AH: Stimulus-secretion coupling in vascular endothelial cells. Annu Rev Physiol 52: 661–674, 1990 [DOI] [PubMed] [Google Scholar]
- 28.Schluter T, Bohnensack R: Serotonin-induced secretion of von Willebrand factor from human umbilical vein endothelial cells via the cyclic AMP-signaling systems independent of increased cytoplasmic calcium concentration. Biochem Pharmacol 57: 1191–1197, 1999 [DOI] [PubMed] [Google Scholar]
- 29.Maricq AV, Peterson AS, Brake AJ, Myers RM, Julius D: Primary structure and functional expression of the 5HT3 receptor, a serotonin-gated ion channel. Science 254: 432–437, 1991 [DOI] [PubMed] [Google Scholar]
- 30.Nitta K, Uchida K, Yumura W, Nihei H: Characterization of the glomerular endothelial cell in culture. Nippon Jinzo Gakkai Shi 35: 887–891, 1993 [PubMed] [Google Scholar]
- 31.Marsden PA, Dorfman DM, Collins T, Brenner BM, Orkin SH, Ballermann BJ: Regulated expression of endothelin 1 in glomerular capillary endothelial cells. Am J Physiol 261: F117–F125, 1991 [DOI] [PubMed] [Google Scholar]
- 32.Jain R, Shaul PW, Borok Z, Willis BC: Endothelin-1 induces alveolar epithelial-mesenchymal transition through endothelin type A receptor-mediated production of TGF-β1. Am J Respir Cell Mol Biol 37: 38–47, 2007 [DOI] [PMC free article] [PubMed] [Google Scholar]
- 33.Mosley C, Taupenot L, Biswas N, Taulane J, Olson N, Vaingankar S, Wen G, Schork N, Ziegler M, Mahata S, O'Connor D: Biogenesis of the secretory granule: Chromogranin A coiled-coil structure results in unusual physical properties and suggests a mechanism for granule core condensation. Biochemistry 46: 10999–11012, 2007 [DOI] [PubMed] [Google Scholar]
- 34.Akis N, Madaio MP: Isolation, culture, and characterization of endothelial cells from mouse glomeruli. Kidney Int 65: 2223–2227, 2004 [DOI] [PubMed] [Google Scholar]
- 35.Stridsberg M: Measurements of chromogranins and chromogranin-related peptides by immunological methods. Adv Exp Med Biol 482: 319–327, 2000 [DOI] [PubMed] [Google Scholar]
- 36.Stridsberg M, Angeletti RH, Helle KB: Characterisation of N-terminal chromogranin A and chromogranin B in mammals by region-specific radioimmunoassays and chromatographic separation methods. J Endocrinol 165: 703–714, 2000 [DOI] [PubMed] [Google Scholar]
- 37.Stridsberg M, Oberg K, Li Q, Engstrom U, Lundqvist G: Measurements of chromogranin A, chromogranin B (secretogranin I), chromogranin C (secretogranin II) and pancreastatin in plasma and urine from patients with carcinoid tumours and endocrine pancreatic tumours. J Endocrinol 144: 49–59, 1995 [DOI] [PubMed] [Google Scholar]
- 38.Agodoa LY, Appel L, Bakris GL, Beck G, Bourgoignie J, Briggs JP, Charleston J, Cheek D, Cleveland W, Douglas JG, Douglas M, Dowie D, Faulkner M, Gabriel A, Gassman J, Greene T, Hall Y, Hebert L, Hiremath L, Jamerson K, Johnson CJ, Kopple J, Kusek J, Lash J, Lea J, Lewis JB, Lipkowitz M, Massry S, Middleton J, Miller ER III, Norris K, O'Connor D, Ojo A, Phillips RA, Pogue V, Rahman M, Randall OS, Rostand S, Schulman G, Smith W, Thornley-Brown D, Tisher CC, Toto RD, Wright JT Jr, Xu S: Effect of ramipril vs amlodipine on renal outcomes in hypertensive nephrosclerosis: A randomized controlled trial. JAMA 285: 2719–2728, 2001 [DOI] [PubMed] [Google Scholar]
- 39.Buetow KH, Edmonson M, MacDonald R, Clifford R, Yip P, Kelley J, Little DP, Strausberg R, Koester H, Cantor CR, Braun A: High-throughput development and characterization of a genomewide collection of gene-based single nucleotide polymorphism markers by chip-based matrix-assisted laser desorption/ionization time-of-flight mass spectrometry. Proc Natl Acad Sci U S A 98: 581–584, 2001 [DOI] [PMC free article] [PubMed] [Google Scholar]
- 40.Nievergelt CM, Libiger O, Schork NJ: Generalized analysis of molecular variance. PLoS Genet 3: e51, 2007 [DOI] [PMC free article] [PubMed] [Google Scholar]
- 41.Almasy L, Blangero J: Multipoint quantitative-trait linkage analysis in general pedigrees. Am J Hum Genet 62: 1198–1211, 1998 [DOI] [PMC free article] [PubMed] [Google Scholar]
- 42.Halperin E, Eskin E: Haplotype reconstruction from genotype data using Imperfect Phylogeny. Bioinformatics 20: 1842–1849, 2004 [DOI] [PubMed] [Google Scholar]
- 43.Barrett JC, Fry B, Maller J, Daly MJ: Haploview: Analysis and visualization of LD and haplotype maps. Bioinformatics 21: 263–265, 2005 [DOI] [PubMed] [Google Scholar]
- 44.Do KA, Broom BM, Kuhnert P, Duffy DL, Todorov AA, Treloar SA, Martin NG: Genetic analysis of the age at menopause by using estimating equations and Bayesian random effects models. Stat Med 19: 1217–1235, 2000 [DOI] [PubMed] [Google Scholar]
Associated Data
This section collects any data citations, data availability statements, or supplementary materials included in this article.


