

Abstract
Cystatin C (CysC) is associated with cardiovascular disease (CVD) and chronic kidney disease (CKD). We examined the clinical correlates and heritability of CysC and determined if associations between CVD risk factors and CysC differed by CKD status. Among Framingham Heart Study offspring (examined from 1998-2001, n = 3,241, mean age 61 years, 54% women), the 95th percentile cut-point was developed for CysC in a healthy subset (n = 779) after excluding participants with diabetes, hypertension, low high-density lipoproteins, obesity, smoking, high triglycerides, prevalent CVD, and CKD (as defined by glomerular filtration rate <60 mL/min per 1.73 m2). Multivariable logistic regression was used to evaluate the association between CVD risk factors and high CysC (CysC ≥95th percentile cut-point). In a family-based subset (n = 1,188), we estimated CysC heritability using the variance-components method. The cut-point for high CysC was 1.07 mg/L. Age, hypertension treatment, low diastolic blood pressure, body mass index, low high-density lipoprotein cholesterol, and smoking were associated with high CysC in multivariable models. These factors and estimated glomerular filtration rate (egFR) explained 39.2% of CysC variability (R2). Excluding CKD did not materially change associations. Multivariable-adjusted heritability for CysC was 0.35 (p <0.001). In conclusion, high CysC is associated with CVD risk factors even in the absence of CKD. The strong associations between CysC and CVD risk factors may partially explain why CysC is a strong predictor of incident CVD.
Cystatin C (CysC), a cysteine protease inhibitor involved in vascular extracellular matrix remodeling,1 is also a novel marker of kidney function, which may more accurately detect chronic kidney disease (CKD) than creatinine-based estimating equations.2-4 Previous epidemiologic studies suggest that CysC is independently associated with hyper-tension,5 body weight,5,6 central obesity,7 cigarette smoking,6 cardiovascular disease (CVD) and CVD-mortality.8,9 Equivalent prevalence rates of many major CVD risk factors have been detected among those with elevated CysC compared with those with CKD.5,6 However, recent data suggest that CysC levels are associated with CVD, incident CKD, and all-cause mortality in elderly persons without prevalent CKD.9 It is unknown to what extent the variability in CysC levels is heritable. Additionally, the association of CVD risk factors and CysC in persons without CKD has not been as well characterized. Thus, the aims of this study are to characterize the association of CVD risk factors and high CysC in persons with and without CKD and to determine the heritability of CysC.
Methods
The Framingham Heart Study is a community-based prospective cohort study that began in 1948, consisting of 5,209 men and women in the original cohort.10 In 1971, 5,124 men and women who were either children of the original cohort or spouses of children of the original cohort enrolled in the Framingham Heart Study offspring cohort. Participant examinations for the offspring cohort occurred approximately every 4-8 years; the design and methodology has been described previously.11 The present investigation is comprised of participants in the offspring cohort who attended the seventh examination cycle (1998 to 2001). Of a total of 3,537 members of the offspring cohort who attended the seventh examination, 294 were excluded for missing CysC values, 1 for missing creatinine, 1 for a missing lipid measurement, resulting in a final study sample of 3,241 participants. The Framingham Offspring study protocol is reviewed by Boston University Medical Center Institutional Review Board, and all participants signed the informed consent.
The entire eligible sample was used for examining the association of high CysC with CVD risk factors. To develop reference values, we created a healthy referent subset from the broad sample upon making the following hierarchical exclusions: diabetes (n = 360), hypertension (n = 1,219), HDL <50 mg/dL in women and <40 mg/dL in men (n = 410), body mass index ≥30 kg/m2 (n = 214), cigarette smoking (n = 155), serum triglycerides ≥200 mg/dL (n = 40), having a previous diagnosis of CVD (n = 39), and glomerular filtration rate (GFR) <60 ml/min/1.73 m2 (n = 26). After exclusions, 779 participants (n = 493 women, 286 men) remained.
Among 1,316 offspring cohort members who were part of 330 pedigrees/516 sibships, 1,188 persons had CysC measurements and constituted the sample used for heritability analysis.
Cystatin C concentrations were measured on previously frozen samples (stored at - 80° C) by nephelometry (Dade Behring Diagnostic, Marburg, Germany) and were reported as mg per liter. The intra- and inter-assay coefficients of variation were 2.4 and 3.3%, respectively. The range of detection is 0.29 to 7.22 mg/L. Urine albumin concentration was measured through the use of immuno-turbimetry (Tina-quant Albumin assay; Roche Diagnostics, Indianapolis, Indiana) and indexed to urinary creatinine. Microalbuminuria (MA) was defined as a UACR of at least 30 mg/g.12
Kidney function was estimated by GFR, calculated using the simplified Modification of Diet in Renal Disease (MDRD) Study equation.12,13 Our definition of CKD was based on the National Kidney Foundation Disease Outcome Quality Initiative working group definition of kidney disease, which defines CKD as GFR <60 mL/min per 1.73 m2.12
Serum creatinine was measured using the modified Jaffe method. Because the measurement of creatinine can vary across various laboratories, our creatinine values were calibrated using a 2-step process. First, National Health and Nutritional Examination Survey III creatinine values were calibrated to the Cleveland Clinic Laboratory, requiring a correction factor of 0.23 mg/dL (20.3 μmol/L).14 Second, age- and sex-specific (20-39, 40-59, 60-69, ≥70 years) creatinine values were aligned with the corresponding corrected National Health and Nutrition Examination Survey III age- and sex-specific means, as previously described.15
Covariate data were obtained during the 7th examination cycle (1998 -2001) of the Framingham Heart Study off-spring study. Details regarding the methods of risk factor measurement and laboratory analysis have been previously described.16
The 95th percentile cut-point for CysC was generated based on the healthy referent sample. “High” CysC refers to persons at or above the reference 95th percentile, and “normal” CysC refers to those below the reference 95th percentile. Next, we tested for significance of CVD risk factors associated with high CysC using analysis of variance model for continuous variables or logistic regression model for dichotomous variables, adjusting for age and sex. Covariates that were significant in univariate analyses were entered into a stepwise logistic regression model, with age and sex forced in to determine the best set of parsimonious covariates associated with high CysC. In secondary analyses, we excluded the subset of persons with CKD and reassessed relations between CysC and CVD risk factors and MA. We assessed the prevalence of major CVD risk factors and MA for each of the 4 categories: no CKD/normal CysC, CKD/normal CysC, no CKD/high CysC, and CKD/high CysC. We compared the age- and sex-adjusted prevalence of CVD risk factors only among the following 2 groups: CKD/normal CysC and no CKD/high CysC. Statistical analyses were performed using SAS statistical software version 8.1 (SPSS, Inc., Chicago, Illinois).17 A 2-tailed value of p <0.05 was considered statistically significant.
Results
Among the 3,241 participants, mean age was 61 ± 9 years and 54% were women. The mean estimated GFR of the study sample was 85 mL/min per 1.73 m2; 8.6% of participants had CKD (based on the definition of less than 60 mL/min per 1.73 m2). Significant correlation between CysC and GFR was observed (age- and sex-adjusted Spearman correlation coefficient = - 0.53, p <0.001).
The 95th percentile cut-point for CysC was 1.07 mg/L. Most CVD risk factors were associated with high CysC in age- and sex-adjusted analyses (Table 1). In stepwise multivariable regression, age, sex, hypertension treatment, low diastolic blood pressure, body mass index, low high-density lipoprotein (HDL) cholesterol, and smoking were associated with high CysC (Table 2). In multivariable models of the subset of participants without CKD (n = 2,981), diastolic blood pressure was no longer significantly associated with high CysC (Table 2). When the analysis was repeated excluding participants with MA (n = 2,304; Table 2), results were similar.
Table 1.
Burden of cardiovascular risk factors in study participants with normal and high Cystatin C ≥95th percentile cut-point*
| Cystatin C Level |
p Value† | ||
|---|---|---|---|
| Normal (n = 2521) | High (n = 720) | ||
| Age (yrs) | 59.2 ± 8.8 | 67.9 ± 8.5 | <.001 |
| Women | 1403 (55.7%) | 338 (46.9%) | <.001 |
| Range GFR (mL/min/1.73 m2) | 89.2 ± 17.2 | 69.2 ± 17.9 | <.001 |
| Range GFR (mL/min/1.73 m2) | 34.4-182.3 | 6.2-143.8 | - |
| Diastolic blood pressure (mm Hg) | 126 ± 18.2 | 133 ± 19.8 | 0.28 |
| Diastolic blood pressure (mm Hg) | 74.6 ± 9.5 | 72.1 ± 10.3 | 0.02 |
| Pulse pressure (mm Hg) | 50.9 ± 15.4 | 60.8 ± 18.4 | 0.004 |
| Fasting blood glucose (mg/dl) | 103 ± 25.0 | 110 ± 30.3 | 0.003 |
| Total cholesterol (mg/dl) | 202 ± 36.5 | 193 ± 36.9 | <.001 |
| HDL cholesterol (mg/dl) | 121 ± 32.7 | 115 ± 32.4 | 0.002 |
| HDL cholesterol (mg/dl) | 55 ± 17.2 | 47.6 ± 14.8 | <.001 |
| Triglycerides (mg/dl) | 132 ± 87.1 | 153 ± 88.9 | <.001 |
| Body mass index (kg/m2) | 27.7 ± 5.1 | 29.9 ± 5.7 | <.001 |
| Waist circumference (cm) | 98.2 ± 13.7 | 106 ± 13.9 | <.001 |
| Hypertension | 997 (39.6%) | 486 (56.0%) | <.001 |
| Hypertension treatment | 697 (27.7%) | 403 (19.4%) | <.001 |
| Diabetes mellitus | 219 (8.7%) | 140 (19.4%) | <.001 |
| BMI ≥30 kg/m2 | 663 (26.3%) | 306 (42.5%) | <.001 |
| Central obesity‡ | 1431 (56.8%) | 521 (72.4%) | <.001 |
| Low HDL cholesterol§ | 685 (27.2%) | 330 (45.8%) | <.001 |
| Triglycerides ≥ 150 mg/dl | 742 (29.4%) | 280 (38.9%) | <.001 |
| Total cholesterol ≥240 mg/dl | 384 (15.4%) | 72 (14.2%) | <.001 |
| Smoking | 314 (12.4%) | 102 (14.2%) | <.001 |
| Moderate alcohol intake|| | 471 (18.7%) | 89 (12.4%) | 0.001 |
| Chronic kidney disease | 59 (2.3%) | 219 (30.4%) | <.001 |
| Prevalent cardiovascular disease | 240 (9.5%) | 185 (25.7%) | <.001 |
Values represent mean ± SD or n where indicated; % in parentheses.
CysC 95th percentile cut-point is 1.07 mg/L.
p Value is age- and sex-adjusted, except for age, which is sex-adjusted, and sex, which is age-adjusted.
Waist circumference >88 cm in women or >102 cm in men.
<40 mg/dl in men or <50 mg/dl in women.
>7 drinks per week in women and >14 in men.
LDL = low density lipoprotein, BMI = body mass index, CKD = chronic kidney disease.
Table 2.
Multivariable associations of cardiovascular risk factors with high Cystatin C ≥95th percentile cut-point among all participants, in the subset without chronic kidney disease, and among participants without MA
| All Participants (n = 3,241) |
Participants without CKD (n = 2,981) |
Participants without MA (n = 2304) |
||||
|---|---|---|---|---|---|---|
| Odds Ratio (95% Confidence Interval) | p Value | Odds Ratio (95% Confidence Interval) | p Value | Odds Ratio (95% Confidence Interval) | P | |
| Age (per 10-year interval) | 3.39 (2.98-3.86) | <.0001 | 3.07 (2.66-3.53) | <.0001 | 3.20 (2.74-3.75) | <.0001 |
| Female sex | 0.65 (0.53-0.79) | <.0001 | 0.60 (0.48-0.74) | <.0001 | 0.65 (0.51-0.82) | 0.0004 |
| Hypertension treatment | 1.87 (1.54-2.27) | <.0001 | 1.54 (1.24-1.92) | 0.0001 | 1.82 (1.43-2.31) | <.0001 |
| Diastolic blood pressure (per SD change) | 0.87 (0.79-0.96) | 0.008 | 0.90 (0.81-1.00) | 0.060 | 0.94 (0.83-1.06) | 0.28 |
| BMI mg/kg2 (per SD change) | 1.56 (1.42-1.72) | <.0001 | 1.62 (1.46-1.80) | <.0001 | 1.41 (1.26-1.59) | <.0001 |
| HDL cholesterol (per SD change) | 0.68 (0.61-0.76) | <.0001 | 0.72 (0.64-0.82) | <.0001 | 0.68 (0.60-0.78) | <.0001 |
| Current smoking (yes vs no) | 2.55 (1.90-3.40) | <.0001 | 2.74 (2.02-3.72) | <.0001 | 3.08 (2.17-4.39) | <.0001 |
There was a strong and highly statistically significant association between CKD and high CysC (odds ratio = 10.1, 95% confidence interval 7.1 to 14.4), p <0.0001). When CysC was modeled as a continuous variable, the overall R2 of the final stepwise model explained 22.0% of the CysC variation. When GFR was added, the CVD risk factors and GFR explained 39.2% of the variability of CysC.
Among study participants with CKD (n = 260), 22.7% (n = 59) did not have high CysC. Among the 720 with high CysC, 72.1% (n = 519) did not have CKD. Rates of hypertension and obesity were higher among persons with no CKD but high CysC compared with those with CKD but with normal CysC (Figure 1). There were no differences in rates of diabetes, low HDL cholesterol, triglycerides, total cholesterol, and MA among persons with no CKD but high CysC compared with persons with CKD and normal CysC.
Figure 1.
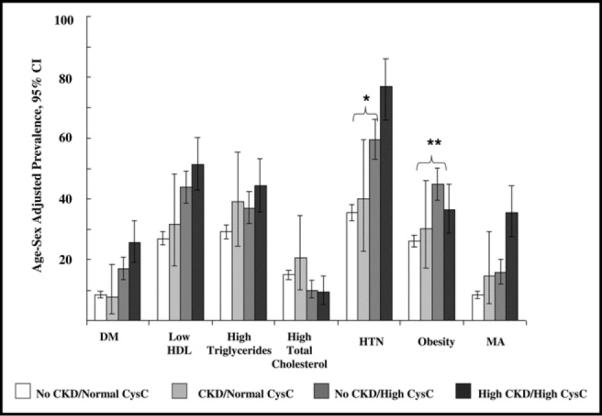
Age and sex-adjusted prevalence of CVD risk factors with cross classification of CKD and CysC (where CKD defined as GFR <60 mL/min per 1.73 m2 and CysC as <1.07 mg/L). Comparison of age- and sex-adjusted risk factor prevalence between participants with CKD/normal CysC (n = 59) and participants with no CKD/High CysC (n = 519): hypertension; *p = 0.02; for obesity **p = 0.01; all other values of p nonsignificant. DM = diabetes mellitus, HTN = hypertension.
Heritability was performed in a subset of the overall study sample (n = 1188). Mean age of the subset was 59 years, 52% were women, and mean GFR was 87 mL/min per 1.73 m2. The age-and sex-adjusted heritability of CysC was 0.40 (standard error = 0.07; value of p <0.001). The multivariable-adjusted heritability of CysC was 0.35 (standard error = 0.07; value of p <0.001).
Discussion
High CysC is associated with most major CVD risk factors, and these associations persisted with the additional exclusion of persons with CKD or with microalbuminuria. The examination of discordant categories among participants with either CKD or high CysC demonstrated fairly similar age- and sex-adjusted CVD risk factor prevalence rates with the exception of hypertension and obesity, which had higher prevalence rates in participants with high CysC alone compared with participants with CKD alone. These findings may help interpret previous studies that demonstrate that CysC is a better marker of CVD risk compared with eGFR,8 as well as why CysC is associated with CKD or CVD, even in the absence of CKD.9
Overall, the R2 of our set of covariates in addition to eGFR to explain variation in CysC levels was modest (39.2%), suggesting that other factors also play a role in determining CysC variation. We examined the heritability of CysC and found that CysC is moderately heritable.
A recent investigation in community-dwelling elderly residents found that CysC greater than or equal to 1.0 mg/L represented increased risk for CVD and progression to CKD.9 Based on our results, a CysC cut-point of 1.0 mg/L would fall within 2 SDs from the mean value in a healthy referent subset, suggesting that it may be slightly too low to be considered abnormal.
Our finding that low diastolic blood pressure is associated with CysC may be the result of the association between CysC and pulse pressure;18 low diastolic blood pressures are associated with arterial stiffness, a phenomenon which is common to aging, CVD, and kidney disease.6,19,20 The association between low HDL cholesterol and high CysC levels are consistent with previous findings.15 Further, an association between CysC and cigarette smoking has been reported previously.6
Whereas CysC was related to most major CVD risk factors in our study, in multivariable models the presence of diabetes mellitus was no longer associated with CysC. This is particularly surprising given the strong relations between DM and ESRD as well as well-documented significant relation between DM and CKD.21 The lack of association between CysC and diabetes in our analysis has been noted in a previous study.6
Overall, the risk factor profiles between the discordant groups were statistically similar, although persons with high CysC/no CKD had higher rates of obesity and hypertension compared with persons with normal CysC/CKD. These findings can be interpreted in various ways. First of all, persons with high CysC/no CKD may have preclinical CKD9 and an associated elevated risk factor burden that is similar to persons with CKD. Because of measurement error involved in the quantification of eGFR, it is also possible that persons with high CysC but GFR that is not in the CKD range are more accurately classified by CysC levels. Alternatively, high CysC in persons without CKD may be the result of extra-renal sources of CysC variability. For instance, previous studies have suggested that CysC may be a marker of thyroid22 and liver dysfunction23 or obesity.24 However, studies comparing CysC with gold-standard measures of GFR are necessary to best elucidate this relationship.
Our results thus provide complementary evidence to several previous studies demonstrating that CysC is a robust marker of kidney dysfunction and a correlate of CVD risk factors. We extend previous findings by demonstrating that the association of CysC with CVD risk factors remains significant, even in the absence of clinical CKD as well as microalbuminuria.
The Framingham Heart Study is a community-based sample not selected for CKD, thus reducing the risk of referral or selection bias. We have detailed assessment and documentation of cardiovascular risk factors and treatment. Several limitations should be acknowledged as well. Our study sample is primarily white, of European descent, and therefore our CysC cut-points may not apply to other ethnic/racial groups. However, a recent investigation in the National Health and Nutrition Examination Survey revealed that CysC was associated with CVD risk factors in nonwhite persons.25 Our definition of CKD may be inaccurate in that it is limited to a single measurement of serum creatinine on 1 occasion and not measured over a period of 3 months or greater, as has been defined by the National Kidney Foundation.12 We used the simplified MDRD study equation to estimate GFR instead of measuring it directly. To improve the validity and accuracy of the MDRD equation, we indirectly calibrated our creatinine values. Because we do not have a gold-standard measure of GFR, we cannot assess whether CysC is a better measure of GFR compared with creatinine-based estimating equations. A small study has demonstrated the superiority of CysC to serum creatinine compared with invasively measured GFR among elderly persons,26 and a recent publication from the MDRD study did demonstrate that CysC performed as well compared with invasively measured GFR with respect to kidney failure and CVD mortality.27 We did not use transforming equations to estimate GFR from CysC.
Elevated CysC, present in one-fifth of our study participants, was associated with cardiovascular risk factors and CKD. These relations with CVD risk factors persisted even in the absence of CKD or MA. Our study provides novel evidence that serum CysC is heritable. The strong associations between CysC and CVD risk factors may explain why CysC is a strong predictor of incident CVD.
Acknowledgments
The Framingham Heart Study was supported by Grant N01-HC-25195 from the National Heart, Lung and Blood Institute.
References
- 1.Liu J, Sukhova GK, Sun JS, Xu WH, Libby P, Shi GP. Lysosomal cysteine proteases in atherosclerosis. Arterioscler Thromb Vasc Biol. 2004;24:1359–1366. doi: 10.1161/01.ATV.0000134530.27208.41. [DOI] [PubMed] [Google Scholar]
- 2.Rule AD, Bergstralh EJ, Slezak JM, Bergert J, Larson TS. Glomerular filtration rate estimated by cystatin C among different clinical presentations. Kidney Int. 2006;69:399–405. doi: 10.1038/sj.ki.5000073. [DOI] [PubMed] [Google Scholar]
- 3.Rule AD, Larson TS, Bergstralh EJ, Slezak JM, Jacobsen SJ, Cosio FG. Using serum creatinine to estimate glomerular filtration rate: accuracy in good health and in chronic kidney disease. Ann Intern Med. 2004;141:929–937. doi: 10.7326/0003-4819-141-12-200412210-00009. [DOI] [PubMed] [Google Scholar]
- 4.Stevens LA, Coresh J, Greene T, Levey AS. Assessing kidney function-measured and estimated glomerular filtration rate. N Engl J Med. 2006;354:2473–2483. doi: 10.1056/NEJMra054415. [DOI] [PubMed] [Google Scholar]
- 5.Wasen E, Isoaho R, Mattila K, Vahlberg T, Kivela SL, Irjala K. Serum cystatin C in the aged: relationships with health status. Am J Kidney Dis. 2003;42:36–43. doi: 10.1016/s0272-6386(03)00406-2. [DOI] [PubMed] [Google Scholar]
- 6.Knight EL, Verhave JC, Spiegelman D, Hillege HL, de Zeeuw D, Curhan GC, de Jong PE. Factors influencing serum cystatin C levels other than renal function and the impact on renal function measurement. Kidney Int. 2004;65:1416–1421. doi: 10.1111/j.1523-1755.2004.00517.x. [DOI] [PubMed] [Google Scholar]
- 7.Ognibene A, Mannucci E, Caldini A, Terreni A, Brogi M, Bardini G, Sposato I, Mosconi V, Salvadori B, Rotella CM, Messeri G. Cystatin C reference values and aging. Clin Biochem. 2006;39:658–661. doi: 10.1016/j.clinbiochem.2006.03.017. [DOI] [PubMed] [Google Scholar]
- 8.Shlipak MG, Sarnak MJ, Katz R, Fried LF, Seliger SL, Newman AB, Siscovick DS, Stehman-Breen C. Cystatin C and the risk of death and cardiovascular events among elderly persons. N Engl J Med. 2005;352:2049–2060. doi: 10.1056/NEJMoa043161. [DOI] [PubMed] [Google Scholar]
- 9.Shlipak MG, Katz R, Sarnak MJ, Fried LF, Newman AB, Stehman-Breen C, Seliger SL, Kestenbaum B, Psaty B, Tracy RP, Siscovick DS. Cystatin C and prognosis for cardiovascular and kidney outcomes in elderly persons without chronic kidney disease. Ann Intern Med. 2006;145:237–246. doi: 10.7326/0003-4819-145-4-200608150-00003. [DOI] [PubMed] [Google Scholar]
- 10.Dawber TR, Kannel WB. An approach to longitudinal studies in a community: the Framingham Study. Ann N Y Acad Sci. 1963;107:539–556. doi: 10.1111/j.1749-6632.1963.tb13299.x. [DOI] [PubMed] [Google Scholar]
- 11.Kannel WB, Feinleib M, McNamara PM, Garrison RJ, Castelli WP. An investigation of coronary heart disease in families. The Framing-ham offspring study. Am J Epidemiol. 1979;110:281–290. doi: 10.1093/oxfordjournals.aje.a112813. [DOI] [PubMed] [Google Scholar]
- 12.K/DOQI clinical practice guidelines for chronic kidney disease: evaluation, classification, and stratification. Am J Kidney Dis. 2002;39:S1–S266. [PubMed] [Google Scholar]
- 13.Levey AS, Bosch JP, Lewis JB, Greene T, Rogers N, Roth D. A more accurate method to estimate glomerular filtration rate from serum creatinine: a new prediction equation. Modification of Diet in Renal Disease Study Group. Ann Intern Med. 1999;130:461–470. doi: 10.7326/0003-4819-130-6-199903160-00002. [DOI] [PubMed] [Google Scholar]
- 14.Coresh J, Astor BC, McQuillan G, Kusek J, Greene T, Van Lente F, Levey AS. Calibration and random variation of the serum creatinine assay as critical elements of using equations to estimate glomerular filtration rate. Am J Kidney Dis. 2002;39:920–929. doi: 10.1053/ajkd.2002.32765. [DOI] [PubMed] [Google Scholar]
- 15.Fox CS, Larson MG, Leip EP, Culleton B, Wilson PW, Levy D. Predictors of new-onset kidney disease in a community-based population. JAMA. 2004;291:844–850. doi: 10.1001/jama.291.7.844. [DOI] [PubMed] [Google Scholar]
- 16.Cupples LA, D'Agostino RB., Sr. Some risk factors related to the annual incidence of cardiovascular disease and death using pooled repeated biennial measurements: Framingham Study, 30-year follow-up. In: Kannel WB, Wolf PA, Garrison RJ, editors. The Framingham Heart Study: an Epidemiologic Investigation of Cardiovascular Disease. NIH Publication; Washington, DC: 1987. pp. 87–203. [Google Scholar]
- 17.SAS/STAT User's Guide, Version 8. SAS Institute Inc.; Cary, NC: 2000. [Google Scholar]
- 18.Peralta CA, Whooley MA, Ix JH, Shlipak MG. Kidney function and systolic blood pressure new insights from cystatin C: data from the Heart and Soul Study. Am J Hypertens. 2006;19:939–946. doi: 10.1016/j.amjhyper.2006.02.007. [DOI] [PMC free article] [PubMed] [Google Scholar]
- 19.Benetos A, Waeber B, Izzo J, Mitchell G, Resnick L, Asmar R, Safar M. Influence of age, risk factors, and cardiovascular and renal disease on arterial stiffness: clinical applications. Am J Hypertens. 2002;15:1101–1108. doi: 10.1016/s0895-7061(02)03029-7. [DOI] [PubMed] [Google Scholar]
- 20.Wang MC, Tsai WC, Chen JY, Huang JJ. Stepwise increase in arterial stiffness corresponding with the stages of chronic kidney disease. Am J Kidney Dis. 2005;45:494–501. doi: 10.1053/j.ajkd.2004.11.011. [DOI] [PubMed] [Google Scholar]
- 21.U.S. Renal Data System, USRDS 2006 . Annual Data Report: Atlas of End-Stage Renal Disease in the United States. National Institutes of Health, National Institute of Diabetes and Digestive and Kidney Diseases; Bethesda, MD: 2006. [Google Scholar]
- 22.Fricker M, Wiesli P, Brandle M, Schwegler B, Schmid C. Impact of thyroid dysfunction on serum cystatin C. Kidney Int. 2003;63:1944–1947. doi: 10.1046/j.1523-1755.2003.00925.x. [DOI] [PubMed] [Google Scholar]
- 23.Takeuchi M, Fukuda Y, Nakano I, Katano Y, Hayakawa T. Elevation of serum cystatin C concentrations in patients with chronic liver disease. Eur J Gastroenterol Hepatol. 2001;13:951–955. doi: 10.1097/00042737-200108000-00013. [DOI] [PubMed] [Google Scholar]
- 24.Muntner P, Winston J, Uribarri J, Mann D, Fox CS. Overweight, obesity, and elevated serum cystatin C levels in adults in the United States. Am J Med. 2008;121:341–348. doi: 10.1016/j.amjmed.2008.01.003. [DOI] [PMC free article] [PubMed] [Google Scholar]
- 25.Kottgen A, Selvin E, Stevens LA, Levey AS, Van LF, Coresh J. Serum cystatin C in the United States: the Third National Health and Nutrition Examination Survey (NHANES III) Am J Kidney Dis. 2008;51:385–394. doi: 10.1053/j.ajkd.2007.11.019. [DOI] [PubMed] [Google Scholar]
- 26.Fliser D, Ritz E. Serum cystatin C concentration as a marker of renal dysfunction in the elderly. Am J Kidney Dis. 2001;37:79–83. doi: 10.1053/ajkd.2001.20628. [DOI] [PubMed] [Google Scholar]
- 27.Menon V, Shlipak MG, Wang X, Coresh J, Greene T, Stevens L, Kusek JW, Beck GJ, Collins AJ, Levey AS, Sarnak MJ. Cystatin C as a risk factor for outcomes in chronic kidney disease. Ann Intern Med. 2007;147:19–27. doi: 10.7326/0003-4819-147-1-200707030-00004. [DOI] [PubMed] [Google Scholar]