

Abstract
Although inhibition of glutathione reductase (GR) has been demonstrated to cause a decrease in reduced glutathione (GSH) and increase in glutathione disulfide (GSSG), a systematic study of the effects of GR inhibition on thiol redox state and related systems has not been noted. By employing a monkey kidney cell line as the cell model and 2-acetylamino-3-[4-(2-acetylamino-2-carboxy-ethylsulfanylthio-carbonylamino)phenylthiocarbamoylsulfanyl]propionic acid (2-AAPA) as a GR inhibitor, an investigation of the effects of GR inhibition on cellular thiol redox state and related systems was conducted. Our study demonstrated that, in addition to a decrease in GSH and increase in GSSG, 2-AAPA increased the ratios of NADH/NAD+ and NADPH/NADP+. Significant protein glutathionylation was observed. However, the inhibition did not affect the formation of reactive oxygen species or expression of antioxidant defense enzyme systems [GR, glutathione peroxidase, catalase, and superoxide dismutase)] and enzymes involved in GSH biosynthesis [γ-glutamylcysteine synthetase and glutathione synthetase].
Keywords: Glutathione reductase inhibitor, thiol redox state, protein thiols, GSH, GSSG
Glutathione reductase (GR) is a homodimeric flavoprotein of 2×52 kDa [1] and an important antioxidant enzyme in maintaining an intracellular reducing environment, which is critical to the cell against oxidative stress. The enzyme achieves this function by catalyzing the reduction of glutathione disulfide (GSSG) to glutathione (GSH, L-γ-glutamyl-L-cysteinylglycine). GSSG is produced through the oxidation of GSH by oxidants such as reactive oxygen species (ROS) that arise during conditions of oxidative stress [2, 3]. GSH protects the cell against oxidative stress through termination of oxidants with concomitant oxidation of GSH to GSSG [3, 4]. GSH is the most abundant nonprotein thiol in mammalian cells with typical concentrations in the millimolar range [5] and is the major form of glutathione present in cells. GSH is synthesized in the cytoplasm with overall cellular GSH/GSSG ratios ranging from 30:1 to 300:1 [6]. Due to high concentrations of GSH, GSH/GSSG is considered to be the principal redox buffer of the cell, and the ratio of GSH/GSSG is viewed as the major indicator of the cellular redox status [3, 6]. The ratio of GSH/GSSG decreases under an oxidative stress condition [7]. The physiologically high ratio of GSH/GSSG is primarily maintained by two biochemical processes: GSH biosynthesis and reduction of GSSG to GSH. The biosynthesis of GSH starts with coupling of glutamic acid and cysteine followed by addition of glycine through consecutive action of γ-glutamylcysteine synthetase (GCS) and glutathione synthetase (GS). In this process, the GCS-catalyzed reaction is the rate-limiting step [8]. Inhibition of either GSH biosynthesis or GSSG reduction is expected to decrease the ratio of GSH/GSSG.
In addition to the role as an antioxidant enzyme, GR has been identified as a target for anticancer and antimalarial drug development [9–13]. Inhibition of the enzyme has also been found to be related to the toxicity of various chemicals and metals [14–16]. Although inhibition of GR has been reported to cause a depletion of GSH and accumulation of GSSG [17,18], a systematic study of the impact of GR inhibition on the cellular thiol redox system has not been documented. Knowledge of the effects of GR inhibition on the cellular thiol redox state and related systems will be valuable in targeting the enzyme for anticancer and antimalarial drug development and in understanding the enzyme’s role in toxicology. In the present study, the effect of GR inhibition on cellular GSH, GSSG, protein thiols (P-SH), protein disulfides [P-S-S-R (R=protein or nonprotein)], protein S-glutathionylation (P-S-S-G), ROS, and the expression of antioxidant defense enzyme systems [GR, glutathione peroxidase (GPx), catalase, and superoxide dismutase (SOD)] was investigated. In addition, the effects of GR inhibition on GCS and GS expression were also studied. Further, the impact of GR inhibition on NADH/NAD+ and NADPH/NADP+, two other cellular redox buffers, was examined. The study employed 2-acetylamino-3-[4-(2-acetylamino-2-carboxyethylsulfanylthiocarbonylamino)phenylthiocarbamoylsulfanyl]propionic acid (2-AAPA) as the enzyme inhibitor. 2-AAPA is an irreversible and selective GR inhibitor recently developed from this laboratory with Ki and kinact values of 56 μM and 0.1 min−1 respectively against yeast GR [19]. The irreversible inhibition occurs through a covalent bond formation between 2-AAPA and the cysteine residues at the active site of the enzyme [19]. 2-AAPA showed no inhibition against GCS, GS, catalase and SOD, but minimal inhibition against GPx and glutathione S-transferase [19]. A monkey kidney cell line (CV-1) was used as the cell model for the study. LC/MS was employed for the quantification of GSH and GSSG. Total free thiols and total disulfides were quantified by an HPLC method recently developed in this laboratory [20]. Expression of GR, GPx, catalase, SOD, GCS and GS was assayed by Western blot and real time RT-PCR. Intracellular ROS were determined by 5-(and 6) carboxy-2′,7′-dichlorodihydrofluoresceindiacetate (carboxy-H2DCFDA).
Materials and Methods
Materials
GSH, GSSG, 5,5′-dithiobis-(2-nitrobenzoic acid) (DTNB), p-aminobenzoic acid, β-methylphenylalanine, ethylenediaminetetraacetic acid (EDTA), bovine serum albumin (BSA), NAD+, NADH, NADP+, NADPH, and Bradford reagent were obtained from Sigma-Aldrich Chemical Co. (Milwaukee, WI). Sodium borohydride (NaBH4) was obtained from Fisher Scientific (Pittsburgh, PA). Sulfosalicylic acid was purchased from J.T. Baker Chemical Co. (Phillipsburg, NJ). RPMI 1640 growth medium, fetal bovine serum (FBS), penicillin/streptomycin, and phosphate buffered saline (PBS) were purchased from Mediatech, Inc (Herndon, VA). Carboxy-H2DCFDA was obtained from Molecular Probes Inc., (Eugene, OR). CV-1 cells were obtained from American Type Culture Collection (ATCC). 2-AAPA was synthesized in this laboratory [19].
Stock solutions
Solutions of DTNB, p-aminobenzoic acid and NaBH4 were made in 0.15 M KH2PO4 (pH 7.5). 2- AAPA was dissolved in RPMI 1640 growth medium. Solutions of GSH, GSSG and β-methylphenylalanine were prepared in 0.1% HCl aqueous solution. NADH, NAD+, NADPH, and NADP+ were dissolved in the extraction buffer (NADP/NADPH quantification kit, Biovision, Mountain View, CA). The solution of carboxy-H2DCFDA was made in DMSO.
Exposure of cells to 2-AAPA
Exponentially growing CV-1 cells were maintained in RPMI 1640 growth medium containing 10% FBS and 1% penicillin/streptomycin in a 5% CO2 incubator at 37°C. Cell viability was determined by trypan blue staining. For treatment, cells (7.5 × 10⁶) were placed in a 185 cm2 flask under the same culture condition as described above for 24 h for attachment. The cells in the flask (~15 × 106) were then treated with 2-AAPA (0.1 mM) in a 5% CO2 incubator at 37°C for time periods ranging from 20 min to 8 h. The medium was collected, and the cells were rinsed with ice-cold PBS and detached by trypsinization. The medium and the cell suspension were combined and centrifuged at 1000 × g for 5 min. The cell pellet was collected for different assays. The total cell number for each of the following assays was fifteen million: a). GR inhibition, GSH, GSSG, protein thiol, and protein disulfide quantification; b). Western blot; c). real time RT-PCR; d). NADH, NAD+, NADPH, NADP+ quantification. Protein content was determined by the Bradford method with BSA as the standard.
Determination of GR inhibition in CV-1 cells
The cell pellet obtained above was washed with ice-cold PBS containing 1 mM EDTA (5 mL), suspended in 1 mL of hypotonic phosphate buffer (1 mM, pH 7.5) containing 1 mM EDTA, and homogenized over ice with an Omni 5000 homogenizer (Omni International, Waterbury, CT) for 6 min. The homogenate was centrifuged at 120,000 × g for 20 min at 4°C, and GR activity in the supernatant was determined as described previously [21]. Briefly, the assay mixture contained the supernatant (300 μL), BSA (1 mg/mL) and NADPH (0.2 mM). The enzymatic reaction was initiated by addition of GSSG (0.52 mM). GR activity was measured by the initial rates of disappearance of NADPH determined spectrophotometrically at λ=340 nm.
Cell lysate for quantification of GSH, GSSG, protein thiols and disulfides
The cell pellet was washed with 5 mL ice-cold PBS with 1 mM EDTA, suspended in 0.5 mL of 10% sulfosalicylic acid, and sonicated using a Misonix XL2020 sonicator with a cup horn probe (Farmingdale, NY) for 4 min. 100 μL of the lysate was used to determine GSH and GSSG as described below, the rest of the lysate was centrifuged at 15,300 × g for 30 sec. The precipitates were used to determine protein thiols and disulfides as described below.
Quantification of GSH and GSSG
GSH and GSSG were quantified as described previously with minor modification (22). Briefly cell lysate (100 μL) was added with β-methylphenylalanine (100 μg/mL, 10 μL) as an internal standard and DTNB (50 mM, 60 μL), followed by neutralization with phosphate buffer (0.5 M, pH 10, 200 μL). The samples were left at ambient temperature for 15 min to allow the completion of GSH derivatization by DTNB. After derivatization, the samples were acidified by HCl (10 M, 30 μL), and the acidified samples were diluted 10 times with 0.1% HCl solution. Fifty μL of the diluted sample was injected into LC/MS for quantification of GSSG and the derivatized GSH. Standard curves were constructed by spiking the supernatant with various known amounts of GSH (for GSH quantification) or GSSG (for GSSG quantification). The LC/MS analysis was conducted on a Waters Micromass Quattro Ultima Mass Unit (Waters, Milford, MA).
Quantification of protein thiols and protein disulfides
Quantification of protein thiols and protein disulfides followed a procedure developed recently from this laboratory [20]. The method was based on the HPLC quantification of 5-thio-2-nitrobenzoic acid (TNB) produced from the reaction of DTNB with thiols before (for protein thiols) and after (for protein disulfides) NaBH4 reduction of protein.
Protein S-glutathionylation
The information of protein S-glutathionylation was derived from the quantification of GSH released from protein upon reduction by NaBH4 as described previously [20].
Determination of ROS
Formation of ROS was assessed by carboxy-H2DCFDA [23, 24]. Upon entry into the cytoplasm, this probe is cleaved by cellular esterases and oxidized by ROS to yield fluorescence. Briefly, the attached exponentially growing CV-1 cells (10 × 106) were treated with 25 μM carboxy-H2DCFDA in PBS in a 185 cm2 flask for 15 min at 37°C in the dark. The cells were rapidly trypsinized (×5 for 1min) and resuspended in RPMI growth medium at a density of 200,000 cells/mL. After addition of 2-AAPA (0.1 mM), the cell suspension was quickly dispensed to a 96-well plate at 150 μL/well. Fluorescence was measured immediately with readings taken every 1 min for 1 h at 480 nm (excitation) and 535 nm (emission) on a SpectraMax M2 fluorescence microplate reader (Molecular Devices, Sunnyvale, California).
Evaluation of gene expression of antioxidant defense enzymes and GSH biosynthesis enzymes by real time RT-PCR
In order to determine the impact of GR inhibition on the gene expression of enzymes related to thiol redox state, real-time RT-PCR was conducted. The cell pellet, following 2-AAPA treatment as described above, was washed with 5 mL ice-cold PBS containing 1 mM EDTA. Isolation of RNA was achieved with an RNeasy mini kit based on the procedure provided by the manufacture (Qiagen Inc., Valencia, CA). RNA concentration was determined spectrophotometrically at 260 nm.
Primers for real-time RT-PCR were designed based on human and monkey conserved sequences using IDT SciTool PrimerQuest™ (Table 1). Primer sets were synthesized by Integrated DNA Technologies, Inc. (IDT, Coralville, IA). First strand cDNA synthesis was performed using the PowerScript™ Reverse Transcriptase (Clontech Laboratories, Inc., Palo Alto, CA) by following the manufacturer’s protocol. The first strand cDNA was purified by QIAquick PCR purification kit (Qiagen Inc., Valencia, CA). PCR reactions were performed using a SYBR® Green PCR Master Mix (Applied Biosystems, Foster City, CA) with the Stratagene Mx3000P Real-Time Thermocyclers (Statagene, La Jolla, CA) according to the manufacturer’s instructions. PCR reactions proceeded at 95°C for 10 min (activation of the Hot Star Taq DNA Polymerase contained in the 2 × SYBR® Green PCR Master Mix) followed by 35 cycles at 95°C for 30 sec, 56°C for 30 sec and extension at 72°C for 30 sec. For normalization, the housekeeping gene beta-actin was employed. The relative mRNA levels of these enzymes were calculated by Pfaffl’s mathematical method and presented as relative ratio of the control [25]. All PCR products were sequenced and verified to be the target gene by SEQWRIGHT, INC (Houston, TX).
Table 1.
PCR primer sequences and target size for each gene studied
| Genes | Primer Sequences (From 5′ to 3′) | PCR product (bp) |
|---|---|---|
| Beta-actin | 110 | |
| FP | GATGACCCAGATCATGTTTGAGACC | |
| RP | AGTCCATCACGATGCCAGTGGT | |
|
| ||
| Catalase | 92 | |
| FP | TTTGCCTATCCTGACACTCACCG | |
| RP | TAGTTGGCCACTCGAGCACGGTA | |
|
| ||
| GCS | 196 | |
| FP | ACACCCTCATGAGCATAGACACCA | |
| RP | AACTCCCTCATCCATCTGGCAACT | |
|
| ||
| GPx | 102 | |
| FP | CGCAACGATGTTGCCTGGAACTTT | |
| RP | AGGCTCGATGTCAATGGTCTGGAA | |
|
| ||
| GR | 140 | |
| FP | AACATCCCAACTGTGGTCTTCAGC | |
| RP | TTGGTAACTGCGTGATACATCGGG | |
|
| ||
| GS | 124 | |
| FP | ATGCTGTGCAGATGGACTTCAACC | |
| RP | TGGATGTCAAACAGACGAGCGGTA | |
|
| ||
| SOD | 95 | |
| FP | AACTGCAACAGCTGTGGGAATCAC | |
| RP | ACATTGCCCAGGTCTCCGC | |
Examination of antioxidant defense enzymes and GSH biosynthesis enzymes by Western Blot
The cell pellet was washed with ice-cold PBS containing 1 mM EDTA (5 mL). The cells were then disrupted by three consecutive freeze and thaw cycles and centrifuged at 15,300 × g for 15 min at 4°C to remove membrane fractions. Equal amounts of protein (20–30 μg) from each sample were resolved by SDS-PAGE (12.5%) and transferred onto a nitrocellulose membrane. The membrane was blocked using 5% (w/v) dried milk powder in Tris-buffered saline (TBS) [10 mM Tris-HCl (pH 7.5) and 0.15 M NaCl] at room temperature and incubated with primary antibodies raised against antigens of human origin for 2 h in TBS [rabbit polyclonal SOD-1 and GS (GSH2) antibodies from Santa Cruz Biotechnology, Inc. (Santa Cruz, CA); rabbit polyclonal GCS antibody from Novus Biologicals, Inc. (Littleton, CO); rabbit polyclonal catalase antibody from Calbiochem (San Diego, CA)]. Secondary antibody [Horseradish peroxidase (HRP)-conjugated antibody (BD Biosciences Pharmingen, San Jose, CA)] was then added to the membrane for 1 h at room temperature. Thereafter, the membrane was washed, exposed to HRP substrate (Amersham, UK), and visualized using UVP Bioimaging system. The band intensity was quantified by Lab Works™ image acquisition and analysis software (UVP, Inc., Upland, CA).
Quantification of NAD+, NADH, NADP+, and NADPH
The quantification followed a reported procedure with minor modification [26]. Briefly, the cell pellet was washed with 5 mL ice-cold PBS containing 1 mM EDTA. The nucleotides were extracted with a nucleotide extraction buffer (NADP/NADPH Quantification kit, Biovision, Mountain view, CA) by sonication (4 min). The lysate was added with p-aminobenzoic acid (10 mg/mL, 20 μL) as an internal standard and centrifuged at 4°C (15,300 × g, 20 min). The supernatant (50 μL) was injected into the HPLC. Quantification of each analyte was achieved by referring to standard curves which were constructed by spiking the lysate with various known amounts of corresponding analyte standards.
Statistical Analysis
Data were analyzed using statistical functions in Microsoft Excel and are shown as mean ± S.D. Student t-tests were performed for significance of differences in sample means with a cutoff of p < 0.05.
RESULTS
GR inhibition by 2-AAPA
The average GR activity in the control was determined to be 0.3 unit/mg protein. When incubated with 0.1 mM of 2-AAPA, GR in CV-1 cells was almost completely inhibited for 1 h (Fig. 1). After 1 hour, the GR activity started to return and reached 63%±5.3% (n = 3) of the control at the end of 8 h demonstrating that 2-AAPA effectively inhibited the enzyme for the period studied.
Fig. 1.
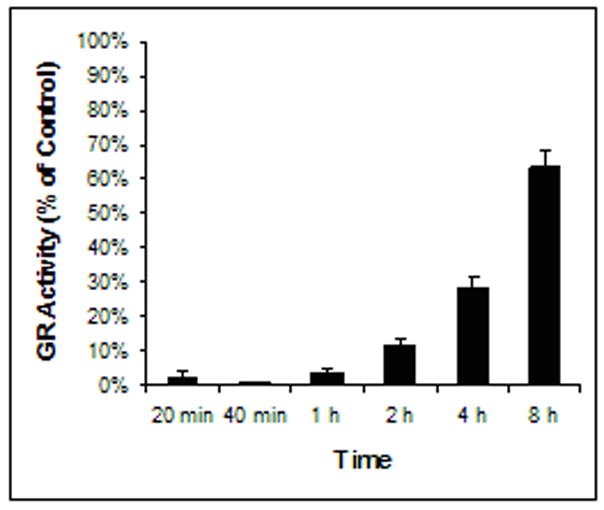
GR inhibition by 2-AAPA in CV-1 cells. CV-1 cells were treated with 0.1 mM 2-AAPA in RPMI 1640 growth medium. GR activities were determined as described under “Materials and Method”. The data are Presented as percentage of GR activity of the control and expressed as the means ± S.D. of three independent experiments. The average GR activity in the control was determined to be 0.3 unit/mg protein.
Effects of GR inhibition on GSH and GSSG
GSH and GSSG were quantified by LC/MS. As presented in Figure 2, GSH in the control samples remained constant over the 8 h period, and the average of the baseline values of GSH over the 8 h period was determined to be 39.53±0.94 nmol/mg protein (n = 18) which is in the range reported for other cell lines [27–29]. Similarly, GSSG in the control samples did not change significantly and the average of the baseline values of GSSG over the 8 h period was determined to be 0.10±0.03 nmol/mg protein (n = 18) (Fig. 3). As expected, inhibition of GR blocked the conversion of GSSG to GSH resulting in an increase in GSSG and decrease in GSH. GSSG in the 2-AAPA-treated samples was found to increase in the range of 5 to 7 fold over that in the controls during the first hour and started to decrease thereafter (Fig. 3), which appears to match the time course of GR inhibition (Fig. 1). At the end of 8 h, GSSG in 2-AAPA-treated samples showed no statistically significant difference as compared to that in the controls (Fig. 3). GSH depletion by 2-AAPA was less profound. An approximately thirty percent reduction in GSH was observed throughout the experiment (Fig. 2).
Fig. 2.
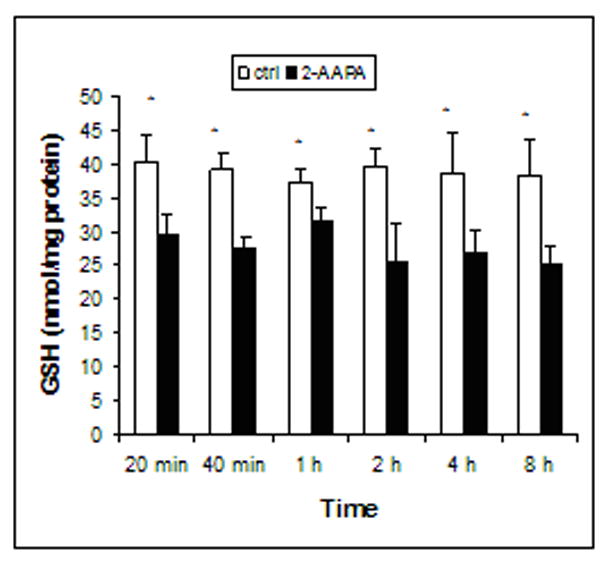
Time course of GSH levels in the control and 2-AAPA (0.1 mM) treated CV-1 cells. GSH was determined by LC/MS as described under “Materials and Methods”. The data are presented as the means ± S.D, of three independent experiments. Differences were statistically significant (p< 0.05, versus control).
Fig. 3.
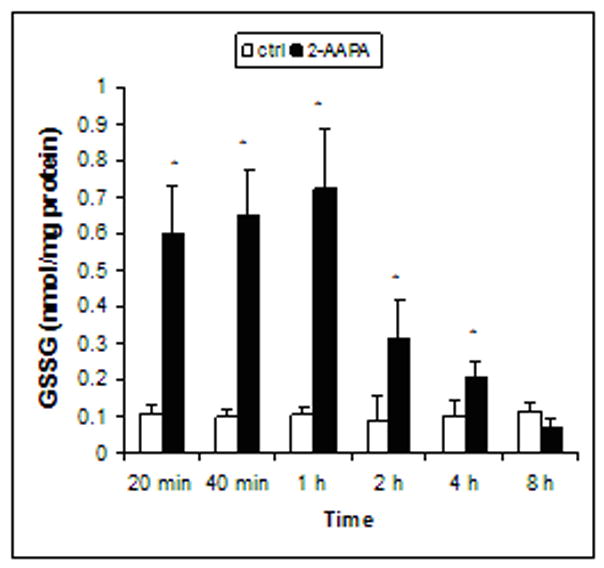
Time course of GSSG in the control and 2-AAPA (0.1 mM) treated CV-1 cells. GSSG was determined by LC/MS as described under “Materials and Methods”. The data are presented as the means ± S.D. of three independent experiments. Differences were statistically significant (*p< 0.05, versus control).
Effects of GR inhibition on protein thiols and protein disulfides
Table 2 presents the time course of protein thiols and protein disulfides. No statistically significant difference was noticed for either protein thiols or protein disulfides at each time point studied between the control and 2-AAPA-treated samples (Table 2).
Table 2.
Protein thiols and disulfides in the control and 2-AAPA (0.1 mM) treated CV-1 cells. Protein thiols and disulfides were determined by HPLC as described under “Materials and Methods”. The data are presented as the means ± S.D. of three independent experiments. No statistically significant difference was found for either protein thiols or protein disulfides at each time point between control and 2-AAPA-treated samples (p<0.05).
| Time | Protein thiols (nmol GSH equivalents/mg protein) | Protein disulfides (nmol GSSG equivalents/mg protein) | ||
|---|---|---|---|---|
| Control | 2-AAPA-treated | Control | 2-AAPA-treated | |
| 20 min | 94.6 ± 23.6 | 84.1 ± 17.7 | 47.4 ± 13.6 | 37.6 ± 12.6 |
| 40 min | 76.0 ± 11.5 | 76.8 ± 10.1 | 54.2 ± 14.3 | 46.7 ± 6.8 |
| 1 h | 89.4 ± 21.4 | 88.3 ± 24.3 | 43.0 ± 14.3 | 53.2 ± 18.5 |
| 2 h | 88.7 ± 12.1 | 79.5 ± 29.4 | 43.8 ± 18.7 | 36.5 ± 14.3 |
| 4 h | 97.4 ± 24.2 | 88.0 ± 53.4 | 38.5 ± 6.9 | 43.6 ± 25.2 |
| 8 h | 109.5 ± 36.8 | 83.6 ± 20.3 | 31.6 ± 12.9 | 57.4 ± 21.5 |
Protein glutathionylation
A comparison of the amount of GSH released from protein-glutathione mixed disulfides (P-S-S-G) upon reduction with NaBH4 between the controls and 2-AAPA-treated samples revealed a significant increase in protein glutathionylation in 2-AAPA treated samples. No GSH release was detected from proteins of the controls while a significant amount of GSH was found in 2-AAPA-treated samples (Table 3). GSH release was found to be highest at 20 min (3.03±1.02 nmol GSH released/mg proteins, n = 3) and started to decrease afterwards. No GSH release was detected in 2-AAPA-treated samples at the end of 8 h (Table 3).
Table 3.
Protein glutathionylation in the control and 2-AAPA (0.1 mM) treated CV-1 cells. Protein glutathionylation was determined by quantification of GSH released from proteins after NaBH4 reduction as described under “Materials and Methods”. The data are presented as the means ± S.D. of three independent experiments.
| Time | GSH released from proteins (nmol GSH/mg protein) | |
|---|---|---|
| Control | 2-AAPA-treated | |
| 20 min | N. D.* | 3.0 ± 1.1 |
| 40 min | N. D. | 2.4 ± 1.0 |
| 1 h | N. D. | 2.3 ± 1.0 |
| 2 h | N. D. | 1.2 ± 0.5 |
| 4 h | N. D. | 0.9 ± 0.3 |
| 8 h | N. D. | N. D. |
N.D. Not detected
Effect of GR inhibition on intracellular ROS production
To determine whether an increase in thiol oxidative stress could lead to an increase in ROS, carboxy-H2DCFDA was employed. Since GR inhibition and thiol oxidative stress were highest in the first hour of incubation, ROS formation in the first hour was monitored. No significant difference in ROS formation was noticed between the control and treated samples at each time point studied (data not presented).
Gene expression evaluation of antioxidant defense enzymes and GSH biosynthesis enzymes by real time RT-PCR
To investigate changes in gene expression in response to the inhibition of GR, real time RT-PCR was employed to measure levels of mRNA for GR, GPx, catalase, SOD, GCS, and GS. The relative mRNA levels of these enzymes were calculated by Pfaffl’s mathematical method [25]. No statistically significant difference was found at each time point between the controls and 2-AAPA-treated samples for all the mRNA levels of the enzymes studied (data not presented).
Protein level determination of antioxidant defense enzymes and GSH biosynthesis enzymes by Western blot
Western blot analysis was employed to analyze the expressed GR, GPx, catalase, SOD, GCS and GS. The commercially available polyclonal antibodies were able to detect catalase, SOD, GCS and GS but failed to detect GR and GPx. The data are presented in Fig. 4. As shown in the figure, no significant difference in protein expression was found for any of the enzymes at each time point between the controls and 2-AAPA-treated samples. Therefore, the data from the Western blot analysis are in line with the data obtained from the real time RT-PCR analysis that GR inhibition did not affect the expression of antioxidant defense enzyme systems (GR, GPx, catalase, and SOD) and GSH biosynthesis enzymes (GCS and GS).
Fig. 4.
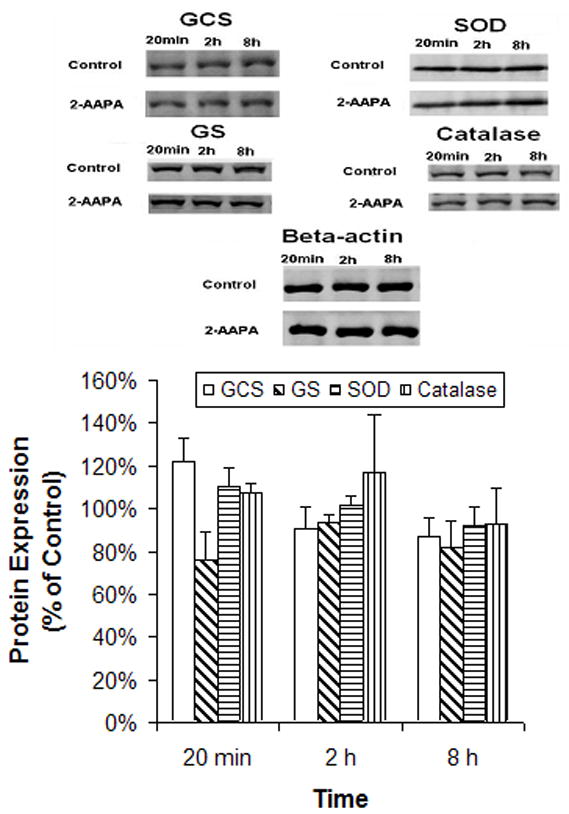
Protein expression determined by Western blot analysis. CV-1 cells were treated with 2-AAPA (0.1 mM) in RPMI 1640 growth medium. Proteins of the enzymes were determined by Western blot as described under “Materials and Methods”. The data are presented as percentage of the control and expressed as the means ± S.D. of three independent experiments.
Intracellular NADPH/NADP+ and NADH/NAD+
NADPH/NADP+ and NADH/NAD+ are two important redox buffers in the cell. The effects of GR inhibition on these two redox buffers were studied. The baseline values for NADPH, NADP+, NADH, and NAD+ in the controls were almost constant over the 8 h incubation period with average values of 0.45±0.05, 0.50±0.04, 2.26±0.08, and 2.94±0.13 nmol/mg protein (n = 18) respectively. When the cells were treated with 2-AAPA (0.1 mM), NADP+ remained unchanged while NADPH was pronouncedly increased at each time point examined (p<0.05, n = 3) (Fig. 5). Interestingly, compared with the controls NAD+ decreased significantly in the 2-AAPA-treated samples while NADH increased at each time point studied (p<0.05, n = 3) (Fig. 5). When the ratios of NADH/NAD+ and NADPH/NADP+ are calculated, both ratios of NADPH/NADP+ and NADH/NAD+ increased at each time point in 2-AAPA-treated samples when compared to the controls (p<0.05, n = 3) (Fig. 6).
Fig. 5.
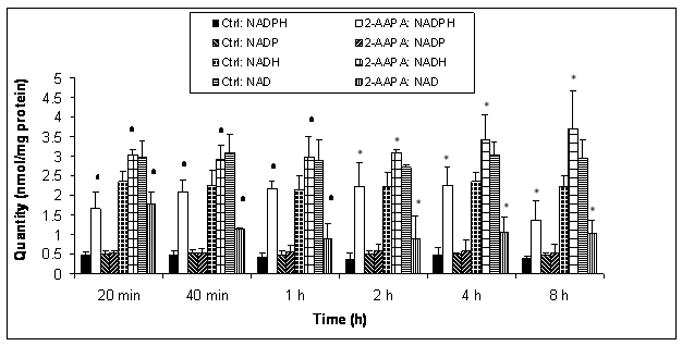
Quantification of NADH, NAD+, NADPH, and NADP+. CV-1 cells were treated with 2-AAPA (0.1 mM) in RPMI 1640 growth medium. NADH, NAD+, NADPH, and NADP+ were quantified by HPLC as described under “Materials and Methods”. The data are presented as means ± S.D. of three independent experiments. No statistically significant differences were found between the controls and 2-AAPA-treated samples for NADP+ at each time point examined while significant (differences were noticed at each time point for NADPH, NADH, and NAD+ (*p< 0.05, versus control).
Fig. 6.
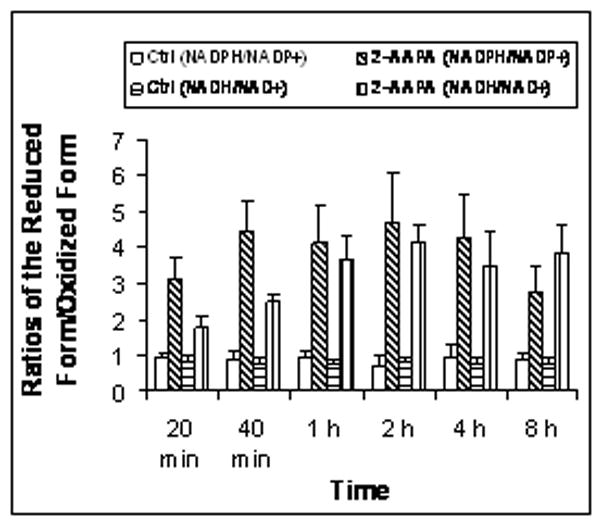
Ratios of NADH/NAD+, NADPH/NADP+ in the control and 2-AAPA treated CV-1 cells. CV-1 cells were treated with 2-AAPA (0.1 mM) in RPMI 1640 growth medium. NADH, NAD+, NADPH, and NADP+ were quantified by HPLC as described under “Materials and Methods”. The ratios of NADH/NAD+. NADPH/NADP+ were calculated and presented as means ± S.D. of three independent experiments. The quantity of NADH, NAD+, NADPH, and NADP+ are presented in Figure 5.
DISCUSSION
Inhibition of GR has been reported to cause depletion of GSH and increase in GSSG. In this study the impact of GR inhibition on cellular thiol redox state and related systems was investigated over an eight hour period. The rationale for choosing the eight hour period is based on the fact that the enzyme was significantly inhibited over this period. Also, this time period is long enough to observe up- or down-regulation of the enzymes examined [28, 30–32]. Further, the cell viability was greater than 75% at the end of the eight hour incubation. This study demonstrates that incubation of CV-1 cells with 2-AAPA (0.1 mM) produced almost complete GR inhibition in the first hour. The GR activity returned to over 60% of the control at the end of 8 h. A return of GR activity was observed previously by Cohen & Duvel in a murine leukemia cell line treated with N,N-bis(2-chloroethyl)-N-nitrosourea (BCNU), which is also an irreversible GR inhibitor [33]. Cohen & Duvel reported that BCNU completely inhibited GR in the cells. After removal of BCNU, fifty percent of the GR activity returned within twelve hours [33]. The return of activity observed by Cohen & Duvel was demonstrated to be dependent on the synthesis of new proteins. Although we did not remove 2-AAPA after GR inhibition in the experiment, 2-AAPA is known to decompose in the cell culture media in 3 h at 37°C (unpublished data from this lab). Therefore, a return of GR activity observed in this study was likely a result of the newly synthesized GR as observed by Cohen & Duvel.
Consistent with the time course of GR inhibition, the highest GSSG accumulation was noticed in the first hour of incubation (Fig. 3). At the end of 2 hours, the levels of GSSG dropped almost 50% (Fig. 3) even though over 80% of the enzyme was still inhibited (Fig. 1) indicating that physiologically GR operates with a large overcapacity. At the end of eight hours, GSSG in the 2-AAPA-treated cells exhibited no significant difference when compared with the control. The change in GSH caused by GR inhibition was moderate. Approximately a 30% decrease in GSH was found throughout the 8 h period in 2-AAPA-treated cells (Fig. 2). These data demonstrated that 2-AAPA effectively inhibited GR and created a state of thiol oxidative stress in the cells in the first hour. The thiol oxidative stress started to diminish with the recovery of the enzyme activity afterwards.
Initially, we were expecting an increase in ROS as a result of GSH reduction. To our surprise, no significant increase in ROS was noticed in 2-AAPA-treated samples. Consistent with this observation, data from Western blots and real time RT-PCR revealed that GR inhibition did not affect the antioxidant defense enzyme system and GSH biosynthesis enzymes. Collectively, these data suggest that the extent of GSH reduction caused by GR inhibition did not reach the point of impairing the cells’ ability to terminate ROS, which probably explains why the expression of antioxidant enzymes and the GSH biosynthesis enzymes were not affected by GR inhibition. Another possibility could also be that GR activity resumed quickly after 1 hour and the newly generated enzyme was high enough not to trigger a change in the antioxidant enzymes and the GSH biosynthesis enzymes. Although GR inhibition did not impair the cell’s ability to terminate ROS, the GR inhibited cells were found to be more labile to additional oxidant insults. In a separate study, GR inhibited cancer cell lines were found to be more sensitive to X-ray radiation (unpublished results from this laboratory).
A comparison of the amounts of GSH released from protein-glutathione mixed disulfides (P-S-S-G) between the controls and 2-AAPA-treated samples demonstrated that significant protein S-glutathionylation occurred in 2-AAPA-treated cells. Protein glutathionylation is involved in various important cellular functions and is known to maintain sulfhydryl homeostasis by protecting protein cysteine residues from irreversible oxidation under oxidative stress conditions [34]. The P-S-S-G has been demonstrated to be quickly deglutathionylated once oxidative stress is over [35], which was observed in this study in that no glutathionylated proteins were detected at the end of 8 h (Table 3) when GSSG in the 2-AAPA-treated samples returned to the same level as that in the control (Fig. 3). Although the time course of the protein glutathionylation appears to correlate well with the formation of GSSG (Fig. 3), most literature reports do not believe that protein glutathionylation is derived from GSSG [34]. At this point, it is not clear what caused the protein glutathionylation. A further investigation into the cause of protein glutathionylation is underway.
In addition to protein S-glutathionylation, protein thiols and protein disulfides were determined in the study. Neither protein thiols nor protein disulfides exhibited significant differences at each time point studied between the controls and 2-AAPA-treated samples. In view of the relatively small quantity increase in protein glutathionylation (~3 nmol GSH released/mg protein) in the context of the large quantity of protein thiols and disulfides, it is not unexpected that an increase in P-S-S-G may not cause a statistically significant decrease in protein thiols and increase in protein disulfides.
The effects of GR inhibition on two other redox buffers, NADH/NAD+ and NADPH/NADP+, were also investigated. The inhibition caused no significant change in NADP+ but a significant increase in NADPH at each time point studied (Fig. 5). Since NADPH provides a reducing equivalent to reduce GSSG to GSH, inhibition of GR would be expected to lead to an accumulation in NADPH. Examination of the increase in NADPH (~0.96 to 1.18 nmol/mg protein) and increase in GSSG (~0.6 nmol/mg protein) suggests that GR inhibition contributed only partially to the increase in NADPH. This conclusion was further confirmed by the observation that the time course of NADPH increase (Fig. 5) did not match completely with that of GSSG (Fig. 3). The inhibition also caused a significant increase in NADH and decrease in NAD+ at each time point (Fig. 5). It is worth noting that by subtracting the NADPH increase derived from a decreased reduction of GSSG from the total NADPH increase, the net increase in NADPH plus the increase in NADH matches relatively closely to the decrease in NAD+ at each time point of the 8 h period (Table 4). This suggests that an increase in thiol oxidative stress may have promoted the conversion of NAD+ to NADH and, possibly, also the conversion of NAD+ to NADP+ which was then reduced to NADPH. In view of the roles NAD+ plays in various biochemical reactions such as redox reactions, ADP-ribosylation, protein deacetylation, and ADP-ribose cyclization [36,37,38], the impact of the decrease in NAD+ on these biochemical reactions remain to be investigated. Since the redox potential is dependent on the ratio of the reduced form vs the oxidized form, a plot of the ratio changes of NADH/NAD+ and NADPH/NADP+ is presented in Figure 6. As shown in the figure, the ratios of both NADH/NAD+ and NADPH/NADP+ were increased substantially at each time point studied. Whether these changes would affect glycolysis and the pentose phosphate pathway remains to be seen. Glycolysis is the metabolic pathway that converts glucose into pyruvate. The free energy released in this process is used to form ATP and NADH. The pentose phosphate pathway is an alternative to the glycolysis pathway. It is the principal source of NADPH which is used for a number of biosynthetic reactions, such as fatty acid and steroid biosynthesis.
Table 4.
The net increase* in NADPH and NADH vs the decrease in NAD+. The data were derived from three independent experiments and presented as means ± S.D.
| nmol/mg protein | ||||||
|---|---|---|---|---|---|---|
| 20 min | 40 min | 1 h | 2 h | 4 h | 8 h | |
| Net increase in NADPH and NADH by 2-AAPA* | 1.39±0.17 | 1.73±0.18 | 1.95±0.21 | 2.52±0.23 | 2.72±0.19 | 2.49±0.29 |
| Decrease in NAD+ by 2-AAPA | 1.21±0.30 | 1.94±0.29 | 2.01±0.37 | 1.83±0.31 | 1.96±0.28 | 1.9±0.32 |
Net increase in NADPH and NADH = Increase in NADPH − NADPH saved from a decreased reduction of GSSG + Increase in NADH.
In summary, this investigation revealed that GR inhibition increased intracellular thiol oxidative stress. Possibly as a cellular defense mechanism against increased thiol oxidative stress, the ratios of NADPH/NADP+ and NADH/NAD+ were also increased. GR inhibition did not appear to impair the ability of the cell to terminate ROS to the extent to cause any significant change in GR, GPx, catalase, and SOD expression. Further, the extent of GSH decrease caused by GR inhibition did not affect the expression of enzymes involved in GSH biosynthesis. These results will help understand the impact of GR inhibition on cellular functions. This study also demonstrates that 2-AAPA effectively increases protein glutathionylation indicating that the compound can be used as a tool in the study of protein glutathionylation.
Acknowledgments
This work was supported by grants from the National Institutes of Health (CA098810-01, CA120062-01) and 2005 South Dakota Governor Rounds’ Individual Research Seed Grant Awards.
Footnotes
Publisher's Disclaimer: This is a PDF file of an unedited manuscript that has been accepted for publication. As a service to our customers we are providing this early version of the manuscript. The manuscript will undergo copyediting, typesetting, and review of the resulting proof before it is published in its final citable form. Please note that during the production process errors may be discovered which could affect the content, and all legal disclaimers that apply to the journal pertain.
References
- 1.Schirmer RH, Krauth-Siegel RL. In: Glutathione, Chemical, Biochemical, and Medical Aspects. Part A. Dolphin D, Poulson R, Avramovic O, editors. III. Wiley; New York: 1989. pp. 553–596. [Google Scholar]
- 2.Meister A, Anderson ME. Annu Rev Biochem. 1983;52:711–760. doi: 10.1146/annurev.bi.52.070183.003431. [DOI] [PubMed] [Google Scholar]
- 3.Jones DP. Methods Enzymol. 2002;348:93–112. doi: 10.1016/s0076-6879(02)48630-2. [DOI] [PubMed] [Google Scholar]
- 4.Mannervik B, Carlberg I, Larson K. In: Glutathione, Chemical, Biochemical, and Medical Aspects. Part A. Dolphin D, Poulson R, Avramovic O, editors. III. Wiley; New York: 1989. pp. 475–516. [Google Scholar]
- 5.Gilbert HF. Methods Enzymol. 1995;251:8–28. doi: 10.1016/0076-6879(95)51107-5. [DOI] [PubMed] [Google Scholar]
- 6.Aon MA, Cortassa S, Maack C, O’Rourke B. J Biol Chem. 2007;282:21889–21900. doi: 10.1074/jbc.M702841200. [DOI] [PMC free article] [PubMed] [Google Scholar]
- 7.Gardiner CS, Reed DJ. Biol Reprod. 1994;51:1307–1314. doi: 10.1095/biolreprod51.6.1307. [DOI] [PubMed] [Google Scholar]
- 8.Meister A. Pharmacol Ther. 1991;51:155–194. doi: 10.1016/0163-7258(91)90076-x. [DOI] [PubMed] [Google Scholar]
- 9.Schirmer RH, Müller JG, Krauth-Siegel RL. Angew Chem Int Ed Engl. 1995;34:141–154. [Google Scholar]
- 10.Davioud-Charvet E, Delarue S, Biot C, Schwobel B, Boehme CC, Mussigbrodt A, Maes L, Sergheraert C, Grellier P, Schirmer RH, Becker K. J Med Chem. 2001;44:4268–4276. doi: 10.1021/jm010268g. [DOI] [PubMed] [Google Scholar]
- 11.Biot C, Dessolin J, Grellier P, Davioud-Charvet E. Redox Rep. 2003;8:280–283. doi: 10.1179/135100003225002916. [DOI] [PubMed] [Google Scholar]
- 12.Fidock DA, Rosenthal PJ, Croft SL, Brun R, Nwaka S. Nat Rev Drug Discov. 2004;3:509–520. doi: 10.1038/nrd1416. [DOI] [PubMed] [Google Scholar]
- 13.Bauer H, Fritz-Wolf K, Winzer A, Kühner S, Little S, Yardley V, Vezin H, Palfey B, Schirmer RH, Davioud-Charvet E. J Am Chem Soc. 2006;128:10784–10794. doi: 10.1021/ja061155v. [DOI] [PubMed] [Google Scholar]
- 14.Arning J, Dringen R, Schmidt M, Thiessen A, Stolte S, Matzke M, Bottin-Weber U, Caesar-Geertz B, Jastorff B, Ranke J. Toxicology. 2008;246:203–212. doi: 10.1016/j.tox.2008.01.011. [DOI] [PubMed] [Google Scholar]
- 15.Franco JL, Posser T, Mattos JJ, Sánchez-Chardi A, Trevisan R, Oliveira CS, Carvalho PS, Leal RB, Marques MR, Bainy AC, Mar AL. Environ Res. 2008;66:88–89. doi: 10.1016/j.marenvres.2008.02.031. [DOI] [PubMed] [Google Scholar]
- 16.Coban TA, Senturk M, Ciftci M, Kufrevioglu OI. Protein Pept Lett. 2007;14:1027–1030. doi: 10.2174/092986607782541060. [DOI] [PubMed] [Google Scholar]
- 17.Kassahun K, Jochheim CM, Baillie TA. Biochem Pharmacol. 1994;48:587–594. doi: 10.1016/0006-2952(94)90290-9. [DOI] [PubMed] [Google Scholar]
- 18.Cereser C, Boget S, Parvaz P, Revol A. Toxicology. 2001;163:153–162. doi: 10.1016/s0300-483x(01)00401-2. [DOI] [PubMed] [Google Scholar]
- 19.Seefeldt T, Zhao Y, Chen W, Raza A, Carlson L, Herman J, Stoebner A, Hanson S, Foll R, Guan X. J Biol Chem. 2009;284:2729–2737. doi: 10.1074/jbc.M802683200. [DOI] [PMC free article] [PubMed] [Google Scholar]
- 20.Chen W, Zhao Y, Seefeldt T, Guan X. J Pharm Biomed Anal. 2008;48:1375–1380. doi: 10.1016/j.jpba.2008.08.033. [DOI] [PMC free article] [PubMed] [Google Scholar]
- 21.Seefeldt T, Dwivedi C, Peitz G, Herman J, Carlson L, Zhang Z, Guan X. J Med Chem. 2005;48:5224–5231. doi: 10.1021/jm050030i. [DOI] [PubMed] [Google Scholar]
- 22.Guan X, Hoffman B, Dwivedi C, Matthees DP. J Pharm Biomed Anal. 2003;31:251–261. doi: 10.1016/s0731-7085(02)00594-0. [DOI] [PubMed] [Google Scholar]
- 23.Hatziapostolou M, Polytarchou C, Katsoris P, Courty J, Papadimitriou E. J Biol Chem. 2006;281:32217–32226. doi: 10.1074/jbc.M607104200. [DOI] [PubMed] [Google Scholar]
- 24.Kalivendi VS, Cunningham S, Kotamraju S, Joseph J. J Biol Chem. 2004;279:15240–15247. doi: 10.1074/jbc.M312497200. [DOI] [PubMed] [Google Scholar]
- 25.Pfaffl MW. Nucleic Acids Res. 2001;29:e45. doi: 10.1093/nar/29.9.e45. [DOI] [PMC free article] [PubMed] [Google Scholar]
- 26.Stocchi V, Cucchiarini L, Canestrari F, Piacentini MP, Fornaini G. Anal Biochem. 1987;167:181–190. doi: 10.1016/0003-2697(87)90150-3. [DOI] [PubMed] [Google Scholar]
- 27.Puiggros F, Llópiz N, Ardévol A, Bladé C, Arola L, Salvadó MJ. J Agric Food Chem. 2005;53:6080–6086. doi: 10.1021/jf050343m. [DOI] [PubMed] [Google Scholar]
- 28.Merrill CL, Ni H, Yoon LW, Tirmenstein MA, Narayanan P, Benavides GR, Easton MJ, Creech DR, Hu CX, McFarland DC, Hahn LM, Thomas HC, Morgan KT. Toxicol Sci. 2002;68:93–101. doi: 10.1093/toxsci/68.1.93. [DOI] [PubMed] [Google Scholar]
- 29.Im JY, Paik SG, Han PL. J Neurosci Res. 2006;83:301–308. doi: 10.1002/jnr.20722. [DOI] [PubMed] [Google Scholar]
- 30.Padgaonkar VA, Leverenz VR, Dang L, Chen SC, Pelliccia S, Giblin FJ. Exp Eye Res. 2004;79:847–857. doi: 10.1016/j.exer.2004.07.001. [DOI] [PubMed] [Google Scholar]
- 31.Verneuil N, Rincé A, Sanguinetti M, Auffray Y, Hartke A, Giard JC. FEMS Microbiol Lett. 2005;252:137–141. doi: 10.1016/j.femsle.2005.08.043. [DOI] [PubMed] [Google Scholar]
- 32.Kwong M, Kan YW, Chan JY. J Biol Chem. 1999;274:37491–37498. doi: 10.1074/jbc.274.52.37491. [DOI] [PubMed] [Google Scholar]
- 33.Cohen MB, Duvel DL. Biochem Pharmacol. 1988;37:3317–3320. doi: 10.1016/0006-2952(88)90645-4. [DOI] [PubMed] [Google Scholar]
- 34.Gallogly MM, Mieyal JJ. Curr Opin Pharmacol. 2007;7:381–391. doi: 10.1016/j.coph.2007.06.003. [DOI] [PubMed] [Google Scholar]
- 35.Chrestensen CA, Starke DW, Mieyal JJ. J Biol Chem. 2000;275:26556–26565. doi: 10.1074/jbc.M004097200. [DOI] [PubMed] [Google Scholar]
- 36.Khan JA, Forouhar F, Tao X, Tong L. Expert Opin Ther Targets. 2007;11:695–705. doi: 10.1517/14728222.11.5.695. [DOI] [PubMed] [Google Scholar]
- 37.Chen L, Petrelli R, Felczak K, Gao G, Bonnac L, Yu JS, Bennett EM, Pankiewicz KW. Curr Med Chem. 2008;15:650–670. doi: 10.2174/092986708783885282. [DOI] [PubMed] [Google Scholar]
- 38.Lin H. Org Biomol Chem. 2007;5:2541–2554. doi: 10.1039/b706887e. [DOI] [PubMed] [Google Scholar]