

Abstract
Objectives
The calcineurin inhibitors (CNIs) cyclosporine A (CsA) and tacrolimus (Tac) help prevent allograft rejection but are associated with nephrotoxicity. Cytochrome P450 2C8 (CYP2C8) and CYP2J2 are polymorphic enzymes expressed in the kidney that metabolize arachidonic acid (AA) to epoxyeicosatrienoic acids, promoting kidney homeostasis. This study examined the association between CNI-induced nephrotoxicity in liver transplant patients and CYP2C8 and CYP2J2 polymorphisms.
Methods
Liver transplantation patients receiving CNIs for at least three years were genotyped for CYP2C8*3, CYP2C8*4, CYP2C8 Haplotypes B and C, and CYP2J2*7 and evaluated for nephrotoxicity (serum creatinine ≥ 1.6 mg/dL) three-years post-transplantation. CYP2C8 proteins were also engineered in E. coli and their activity towards AA and inhibition by CNIs was investigated in vitro.
Results
The risk of kidney dysfunction post-transplantation was positively associated with CYP2C8*3 genotype. Odds ratios for all subjects carrying at least one CYP2C8*3 allele were significant (OR= 2.38 (1.19 – 4.78)). Stratification by CNI indicated a significant association between CYP2C8*3 and nephrotoxicity among patients receiving Tac but not CsA. The risk of renal dysfunction was not significantly influenced by CYP2C8*4, CYP2J2*7, or CYP2C8 haplotype B genotype although inheritance of haplotype C seems to be protective. In vitro, the gene products of CYP2C8*3 and CYP2C8*4 were deficient in AA epoxidation, retaining 26 and 18% of wild type activity respectively. In vivo plasma concentrations of CsA and Tac inhibited CYP2C8 wild type in vitro activity by 17% and 35%, respectively.
Conclusions
Inheritance of CYP2C8*3 is associated with a higher risk of developing renal toxicity in patients treated chronically with CNIs, and especially Tac, possibly by reducing formation of kidney protecting vasodilatory epoxyeicosatrienoic acids.
Keywords: Arachidonic Acid, Calcineurin Inhibitor, Cyclosporine A, CYP2C8, CYP2J2, Liver Transplantation, Nephrotoxicity, Polymorphism, Tacrolimus
INTRODUCTION
The calcineurin inhibitors (CNIs), cyclosporine A (CsA) and tacrolimus (Tac), are commonly used to prevent allograft rejection in solid organ transplantation recipients. Both drugs suppress the activation of calcineurin and block T-lymphocyte proliferation through down regulation of interleukin-2 [1]. In a large retrospective review of liver transplantation recipients throughout the US, patient survival rates (censored for graft loss) three years post-transplantation were 88.9% for patients receiving Tac and 87.8% for patients receiving CsA [2]. Unfortunately, despite this remarkable clinical success, both Tac and CsA have been associated with a variety of toxic effects including nephrotoxicity [3-5]. Importantly, CNI therapeutic blood concentration monitoring does not prevent a large number of patients (30-40%) from eventually developing chronic kidney disease and many patients ultimately exhibit chronic kidney disease Stage V [6].
CNIs cause both acute and chronic nephrotoxicity. The acute toxicity is manifested by reduced renal blood flow and glomerular filtration rate (GFR), effects that are dose-dependent and reversible. These direct effects of CNIs on the renal vasculature and activation of systemic responses may involve activation of the sympathetic nervous system, the rennin-angiotensin system, and the creation of an imbalance between endogenous vasoconstrictive and vasodilatory substances. This imbalance includes an increase in thromboxane A2 and a decrease in prostaglandin E2, as well as an increase in endothelin-1 release and a decrease in the production of nitric oxide [7]. In contrast, chronic nephrotoxicity from CNI therapy is not dose-dependent, and is not reversible. It appears to be the result of structural changes in the kidney caused by chronic changes in renal hemodynamics. The rennin-angiotensin-aldosterone system may also be involved in this toxic response [7,8].
Because dose is not predictive of chronic CNI-induced nephrotoxicity, its development in some but not all patients has been evaluated for identification of contributory risk factors, including genetic variation in renal CNI metabolism and transport genes and genes involved in the rennin-angiotensin system [9-11]. In addition to their effect on T-lymphocyte function, CNIs may also influence the production of endogenous vaso-protective arachidonic acid (AA) metabolites, the epoxyeicosatrienoic acids (EETs) in the kidney. EETs are produced via cytochrome P450 (CYP)-mediated epoxidation of arachidonic acid and are hydrolyzed by soluble epoxide hydrolase to the dihydroxyeicosatrienoic acids (DHETs). EETs have several significant physiological roles that help maintain blood pressure homeostasis, including tubular reabsorption of water and Na+ transport, protection against inflammation, and maintenance of vascular smooth muscle tone [12-16]. Several studies suggest that the EETs are vasodilatory and thus provide protection against hypertension. In particular, it was shown that the 11,12-EET was a vasodilator in rat juxtamedullary nephron preparations, possibly due to its ability to open endogenous potassium channels. The EETs are also inhibitors of Na+-K+-ATPase and angiotensin II-induced natriuresis, contributing to their antihypertensive properties [17,18]. Endogenous pools of EETs, and DHETs have been found in mouse, rat, and human kidney, highlighting the importance of these agents in maintaining normal renal function [19].
Cytochromes P450 2C8 and 2J2 (CYP2C8 and CYP2J2) are important members of the P450 superfamily that are expressed in the kidney and are involved in the metabolism of AA to biologically active EETs [20,21]. CYP2C8 forms mainly 14,15- and 11,12-EET while CYP2J2 forms all four isomers — the 5,6- 8,9- 11,12- and 14,15-EETs [21]. Metabolites formed by CYP2C8 and CYP2J2 have been implicated in preventing hypertension and inhibition of these enzymes has been shown to reduce the concentration of EETs found in the kidney tissue. In addition, both CYP2C8 and CYP2J2 are polymorphically expressed and several variants with compromised activity have been identified (http://www.cypalleles.ki.se/).
The purpose of this study was to test for an association between known CYP2C8 and CYP2J2 polymorphisms and the risk of developing CNI-associated nephrotoxicity in liver transplantation recipients. We hypothesize that patients carrying one or more variant CYP2C8 or CYP2J2 allele will have reduced production of the protective EETs and, therefore, will be at a higher risk of developing kidney toxicity when challenged with CNIs. A retrospective evaluation of a case-control study of kidney function in liver transplantation recipients receiving CNIs for at least three years was performed. In addition, in vitro experiments were carried out to evaluate the activity of different CYP2C8 variants with respect to EET formation and the ability of steady state circulating plasma concentrations of CNIs to inhibit CYP2C8 and CYP2J2 metabolism of arachidonic acid.
METHODS
Materials
The following chemicals were purchased from Sigma-Aldrich Chemical Co. (St. Louis, MO): IPTG, δ-ALA, thiamine, imidazole hydrochloride, DTT, sodium cholate, NADPH, Coomassie brilliant blue R, DLPC, TFA, Protease inhibitors cocktail. E coli C41(DE3) cells and pGRO7 plasmid were purchased from Fisher Scientific (Pittsburgh, PA)Restriction enzymes and other DNA-modifying enzymes were obtained from New England BioLabs (Beverly, MA). Platinum Pfx DNA polymerase, T4 DNA ligase, and E. coli DH5αF’IQ Max Efficiency Competent cells were purchased from Invitrogen (Carlsbad, CA). Bactotryptone, bactopeptone, and bactoyeast extract were obtained from BD Biosciences Clontech (Palo Alto, CA). Ni-NTA Superflow was from Qiagen (Valencia, CA), Emulgen 911 was from Kao Corporation (Tokyo, Japan). Baculovirus-insect cell microsomes (Supersomes®) containing expressed CYP2J2 or CYP2C8, co-expressed human cytochrome P450 reductase and human cytochrome b5 were purchased from BD Gentest Corporation (Woburn, MA). All standards for the analysis of arachidonic acid metabolism (14,15-EET, 11,12-EET, 5,6-EET, 8,9-EET, d8-14,15-EET and 20-HETE) were available from Cayman Chemicals (Ann Arbor, Michigan).
Study Subjects
Subjects for this study were consented for an evaluation of the association between genes directly or indirectly involved in CNI disposition and effect, and chronic kidney disease. The first association was found with ABCB1 genotype and post-liver transplantation CNI-induced chronic kidney disease [11]. A total of 200 liver transplantation patients were consented. From this pool, final eligibility for inclusion was defined as any non-Hispanic, Caucasian adult patient who underwent a liver-only transplantation at the University of Washington Medical Center (UWMC) between 1989 and 1999, received continuous CsA or Tac immunosuppressive therapy post-transplantation, and were at least three years from the time of transplantation. A total of 163 subjects were found to be eligible and included in the present association study. Consent for using this population for the current study was approved by the Institutional Review Board at the University of Washington (current HSRC approval number 01-19746-D, approved 8/13/2004). The original study reported on data from 120 subjects; the present study includes an additional group of subjects not in the original study that met all of the current study eligibility criteria.
DNA Analysis
DNA was obtained from the study subjects and genotyped for the absence or presence of CYP2C8 *3 (associated with haplotype D) and CYP2C8*4 variants (rs10509681, rs11572080 and rs1058930 respectively), the CYP2C8 haplotypes B and C (characterized by rs7909236 and rs1113129, respectively),[22] and the CYP2J2*7 and N124S (rs890293 and rs11572243 respectively) variants of CYP2J2. These are the most common variant alleles for these two genes in a Caucasian population.
All single nucleotide polymorphism (SNP) detection assays were designed and performed in the Functional Genomics Laboratory, Center for Ecogenetics and Environmental Health at the University of Washington, Seattle, WA. Samples were genotyped using 5′-nuclease assays which employ specific fluorogenic probes and uses probes and primers designed and optimized by the Assay-by-Design service offered by Applied Biosystems (Foster City, CA).
The sequences for all primers and fluorogenic allele-specific oligonucleotide probes are listed in Supplemental Table 1. All probes were 3′-labeled with the TAMRA quencher dye. In addition, the specific wild type and variant probes were 5′-labeled with the 6-FAM reporter dye and the VIC reporter dye, respectively. All probes were designed on the “sense” strand, unless otherwise indicated as “anti”. The fluorescent 5′-nuclease assays were performed and analyzed on an Applied Biosystems 7900HT Fast Real-Time PCR System. The specific PCR reaction conditions were based on the general guidelines provided by the manufacturer and incorporated 25-50 ng of genomic DNA template. Thermocycling parameters are also listed in Supplemental Table 1.
Demographic and Clinical Information
Relevant clinical data for all subjects was abstracted from the written and electronic medical records. This included lab values associated with kidney (serum creatinine (SCr), and blood urea nitrogen concentrations) and liver (alanine aminotransferase, aspartate aminotransferase, gamma glutamyl transferase, albumin, bilirubin and prothrombin time) function. It also included a record of all concomitant medications thought to be nephrotoxic, kidney protective or that can influence affect the clearance of CNIs, as well as CNI dosage and trough blood concentrations over the first three years post-transplantation. Other conditions that might affect post-transplantation kidney function were ascertained, including pre-transplantation kidney disease, pre- and post-transplantation hypertension (subjects with pre-transplantation hypertension were defined as those patients requiring medication for hypertension for at least six months prior to transplantation while post-transplantation hypertension was defined as hypertension that required medication for at least six months) and pre- and post-transplantation hyperglycemia as previously described [11].
Clinical Endpoints
Kidney function, as measured by serum creatinine (SCr) three years post-transplantation, was correlated with CYP2C8 and CYP2J2 genotype. A chronic kidney disease case was defined a priori as a patient with a SCr ≥ 1.6mg/dL while a control case was defined as having a SCr < 1.6mg/dL. An evaluation of the frequency distribution of SCr concentrations at three years post transplantation in the study subjects by commingly analysis has been described [11]. It was determined that SCr values were trimodally distributed and that the SCr value of 1.6 mg/dl fell between the means of the first two distributions [11]. This supports the use of a SCr value of 1.6 mg/dl to differentiate between cases and controls [11]. Data on subject pre-transplantation kidney function was also obtained. The same SCr values defining cases and controls were used to define pre-operative kidney function. Pre-transplantation kidney function was considered normal if the SCr was <1.6mg/dL, while pre-transplantation kidney disease was defined as SCr ≥ 1.6mg/dL. Other means of defining kidney dysfunction were either not available for this analysis or were considered inappropriate for this study population. A measured glomerular filtration rate (GFR) would have been an ideal means of defining kidney dysfunction, but this data was not available. Data was available for defining kidney dysfunction using several equations to calculate GFR, but none of these estimates of kidney dysfunction are appropriate in this post liver-transplantation population [23].
Determining the of Risk of Kidney Disease
Hardy-Weinberg equilibrium was determined for all SNPs. Homozygous variants were grouped with heterozygotes for phenotype comparisons against homozygous wild types, because of the low frequency of the variant alleles and because the mutations confer a decrease in function and/or expression levels. Odds ratios (95% confidence intervals) were calculated to evaluate the association between each genotype and kidney disease for all study subjects and also for only those with normal, pre-transplantation renal function. The analysis was further stratified by the use of CsA or Tac and by gender.
Cloning of CYP2C8 WT and Variants
The CYP2C8 cDNA, a gift from Dr. Frank Gonzales at NIEHS, was inserted into the pCWori+ expression vector [24] using the NdeI and Sal1 restriction sites. The modified sequence of Barnes et al. [25], MALLLAVF, was used to replace the first eight amino acids of native CYP2C8.1 and a 6-His tag was inserted at the C-terminus to facilitate purification using metal affinity columns as previously described [26].
CYP2C8 variant expression vectors were constructed using the Quickchange II XL site directed mutagenesis kit and using pCWori+-2C8*1 as a template with the following primers: (for pCWori+-2C8*4 (I264M)), 5′:CAATCCTCGGGACTTTATGGATTGCTTCCTGATCAAAATGG, and 5′:CCATTTTGATCAGGAAGCAATCCATAAAGTCCCGAGGATTG, 1Unit of Pfu Turbo polymerase, and cycling conditions of 95° for 3 minutes followed by 16 cycles of 94° for 35 seconds, 52° for 35 seconds, 72° for 10.5 minutes followed by a 4 hour digestion with Dpn1 to remove template DNA. The CYP2C8*3 allele product contains a double mutation (R139K and K399R) that was sequentially introduced with the first PCR reaction containing the primers, (for K399R), 5′:CCGTGCTACATGATGACAGAGAATTTCCTAATCCAAATATC and 5′:GATATTTGGATTAGGAAATTCTCTGTCATCATGTAGCACGG and pCWori+2C8*1 as a template 1Unit of Pfu Turbo polymerase, and cycling conditions of 95° for 3 minutes followed by 16 cycles at 94° for 35 seconds, 52° for 35 seconds, 72° for 10.5 minutes followed by a 4 hour digestion with Dpn1 to remove template DNA. An individual clone was sequenced to confirm the presence of the mutation (pCWori+2C8 (K399R) and used as a template with the primers (for R139K), 5′:TTGGGATGGGGAAGAAGAGCATTGAGGACCG and 5′:CGGTCCTCAATGCTCTTCTTCCCCATCCCAA, and amplified with the same cycling conditions mentioned above. All genes were sequenced entirely to confirm the introduction of the desired mutations and the absence of other undesired mutations as a result of PCR.
Protein Expression and Purification
LB/ampicillin/chloramphenicol plates were used to select for E. coli C41(DE3) cells freshly co-transformed with each expression plasmid and pGRO7 following the manufacturer’s protocol. Single isolated colonies were used to inoculate 5 ml of LB/ampicillin/chloramphenicol media incubated at 37 °C in a rotary shaker (at 225 rpm) overnight. The following day this starter culture was used to inoculate 500 ml TB media (12 g bactotryptone, 24 g yeast extract, 2 g bactopeptone and 4 ml glycerol per liter), 1 mM thiamine, 100 μg/ml ampicillin, and chloramphenicol (final 40 μg/ml) and incubated at 37 °C in a rotary shaker (at 225 rpm). At one hour post-inoculation, L-arabinose (final 4 mg/ml) was used for induction of chaperone proteins, and at five hours post inoculation, final concentrations of 1 mM IPTG and 0.5 mM δ-aminolevulinic acid were added to the cultures which were then incubated at 28 °C for 48 hours. Cells were harvested by centrifugation at 5000 × g for 10 min, resuspended in storage buffer (100 mM potassium phosphate buffer, (KPi), pH 7.4, containing 20% glycerol), pooled into 50 ml Falcon tubes, and re-centrifuged (4000 × g, 30 min). The bacterial cell pellets were stored at −80 °C until further use.
Frozen pellets were thawed on ice and resuspended in 100 mM KPi (pH 7.4) containing 20% glycerol and protease inhibitors cocktail. Emulgen 911 was added to a final concentration of 1% and the cells were lysed with two passes through the French Press. The resulting mixture was centrifuged for 60 min. (100,000 × g) and the brown-orange supernatant was loaded directly on a Ni-NTA agarose column that had been pre-equilibrated with 10 column volumes of equilibration buffer containing 100 mM KPi pH 7.4, 0.5 M KCl, 5 mM imidazole, 0.05% sodium cholate and protease inhibitors cocktail. A dark orange band was visible at the top of the column following loading of the sample. The Ni-NTA agarose column was washed with five volumes of wash buffer containing (100 mM KPi, pH 7.4, containing 20% glycerol, 40 mM imidazole, 0.05% sodium cholate, 0.1 mM DTT, 100 mM glycine, 0.3 M NaCl and protease inhibitors). The enzyme was eluted with elution buffer containing (100 mM KPi, pH 7.4, 20% glycerol, 250 mM imidazole, and 0.02% sodium cholate) and the dark orange/red fractions were collected, pooled, and dialyzed twice against 100 volumes of resuspension buffer (100 mM KPi, pH 7.4, 20% glycerol). The enzymes were stored as 15-20 μM aliquots at −80 °C.
General Enzyme Reconstitution and Metabolic Assay Procedure
Purified CYP2C8 enzymes (20 pmols) were reconstituted with P450 reductase and cytochrome b5 (ratio of 1:2:1) in DLPC vesicles which have been extruded through a 200 nm pore size membrane. Reconstituted enzymes were diluted to a final volume of 0.5 mL in potassium phosphate buffer (100 mM, pH 7.4 containing 0.1 mM EDTA) after which substrate was added. The mixture was equilibrated at 37 °C for 5 min, and reactions were initiated with NADPH (1.0 mM final volume). After 20 minutes at 37 °C, reactions were terminated with 200 μL cold acetonitrile and internal standard (d8 14,15-EET Cayman Chemicals) was added. After centrifugation the supernatant was removed and analyzed by LC-MS/MS as described below.
Inhibition of CYP2C8 and CYP2J2 by CsA and Tac
Baculovirus-insect cell microsomes (Supersomes®) containing expressed CYP2J2 or CYP2C8, co-expressed human cytochrome P450 reductase, and human cytochrome b5 (20 pmol), were reacted with arachidonic acid (5 μM) in the absence and presence of CsA (0.2 μM) or Tac (0.02 μM) and NADPH (1 mM) in potassium phosphate buffer (0.2 mL). The reactions was allowed to proceed for 20 minutes after which they were quenched with the addition of cold acetonitrile (0.2 mL) and internal standard (d8 11,12-EET 50 ng/mL). After centrifugation, 200 μL of the incubation mixture was analyzed directly by LC-MS/MS.
Arachidonic LC-MS/MS Assay
The quantification of arachidonic acid epoxides and 20-hydroxide was performed on a Waters Aquity Ultra Performance Liquid Chromatography (UPLC) coupled with a Micromass Premier-XE tandem quadrupole mass spectrometer (Waters Corp., Milford, MA). The system was operated using atmospheric pressure electrospray ionization (API-ES) in the negative ion mode. Chromatographic separation of analytes was achieved on a 2.1 × 50mm, 1.7μm, phenyl BEH column (Waters Corp., Milford, MA) using a gradient elution. The initial mobile phase was 80% 10 mM formic acid/20% acetonitrile. There was a linear increase to 60% organic at 11.0 minutes followed by an increase to 100% acetonitrile from 11.2 to 12.5 minutes. Mobile phase components were then returned to initial conditions at 13 minutes. The flow was kept at 0.4 mL/min. throughout and the sample chamber and column were maintained at 5 °C and 40 °C respectively. MS conditions were as follows: capillary voltage, 3.6 kV; the source and desolvation temperatures were 120 °C and 400 °C respectively; the desolvation gas (Nitrogen) flow, 1000 L/Hr; and collision gas (Argon) flow, 0.2 mL/min. The selective reaction monitoring (SRM) analysis used the optimized cone voltages of 10 +/- 1 V and collision voltages of 13 +/-1 volt for all of the epoxides. For the 20-HETE, the optimal cone and collision voltages were 20 and 15 V respectively. The transitions monitored for the individual compounds were: 14,15-EET (m/z 319>219), 11,12-EET (m/z 319>208), 5,6-EET (m/z 319>191), 8,9 and 11,12-EET (m/z 319>167), 8,9-EET (m/z 319>127), d8-14,15-EET (m/z 327>219), 20-HETE (m/z 319>245).
Data Analysis
All odds ratios calculations were performed in Excel (Microsoft Office, 2003). Velocity verses substrate concentration data were analyzed by non-weighted non-linear regression analysis using a single enzyme Michaelis-Menten model in SigmaPlot (SigmaPlot 9.01, Systat, Point Richmond, CA).
RESULTS
Demographics and Incidence of Renal Dysfunction
The characteristics of the study subjects are listed in Table 1. One hundred sixty-three subjects from the original pool of 200 consented patients were eligible for the current analysis, had DNA of adequate quality for genotyping, and had clinical data available for analyzing the relationship between CYP genotype and kidney disease three years post liver transplantation. Of the consented subjects, only adult Caucasians that received a liver-only transplant were eligible. Sixty-four percent of the subjects were men while 36% were women. The average age of the subjects was 48 years.
Table 1.
Subject Characteristics at Three Years Post Transplantation
| Variable | SCr ≥ 1.6 mg/dl (cases) |
SCr < 1.6 mg/dl (controls) |
All Subjects |
|---|---|---|---|
| Demographics; N (percent of total) | |||
| Total | 64 | 99 | 163 |
| Male | 48 (75) | 57 (58) | 105 (64) |
| Female | 16 (25) | 42 (42) | 58 (36) |
| Age at transplantation (years; Mean ± SD) |
50 ± 9 | 47 ± 11 | 48 ± 10 |
|
Relevant concomitant illnesses; N (percent of total) | |||
| Pre-Tx1 SCr ≥ 1.6 mg/dl2 | 11/56 (20) | 10/86 (12) | 21/142 (15) |
| Pre-Tx diabetes | 8 (12) | 11 (11) | 19 (12) |
| With end-organ damage | 5 (8) | 2 (2) | 7 (4) |
| New onset post-Tx diabetes | 16 (25) | 17 (17) | 33 (20) |
| With end-organ damage | 10 (16) | 7 (7) | 17 (10) |
| Pre-Tx hypertension | 4 (6) | 5 (5) | 9 (6) |
| New onset post-Tx hypertension | 46 (7) | 69 (70) | 115 (71) |
| Hepatitis C | 30 (47) | 46 (46) | 76 (47) |
| CNI therapy; mean ± SD | |||
| CsA dose (mg/day) | 299 ± 130 | 288 ± 106 | 292 ± 116 |
| CsA blood concentration (ng/ml) | 150 ± 65 | 131 ± 35 | 138 ± 50 |
| Tac dose (mg/day) | 7.8 ± 3.9 | 6.7 ± 3.9 | 7.1 ± 3.9 |
| Tac blood concentration (ng/ml) | 11.8 ± 3.5 | 10.2 ± 3.2 | 10.7 ± 3.3 |
| Lab Values; mean ± SD | |||
| SCr (mg/dl) | 2.0 ± 0.4 | 1.2 ± 0.2 | 1.5 ± 0.5 |
| Creatinine clearance (ml/min) | 54 ± 20 | 76 ± 22 | 66 ± 24 |
| BUN (mg/dl) | 37 ± 11 | 24 ± 7 | 29 ± 11 |
| BUN:SCr (mg SCr/mg BUN) | 55 ± 275 | 21 ± 5 | 34 ± 171 |
| Serum albumin (gm/dl) | 3.9 ± 0.5 | 4.9 ± 6 | 4.5 ± 5.0 |
| Aspartate aminotransferase (IU/L) | 57 ± 95 | 53 ± 45 | 55 ± 68 |
| Alanine aminotransferase (IU/L) | 57 ± 59 | 60 ± 57 | 58 ± 58 |
| Alkaline phosphatase (IU/L) | 129 ± 109 | 124 ± 114 | 126 ± 112 |
| Total bilirubin (mg/dl) | 1.4 ±2.5 | 1.2 ± 0.9 | 1.3 ± 1.7 |
| Gamma glutamyltransferase (IU/L) | 188 ± 256 | 181 ± 248 | 183 ± 250 |
| Prothrombin time (sec) | 12.6 ± 3.8 | 13.4 ± 2.2 | 12.9 ± 2.9 |
|
Relevant concomitant medications; N (percent of total) | |||
| NSAID/COX-2 Inhibitors | 0 | 0 | 0 |
| Aspirin (low dose) | 13 (20) | 17 (17) | 30 (18) |
| Aminoglycosides | 1 (2) | 1 (1) | 2 (1) |
| Vancomycin | 9 (14) | 3 (3) | 12 (7) |
| Amphotericin B | 1 (2) | 2 (2) | 3 (2) |
| ACE/ARB inhibitors | 11 (17) | 10 (10) | 21 (13) |
| P-glycoprotein/CYP3A inhibitors | 8 (13) | 6 (6) | 14 (6) |
Tx: transplantation
Only 142 of the 163 subjects had pre-transplant kidney function status available.
At the three year post-transplantation time point for evaluating the kidney status of these patients, 39.2% had SCr ≥1.6 mg/dl, defining them as cases. Of the 141 subjects whose pre-transplantation kidney status was known, 15.0% had kidney disease just prior to transplantation. Eleven out of 55 (20%) cases had kidney disease prior to transplantation while 10 out of 86 (12%) controls had kidney disease prior to transplantation. These frequencies for the 163 subjects in this study are very similar to those obtained for the smaller cohort of 120 subjects previously described [11].
Association between CNI-Associated Nephrotoxicity and CYP Genotype
All 163 study subjects were successfully genotyped for the CYP2C8*3 and *4 variants, 155 were successfully genotyped for CYP2C8 haplotype B, 152 were able to be genotyped for CYP2C8 haplotype C, and 162 samples were successfully genotyped for CYP2J2*7 and CYP2J2 N124S. Genotype frequencies in the sample population were as expected and found to be in Hardy-Weinberg equilibrium. The subjects were stratified for analysis by CNI, gender, and kidney status at time of transplantation. One hundred forty-one subjects had pre-transplantation kidney status information available. When subjects were removed from the risk analysis because they showed signs of pre-existing kidney disease at the time of transplantation, there were 120 subjects remaining that qualified for analysis. It is notable that two cases were CYP2C8*3 homozygous whereas all the controls were heterozygotes for the CYP2C8*3 allele or homozygous CYP2C8*1. There were no homozygous mutants for CYP2C8*4 or CYP2J2*7. Three control subjects were homozygous for CYP2C8 Haplotype B. Two control subjects and one case subject were homozygous for CYP2C8 Haplotype C.
The relative risks for developing kidney disease by three years post-transplantation as a function of genotype are presented as odds ratios in Tables 2 and 3. Both tables present the odds ratios first for all subjects, then only for those subjects in good kidney health at the time of transplantation. The data is also stratified by gender. The odds ratios in Table 2 are those calculated when considering the use of any CNI. Table 3 presents the odds ratios for subjects on CsA or Tac separately. Odds ratios are presented with their respective 95% confidence interval in parenthesis. The number of subjects included in each calculation is presented as the “n” for each value. As indicated above, homozygous variants were grouped with heterozygotes for phenotype comparisons against homozygous wild types. All samples were wild type for CYP2J2 N124S SNP, therefore no odds ratios were calculated for that specific CYP2J2 variant. When no odds ratio is presented, there were no subjects in that category carrying a variant allele and odds ratios could not be calculated.
Table 2.
Relative Risk of Kidney Disease Three Years Post-Transplantation for CNIs Combined1
| All Eligible Subjects | |||
|---|---|---|---|
| Genotype | All Subjects | Women | Men |
| 2.38 | 2.19 | 2.82 | |
| (1.19 – 4.78) | (0.66 – 7.30) | (1.15 -6.93) | |
| 2C8*32 | n=163 | n=58 | n=105 |
| 1.31 | -- | 1.21 | |
| (0.38 - 4.50) | (0.33 – 3.68) | ||
| 2C8*43 | n=163 | n=58 | n=105 |
| 1.40 | 0.68 | 1.40 | |
| (0.58 - 3.35) | (0.07 – 6.60) | (0.52 – 3.80) | |
| 2J2*74 | n=162 | n=57 | n=105 |
| 0.87 | 1.52 | 0.75 | |
| (0.5 – 1.7) | (0.5 – 5) | (0.32 – 1.73) | |
| Haplotype B | n=155 | n=57 | n=98 |
| 0.36 | 0.42 | 0.33 | |
| (0.2 – 0.7) | (0.1 – 1.5) | (0.1 – 0.8) | |
| Haplotype C | n=152 | n=56 | n=96 |
| 3.32 | 2.46 | 7.33 | |
| (1.37 – 8.07) | (0.64 – 9.55) | (1.85 – 29.15) | |
| 2C8*32 | n=119 | n=44 | n=77 |
| 1.02 | -- | 0.83 | |
| (0.23 – 4.51) | (0.22 – 4.52) | ||
| 2C8*43 | n=119 | n=44 | n=77 |
| 1.33 | 0.85 | 1.30 | |
| (0.49 – 3.61) | (0.08 – 9.06) | (0.42 – 4.03) | |
| 2J2*74 | n=118 | n=43 | n=77 |
| 0.70 | 0.69 | 0.70 | |
| (0.3 – 1.5) | (0.2 – 2.9) | (0.3 – 1.8) | |
| Haplotype B | n=114 | n=42 | n=72 |
| 0.28 | 0.21 | 0.49 | |
| (0.1 – 0.7) | (0.07 – 0.7) | (0.1 – 2.2) | |
| Haplotype C | n=112 | n=71 | n=41 |
Relative risk is presented as the odds ratio (95% CI)
The wild type allele for 2C8*3 is G; the variant allele is A.
The wild type allele for 2C8*4 is C; the variant allele is G.
The wild type allele for 2J2*7 is G; the variant allele is T.
Table 3.
Relative Risk of Kidney Disease Three Years Post-Transplantation Stratified by CNI1
| All Eligible Subjects | ||||||
|---|---|---|---|---|---|---|
| CsA | Tac | |||||
| Genotype | All Subjects |
Women | Men | All Subjects |
Women | Men |
| 1.44 | 1.27 | 1.65 | 16.67 | 8.25 | -- | |
| (0.7 – 3.2) | (0.3 – 5.5) | (0.6 – 4.4) | (2.8 – 99.6) | (0.8 – 85.6) | ||
| 2C8*32 | n=122 | n=40 | n=82 | n=41 | n=18 | n=23 |
| 1.09 | -- | 1.11 | 2.08 | -- | 1.71 | |
| (0.2 – 5.1) | (0.2 – 5.9) | (0.3 – 16.6) | (0.1 – 8.8) | |||
| 2C8*43 | n=122 | n=40 | n=82 | n=41 | n=18 | n=23 |
| 1.76 | 0.87 | 1.96 | 0.8 | -- | 0.71 | |
| (0.6 – 4.9) | (0.1 – 9.3) | (0.6 – 6.6) | (0.1 – 4.8) | (0.1 – 5.0) | ||
| 2J2*74 | n=122 | n=40 | n=82 | n=40 | n=17 | n=23 |
| 0.97 | 1.61 | 1.00 | 0.61 | 1.50 | 0.29 | |
| (0.5 – 2.1) | (0.4 – 6.9) | (0.4 – 2.6) | (0.2 – 2.5) | (0.2 – 12.8) | (0.04 – 2.0) | |
| Haplotype B | n=116 | n=39 | N=77 | n=39 | n=18 | n=21 |
| 0.36 | 0.49 | 0.33 | 0.38 | 0.29 | 0.38 | |
| (0.2 – 0.8) | (0.1 – 2.3) | (0.1 – 0.9) | (0.1 – 1.6) | (0.03 – 3.4) | (0.1 – 2.3) | |
| Haplotype C | n=113 | n=38 | n=75 | n=39 | n=18 | n=21 |
| Subjects with Normal Kidney Function at Transplantation | ||||||
|---|---|---|---|---|---|---|
| CsA | Tac | |||||
| Genotype | All Subjects |
Women | Men | All Subjects |
Women | Men |
| 2.43 | 1.17 | 4.91 | 15.33 | 13.50 | -- | |
| (0.9 – 6.5) | (0.2 – 6.3) | (1.2 – 20.2) | (1.9 – 122) | (0.9 – 207) | ||
| 2C8*32 | n=89 | n=29 | n=60 | n=32 | n=15 | n=17 |
| 1.01 | -- | 1.08 | -- | -- | -- | |
| (0.2 – 4.8) | (0.2 – 5.8) | |||||
| 2C8*43 | n=89 | n=29 | n=60 | n=32 | n=15 | n=17 |
| 1.69 | 1.13 | 1.76 | 0.80 | -- | 1.25 | |
| (0.5 – 5.5) | (0.1 – 14.3) | (0.4 – 7.0) | (0.1 – 8.5) | (0.1 – 18.0) | ||
| 2J2*74 | n=89 | n=29 | n=60 | n=31 | n=14 | n=17 |
| Haplotype | 0.75 | 0.82 | 0.86 | 0.70 | 0.89 | 0.86 |
| (0.3 – 1.8) | (0.2 – 4.2) | (0.3 – 2.5) | (0.1 – 4.6) | (0.1 – 12.3) | (0.04 – 16.9) | |
| B | n=84 | n=28 | n=56 | n=30 | n=15 | n=15 |
| Haplotype | 0.44 | 0.75 | 0.36 | 0.17 | 0.33 | -- |
| (0.2 – 1.1) | (0.1 – 3.9) | (0.1 – 1.2) | (0.02 – 1.7) | (0.03 – 4.4) | ||
| C | n=84 | n=29 | n=55 | n=28 | n=14 | n=14 |
Relative risk is presented as the odds ratio (95% CI)
The wild type allele for 2C8*3 is G; the variant allele is A.
The wild type allele for 2C8*4 is C; the variant allele is G.
The wild type allele for 2J2*7 is G; the variant allele is T.
As shown in Table 2, when evaluating the risk of developing CNI-associated kidney disease post-transplantation regardless of pre-transplantation kidney status or the CNI used, the presence of the CYP2C8*4 allele or the CYP2J2*7 allele was associated with a trend towards the development of CNI-induced kidney disease although the odds ratios were not significant for all eligible men and women considered together, and for all eligible men. However, the odds ratios determined for male and female subjects with one or more CYP2C8*3 allele evaluated together was significant (OR=2.38 (1.19-4.78)), indicating that the inheritance of this allele is associated with increased risk of developing CNI-induced nephrotoxicity. When all eligible subjects were stratified by gender, the odds ratio for men with a CYP2C8*3 allele was still significant (OR=2.82 (1.15-6.93)); while the odds ratio for women approached but did not reach significance (OR=2.19 (0.66-7.30)).
Table 2 also illustrates that the risk of developing CNI-associated kidney disease post-transplantation for subjects with normal kidney function before their transplantation operation was not significantly influenced by the presence of the CYP2C8*4 allele or the CYP2J2*7 allele, although the risk trended towards significance for men and women evaluated together and for men alone. Similar to the analysis using all eligible study subjects, there was significant association between the presence of the CYP2C8*3 allele and post-transplantation kidney disease for subjects with normal kidney function prior to transplantation: (OR=3.38 (1.39 – 8.19)) for men and women, and for men only the (OR=7.33 (1.85 – 29.15)). The same analysis was not significant for women only.
Table 3 presents the odds ratios calculated as above, except that the odds ratios were calculated separately for CsA and for Tac. Subjects were stratified by pre-transplantation kidney status and gender, as above. For either immunosuppressant, the same trends in risk were seen for CYP2C8*4 and CYP2J2*7 compared to what was seen when the analysis was combined for the two medications. The risk differs between the two drugs when evaluating the presence of CYP2C8*3. Inheritance of the CYP2C8*3 allele was not a significant risk factor for the development of CNI-induced kidney disease for patients of either gender taking CsA, when all eligible subjects were evaluated. In contrast, there was a significant increased risk of kidney disease in patients with the CYP2C8*3 allele who were taking Tac, as seen by the odds ratio of 16.67 (2.8 – 99.6). Only 41 study subjects were on Tac at the time of evaluation. The spread of the confidence interval was large, but the magnitude of the odds ratio was substantial. The risk for developing Tac-induced kidney disease in drug- and gender-stratified groups could not be evaluated in men only. However, the odds ratio for kidney disease in women with the CYP2C8*3 allele and on Tac was not significant.
For subjects with normal kidney health at transplantation, men carrying the CYP2C8*3 allele and receiving CsA had a significant risk of developing kidney disease (OR: 4.91 (1.2 – 20.2)). For subjects carrying the CYP2C8*3 allele and taking Tac, the combination of men and women analyzed together again proved to be significant (OR: 15.33 (1.9 – 122)).
Analysis of the risk of developing CNI-associated kidney disease as a function of CYP2C8 Haplotype B and C showed that Haplotype C may be protective. Significant protective odds ratios were determined for men and women evaluated together and for men evaluated alone regardless of their pre-transplantation renal status when on CsA (OR: 0.36 (0.2 – 0.8) and (OR: 0.33 (0.1 – 0.9)), respectively.
Other Clinical Covariates
Potential clinical covariates listed in Table 1 were evaluated for their effect modifying and confounding contributions for CYP2C8*3, CYP2C8*4 and CYP2J2. These covariates were not found to be effect modifiers but several were found to be significant confounders when evaluated for all eligible men and women grouped together and for men and women grouped together with normal kidney function at transplantation. Due to the limited sample size, confounding was evaluated one covariate at a time. If the inclusion of the covariate in a logistic regression model changed the genotype coefficient by more than 10%, it was deemed a confounder. The ranges of the odds ratios that resulted when adjusting for each covariate individually per genotype are presented in Table 4. The covariates were not consistently confounding across the different genotypes. Liver function laboratory values that were above the normal range did not uniformly affect the odds ratios. Gender and weight also did not uniformly affect the risk of developing kidney disease three years post-transplantation. Except for pre-transplantation kidney status, concomitant diseases also did not uniformly affect the unadjusted odds ratios. Pre-transplantation SCr values ≥ 1.6 mg/dL did increase the risk of having three-year post-transplantation kidney disease for subjects with the CYP2C8*3 and the CYP2J2*7 alleles. Of note, the concomitant administration of other nephrotoxic medications did not affect the risk of developing kidney disease three years post-transplantation. The concomitant administration of medications whose mechanism of action may protect the kidney from CNI-induced nephrotoxicity only lowered the adjusted odds ratio for the CYP2J2*7 allele for all eligible subjects. Interestingly, CsA dose and level each lowered the adjusted odds ratios for subjects with the CYP2C8*3 and CYP2C8*4 genotype. However, consideration of Tac dose and level significantly elevated adjusted odds ratios for subjects with CYP2C8*3 and CYP2C8*4 alleles. These covariates influenced the adjusted odds ratios to the greatest degree.
Table 4.
Range of Adjusted Relative Risks for Kidney Disease Three Years Post Transplantation Stratified by Genotype
| Genotype | Odds Ratios Range | |
|---|---|---|
| All Eligible Subjects | ||
| 2C8 *3 | GG + AG vs AA | 1.62 – 11.76 |
| 2C8*4 | GG + CG vs CC | 0.95 – 1.97 |
| 2J2*7 | TT + GT vs GG | 0.71 – 1.99 |
| Subjects with Normal Kidney Function Prior to Transplantation | ||
| 2C8 *3 | GG + AG vs AA | 2.05 – 12.99 |
| 2C8*4 | GG + CG vs CC | 0.66 – 1.27 |
| 2J2*7 | TT + GT vs GG | 0.46 – 1.96 |
In vitro Metabolism of Arachidonic acid by CYP2C8 and CYP2J2
Expressed human wild-type CYP2C8.1 and CYP2J2.1 were found to be active in epoxygenating arachidonic acid. Both enzymes metabolized arachidonic acid to the 14,15-, and 11,12-EET, but only CYP2J2 formed 8,9-EET, 5,6-EET and 20-HETE, as previously described [21]. The relative production of the 14,15-EET by CYP2C8.1, the CYP2C8.3 and CYP2C8.4 variants, and CYPP2J2.1 are presented in Figure 1 as the percentage of the CYP2C8.1 activity. CYP2J2.1 had less than 20% of the activity towards AA compared to CYP2C8.1. CYP2C8.3 and CYP2C8.4 also exhibited reduced activity towards AA, compared to CYP2C8.1, having approximately 25% and 18%, respectively, of the relative activity of the wild type enzyme. Figure 2 illustrates a comparison of the product formation kinetics of CYP2C8.1 with that of CYP2C8.3 and CYP2C8.4 variants. Assuming simple Michaelis-Menten kinetic behavior, Km and Vmax values were calculated and are presented in Table 5. The intrinsic clearance of 14,15-EET formation of CYP2C8.3 and CYP2C8.4 was 32 and 30% that of the wild-type enzyme respectively. In contrast, the metabolism of AA by CYP2J2 displayed strong substrate inhibition kinetics and kinetic parameters were not estimated at this time.
Figure 1.

14,15-EET Formation by CYP2J2 and CYP2C8. Values are reported as the average of two separate experiments
Figure 2.
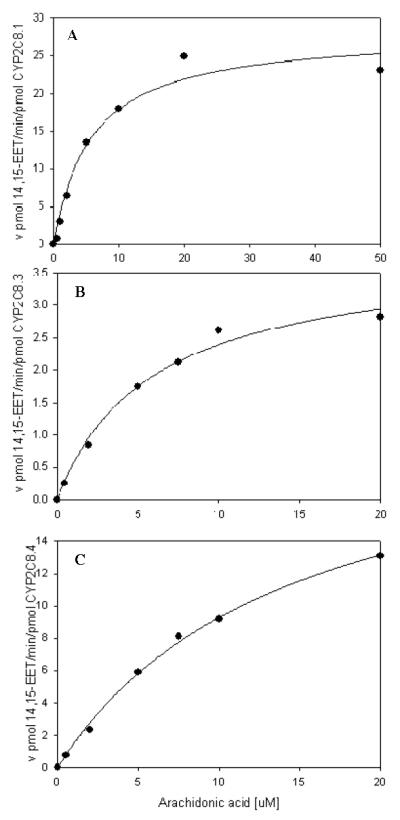
Steady state kinetics for 14,15-EET formation rate by CYP2C8.1 (panel A), CYP2C8.3 (panel B) and CYP2C8.4 (panel C). Data was fitted to a single enzyme Michealis-Menten model. Values are the average of duplicates.
Table 5.
Steady State Kinetic Values for 14,15-EET Formation by CYP2C8 and Variants
| Enzyme | Km (μM) | Vmax (pmol/min/pmol enzyme) |
Vmax/Km |
|---|---|---|---|
| CYP2C8.1 | 5.7 | 28.1 | 4.9 |
| CYP2C8.3 | 14.1 | 22.6 | 1.6 |
| CYP2C8.4 | 3.8 | 5.8 | 1.5 |
Inhibition of EET Formation by CNIs using Expressed Enzymes
Circulating concentrations between the trough and peak concentrations of CsA and Tac (0.2 μM and 0.02 μM respectively) were found to inhibit arachidonic acid metabolism by CYP2C8.1 and CYP2J2.1 (Figure 3). Tac appeared to be a more potent inhibitor than CsA for both enzymes.
Figure 3.

Inhibition of 14, 15-EET Formation by CSA and Tac. The concentration of AA was 5 μM for CYP28 and 10 μM for CYP2J2. The concentrations of CSA and Tac were 0.2 μM and 0.02 μM, respectively. Experiments were run in duplicates and reported as the average.
DISCUSSION
The key finding of this study was the positive association between inheritance of the CYP2C8*3 allele and the risk of developing CNI-induced kidney disease post-liver transplantation. Significant odds ratios were calculated for men and women together, and for men alone. There was a trend towards significance for women, which constituted only 36% of the total study population. The gender difference could be due to the lower baseline SCr for women undergoing liver transplantation, which may result in a miss-classification of case-control status for women. Also in our sample we had more men than women and SCr levels at three years post transplantation were also significantly higher in men compared to women [11]. It is also likely that these findings of increased risk of kidney disease in men compared to women in our sample are not spuriously caused by miss-classification since the literature indicates a greater incidence in general of kidney disease in men compared to women [27,28].
There was a more striking risk of developing kidney disease in patients carrying CYP2C8*3 allele that had good kidney health before their transplantation operation, compared to all patients evaluated together, including those that underwent liver transplantation with existing kidney disease. This signifies that, in patients with good kidney health at the time of transplantation, expressing the CYP2C8*3 allele is a major risk factor for developing kidney disease and that pre-existing kidney disease from various causes (e.g., hepato-renal syndrome) masked the genetic association. It is worth noting that the allele frequency of CYP2C8*3 is only 15-18% of the general white (Caucasian) population. However, inheritance of one or more variant allele compounded with drugs that affect CYP2C8 activity posed a risk that may follow a gene-dose effect.
The data indicates that the use of Tac may cause a greater risk for developing CNI-induced kidney disease than CsA in subjects carrying the CYP2C8*3 allele. Far fewer subjects were administered Tac compared to CsA, making the significant odds ratios calculated for that particular medication appear to be of even greater importance. This finding should be investigated with future studies. However, the present in vitro studies show that Tac is a more potent inhibitor of CYP2C8, which may explain its stronger association with the mutant CYP2C8*3 allele and kidney disease.
The odds ratios calculated for CYP2J2*7 and CYP2C8*4 were not significant for all subjects regardless of pre-transplantation kidney status or gender, although some groupings of subjects trended towards significance (see Tables 2 and 3). No patients carrying the CYP2J2 N124S variant were found in the study population and therefore no odds ratios related to that genotype could be calculated. The lack of statistical significance for the CYP2J2 variants suggests no causality, but this result may also be due to the low frequency of the CYP2J2 genetic polymorphism among the study population. Additionally, it may be explained by the fact that CYP2J2 protein expression in the kidney is low compared to CYP2C8. Using immunohistochemistry, Enayetallah et al. found a higher signal intensity for CYP2C8 protein expression in proximal tubule cells than CYP2J2 in human kidney tissue samples [29]. The apparent protective affect of the CYP2C8 haplotype C is not clear at this time and the functional importance of this haplotype in metabolizing arachidonic acid has not been established. Further studies are needed to address the importance of inheriting this haplotype and risk for developing kidney disease.
The in vitro data described in this paper supports the risk analysis presented above. Both CYP2C8.3 and CYP2C8.4 variant enzymes exhibited markedly reduced activity compared to CYP2C8.1. Reduced activity of CYP2C8.3 towards AA compared to CYP2C8.1 observed has also been demonstrated by Dai et al [30]. In that study, CYP2C8.3 produced only 35-40% of the 11,12- and 14,15-EETs compared to CYP2C8.1. These data, coupled with our clinical observation, indicate that reduced production of EETs by the less active CYP2C8.3 enzyme may contribute to the risk of CNI-induced nephrotoxicity. A possible explanation for why significant odds ratios were not seen for the CYP2C8*4 allele, even though the gene product also has significantly reduced activity towards AA is again attributed to the low numbers of subjects expressing this allele in this study population. A larger population sample size may result in significant odds ratios that would reflect the CYP2C8.4 in vitro activity.
Our data suggest that carrying one or more CY2C8*3 variant allele confers an increased risk for the development of kidney dysfunction in patients receiving chronic CNI therapy. EETs are known to exhibit vasodilatory effects, particularly in the kidney where they have been measured [19]. Decreased production of these molecules in patients with the variant CYP2C8*3 allele may reduce the capacity of the organ to counter the vasoconstrictive effects of the CNIs or may simply confer an independent risk factor that accentuates the kidney toxicity of CNIs. However, our data also offers the intriguing possibility that a drug-induced decrement in CYP2C8-catalyzed EET formation is an initiating, causal factor in the pathogenic process.
Several studies have shown that CsA and Tac inhibit CYP2C8 activity in vivo. For example, CsA was found to increase the AUC of cerivastatin by ∼ 300% [31], paclitaxel by 750% [32] and repaglinide by 143% [33]. All of these drugs are known substrates for CYP2C8 [34]. In addition, one study showed that Tac increased the AUC of cerivastatin by 51% [35]. Inhibition of CYP2C8 by both CsA and Tac in vivo may reduce the formation of the protective EETs in the kidney and precipitate acute toxicity. Several studies support the hypothesis that a decrease in the presence of kidney EETs may contribute to kidney afferent hypertension, a potential mechanism for CNI nephrotoxicity. Renal cortical microsomes from spontaneously hypertensive rats produced more 14,15- and 11,12-EET than microsomes from normotensive rats [19]. Increased urinary excretion of the same EETs was higher in the spontaneously hypertensive compared to the normotensive rats. Although this seems to indicate that the increased EET production is a cause for the hypertension seen in this rat model, the authors suggest that the DHET metabolites of the EETs may be responsible for the increased blood pressure or that the increased EETs may be a response to the elevated blood pressure in these animals. The latter conclusion is supported by further findings by Yu et al [36] showing that reduction of EET hydrolysis by soluble epoxide hydrolase (sEH) inhibition resulted in a drop in blood pressure in the spontaneously hypertensive rat model. Administration of an sEH inhibitor in angiotensin hypertensive rats also decreased blood pressure and caused a decrease in urinary albumin excretion (a marker of renal damage) [37].
There may be other factors that influence the risk of nephrotoxicity in our study subjects. One factor may be the presence of the CYP2C9*2 variant. Although these subjects were not genotyped for this allele, there is strong linkage between CYP2C9*2 and CYP2C8*3. Approximately 95% of subjects carrying CYP2C8*3 also carry CYP2C9*2 genotype [38]. However, CYP2C9 has not been detected in the kidney at the protein or functional level. Accordingly, we did not genotype subjects for this allele because it seems unlikely that it will contribute to the metabolism of arachidonic acid in the kidney.
Besides gaining a better understanding of the risk of developing kidney disease from CNI therapy, and understanding the underlying mechanism of these drugs’ kidney toxic effects, the findings in this study may have additional clinical relevance. The occurrence of some adverse drug-drug interactions may be explained in part by these results. We demonstrated that the CNIs can inhibit CYP2C8 at concentrations that are clinically relevant. The clearance of other drugs that are metabolized by this enzyme may be affected by co-administration with a CNI, resulting in elevated, potentially toxic systemic concentrations of the inhibited drug. This has been shown to be the case for repaglinide [39], and CNIs may also affect the antimalarials amodiaquine and chloroquine [40].
In summary, 2C8*3 appears to be predictive of risk of CNI-induced kidney disease, especially when patients are taking Tac. The findings presented in this paper have significant clinical relevance to care of transplantation recipients that receive CNI based immunosuppression, and those taking other medications that may have drug interactions with the CNIs. It may also have relevance to other conditions of kidney dysfunction. A prospective clinical study is currently underway at the University of Washington to confirm these findings as well as the effect of other genetic polymorphisms on CNI-induced renal toxicity.
Supplementary Material
Acknowledgments
This project was supported in part by NIH grants R01 HL078888 and GM068871. R.A.T. was supported in part by the University of Washington School of Pharmacy Drug Metabolism, Transporter and Pharmacogenomics Research Program (DMTPR) funded by gifts from Abbott, Allergan, Amgen, Bristol-Myers Squibb, Eli Lilly, Hoffman La Roche, Johnson & Johnson, Merck, and Pfizer. DNA analysis for this project was possible through grant #: NIEHS P30ES07033 and the Center for Ecogenetics and Environmental Health, University of Washington.
Footnotes
The authors have no conflicts of interest.
References
- 1.Hamawy MM. Molecular actions of calcineurin inhibitors. Drug News Perspect. 2003;16:277–282. doi: 10.1358/dnp.2003.16.5.829315. [DOI] [PubMed] [Google Scholar]
- 2.Lucey MR, Abdelmalek MF, Gagliardi R, et al. A comparison of tacrolimus and cyclosporine in liver transplantation: effects on renal function and cardiovascular risk status. Am J Transplant. 2005;5:1111–1119. doi: 10.1111/j.1600-6143.2005.00808.x. [DOI] [PubMed] [Google Scholar]
- 3.Healy E, Dempsey M, Lally C, Ryan MP. Apoptosis and necrosis: mechanisms of cell death induced by cyclosporine A in a renal proximal tubular cell line. Kidney Int. 1998;54:1955–1966. doi: 10.1046/j.1523-1755.1998.00202.x. [DOI] [PubMed] [Google Scholar]
- 4.Neuberger J. Liver transplantation. J Hepatol. 2000;32:198–207. doi: 10.1016/s0168-8278(00)80426-2. [DOI] [PubMed] [Google Scholar]
- 5.Vincenti F, Ramos E, Brattstrom C, et al. Multicenter trial exploring calcineurin inhibitors avoidance in renal transplantation. Transplantation. 2001;71:1282–1287. doi: 10.1097/00007890-200105150-00017. [DOI] [PubMed] [Google Scholar]
- 6.Ojo AO, Held PJ, Port FK, et al. Chronic renal failure after transplantation of a nonrenal organ. N Engl J Med. 2003;349:931–940. doi: 10.1056/NEJMoa021744. [DOI] [PubMed] [Google Scholar]
- 7.Stratta P, Canavese C, Quaglia M, et al. Posttransplantation chronic renal damage in nonrenal transplant recipients. Kidney Int. 2005;68:1453–1463. doi: 10.1111/j.1523-1755.2005.00558.x. [DOI] [PubMed] [Google Scholar]
- 8.Olyaei AJ, de Mattos AM, Bennett WM. Nephrotoxicity of immunosuppressive drugs: new insight and preventive strategies. Curr Opin Crit Care. 2001;7:384–389. doi: 10.1097/00075198-200112000-00003. [DOI] [PubMed] [Google Scholar]
- 9.Gallon L, Akalin E, Lynch P, et al. ACE gene D/D genotype as a risk factor for chronic nephrotoxicity from calcineurin inhibitors in liver transplant recipients. Transplantation. 2006;81:463–468. doi: 10.1097/01.tp.0000185305.63759.d3. [DOI] [PubMed] [Google Scholar]
- 10.Hauser IA, Schaeffeler E, Gauer S, et al. ABCB1 genotype of the donor but not of the recipient is a major risk factor for cyclosporine-related nephrotoxicity after renal transplantation. J Am Soc Nephrol. 2005;16:1501–1511. doi: 10.1681/ASN.2004100882. [DOI] [PubMed] [Google Scholar]
- 11.Hebert MF, Dowling AL, Gierwatowski C, et al. Association between ABCB1 (multidrug resistance transporter) genotype and post-liver transplantation renal dysfunction in patients receiving calcineurin inhibitors. Pharmacogenetics. 2003;13:661–674. doi: 10.1097/00008571-200311000-00002. [DOI] [PubMed] [Google Scholar]
- 12.Imig JD. Eicosanoid regulation of the renal vasculature. Am J Physiol Renal Physiol. 2000;279:F965–981. doi: 10.1152/ajprenal.2000.279.6.F965. [DOI] [PubMed] [Google Scholar]
- 13.Mallat Z, Nakamura T, Ohan J, et al. The relationship of hydroxyeicosatetraenoic acids and F2-isoprostanes to plaque instability in human carotid atherosclerosis. J Clin Invest. 1999;103:421–427. doi: 10.1172/JCI3985. [DOI] [PMC free article] [PubMed] [Google Scholar]
- 14.Node K, Huo Y, Ruan X, et al. Anti-inflammatory properties of cytochrome P450 epoxygenase-derived eicosanoids. Science. 1999;285:1276–1279. doi: 10.1126/science.285.5431.1276. [DOI] [PMC free article] [PubMed] [Google Scholar]
- 15.Rifkind AB, Lee C, Chang TK, Waxman DJ. Arachidonic acid metabolism by human cytochrome P450s 2C8, 2C9, 2E1, and 1A2: regioselective oxygenation and evidence for a role for CYP2C enzymes in arachidonic acid epoxygenation in human liver microsomes. Arch Biochem Biophys. 1995;320:380–389. doi: 10.1016/0003-9861(95)90023-3. [DOI] [PubMed] [Google Scholar]
- 16.Roman RJ. P-450 metabolites of arachidonic acid in the control of cardiovascular function. Physiol Rev. 2002;82:131–185. doi: 10.1152/physrev.00021.2001. [DOI] [PubMed] [Google Scholar]
- 17.Dos Santos EA, Dahly-Vernon AJ, Hoagland KM, Roman RJ. Inhibition of the formation of EETs and 20-HETE with 1-aminobenzotriazole attenuates pressure natriuresis. Am J Physiol Regul Integr Comp Physiol. 2004;287:R58–68. doi: 10.1152/ajpregu.00713.2003. [DOI] [PubMed] [Google Scholar]
- 18.Wang MH, Smith A, Zhou Y, et al. Downregulation of renal CYP-derived eicosanoid synthesis in rats with diet-induced hypertension. Hypertension. 2003;42:594–599. doi: 10.1161/01.HYP.0000090123.55365.BA. [DOI] [PubMed] [Google Scholar]
- 19.Yu Z, Huse LM, Adler P, et al. Increased CYP2J expression and epoxyeicosatrienoic acid formation in spontaneously hypertensive rat kidney. Mol Pharmacol. 2000;57:1011–1020. [PubMed] [Google Scholar]
- 20.Spiecker M, Darius H, Hankeln T, et al. Risk of coronary artery disease associated with polymorphism of the cytochrome P450 epoxygenase CYP2J2. Circulation. 2004;110:2132–2136. doi: 10.1161/01.CIR.0000143832.91812.60. [DOI] [PMC free article] [PubMed] [Google Scholar]
- 21.Zeldin DC, Moomaw CR, Jesse N, et al. Biochemical characterization of the human liver cytochrome P450 arachidonic acid epoxygenase pathway. Arch Biochem Biophys. 1996;330:87–96. doi: 10.1006/abbi.1996.0229. [DOI] [PubMed] [Google Scholar]
- 22.Rodriguez-Antona C, Niemi M, Backman JT, et al. Characterization of novel CYP2C8 haplotypes and their contribution to paclitaxel and repaglinide metabolism. Pharmacogenomics J. 2007 doi: 10.1038/sj.tpj.6500482. [DOI] [PubMed] [Google Scholar]
- 23.Gonwa TA, Jennings L, Mai ML, et al. Estimation of glomerular filtration rates before and after orthotopic liver transplantation: evaluation of current equations. Liver Transpl. 2004;10:301–309. doi: 10.1002/lt.20017. [DOI] [PubMed] [Google Scholar]
- 24.Guryev OL, Gilep AA, Usanov SA, Estabrook RW. Interaction of apo-cytochrome b5 with cytochromes P4503A4 and P45017A: relevance of heme transfer reactions. Biochemistry. 2001;40:5018–5031. doi: 10.1021/bi002305w. [DOI] [PubMed] [Google Scholar]
- 25.Barnes HJ, Arlotto MP, Waterman MR. Expression and enzymatic activity of recombinant cytochrome P450 17 alpha-hydroxylase in Escherichia coli. Proc Natl Acad Sci U S A. 1991;88:5597–5601. doi: 10.1073/pnas.88.13.5597. [DOI] [PMC free article] [PubMed] [Google Scholar]
- 26.Cheesman MJ, Baer BR, Zheng YM, Gillam EM, Rettie AE. Rabbit CYP4B1 engineered for high-level expression in Escherichia coli: ligand stabilization and processing of the N-terminus and heme prosthetic group. Arch Biochem Biophys. 2003;416:17–24. doi: 10.1016/s0003-9861(03)00278-9. [DOI] [PubMed] [Google Scholar]
- 27.McGuire BB, Watson RW, Perez-Barriocanal F, Fitzpatrick JM, Docherty NG. Gender differences in the renin-angiotensin and nitric oxide systems: relevance in the normal and diseased kidney. Kidney & blood pressure research. 2007;30:67–80. doi: 10.1159/000099150. [DOI] [PubMed] [Google Scholar]
- 28.Munikrishnappa D. Chronic kidney disease (CKD) in the elderly -- a geriatrician’s perspective. Aging Male. 2007;10:113–137. doi: 10.1080/13685530701419096. [DOI] [PubMed] [Google Scholar]
- 29.Enayetallah AE, French RA, Thibodeau MS, Grant DF. Distribution of soluble epoxide hydrolase and of cytochrome P450 2C8, 2C9, and 2J2 in human tissues. J Histochem Cytochem. 2004;52:447–454. doi: 10.1177/002215540405200403. [DOI] [PubMed] [Google Scholar]
- 30.Dai D, Zeldin DC, Blaisdell JA, et al. Polymorphisms in human CYP2C8 decrease metabolism of the anticancer drug paclitaxel and arachidonic acid. Pharmacogenetics. 2001;11:597–607. doi: 10.1097/00008571-200110000-00006. [DOI] [PubMed] [Google Scholar]
- 31.Muck W, Mai I, Fritsche L, et al. Increase in cerivastatin systemic exposure after single and multiple dosing in cyclosporine-treated kidney transplant recipients. Clin Pharmacol Ther. 1999;65:251–261. doi: 10.1016/S0009-9236(99)70104-9. [DOI] [PubMed] [Google Scholar]
- 32.Terwogt JM Meerum, Malingre MM, Beijnen JH, et al. Coadministration of oral cyclosporin A enables oral therapy with paclitaxel. Clin Cancer Res. 1999;5:3379–3384. [PubMed] [Google Scholar]
- 33.Kajosaari LI, Niemi M, Neuvonen M, et al. Cyclosporine markedly raises the plasma concentrations of repaglinide. Clin Pharmacol Ther. 2005;78:388–399. doi: 10.1016/j.clpt.2005.07.005. [DOI] [PubMed] [Google Scholar]
- 34.Totah RA, Rettie AE. Cytochrome P450 2C8: substrates, inhibitors, pharmacogenetics, and clinical relevance. Clin Pharmacol Ther. 2005;77:341–352. doi: 10.1016/j.clpt.2004.12.267. [DOI] [PubMed] [Google Scholar]
- 35.Renders L, Haas CS, Liebelt J, et al. Tacrolimus and cerivastatin pharmacokinetics and adverse effects after single and multiple dosing with cerivastatin in renal transplant recipients. Br J Clin Pharmacol. 2003;56:214–219. doi: 10.1046/j.1365-2125.2003.01870.x. [DOI] [PMC free article] [PubMed] [Google Scholar]
- 36.Yu Z, Xu F, Huse LM, et al. Soluble epoxide hydrolase regulates hydrolysis of vasoactive epoxyeicosatrienoic acids. Circ Res. 2000;87:992–998. doi: 10.1161/01.res.87.11.992. [DOI] [PubMed] [Google Scholar]
- 37.Zhao X, Yamamoto T, Newman JW, et al. Soluble epoxide hydrolase inhibition protects the kidney from hypertension-induced damage. J Am Soc Nephrol. 2004;15:1244–1253. [PubMed] [Google Scholar]
- 38.Yasar U, Lundgren S, Eliasson E, et al. Linkage between the CYP2C8 and CYP2C9 genetic polymorphisms. Biochem Biophys Res Commun. 2002;299:25–28. doi: 10.1016/s0006-291x(02)02592-5. [DOI] [PubMed] [Google Scholar]
- 39.Backman JT, Kajosaari LI, Niemi M, Neuvonen PJ. Cyclosporine A increases plasma concentrations and effects of repaglinide. Am J Transplant. 2006;6:2221–2222. doi: 10.1111/j.1600-6143.2006.01456.x. [DOI] [PubMed] [Google Scholar]
- 40.Gil J, Berglund E Gil. CYP2C8 and antimalaria drug efficacy. Pharmacogenomics. 2007;8:187–198. doi: 10.2217/14622416.8.2.187. [DOI] [PMC free article] [PubMed] [Google Scholar]
Associated Data
This section collects any data citations, data availability statements, or supplementary materials included in this article.