Abstract
Purpose
Local first-order multifocal electroretinogram (mfERG) implicit time (K1-IT) delays have proved to be important and predictive indicators of retinal function in diabetes. To better understand the nature of these delays, the authors examined the spatial association between K1-IT and second-order amplitudes (K2-SNR; a measure of adaptation) in diabetic and control subjects.
Methods
The authors studied K1-IT, K1 amplitude, and K2-SNRs of responses from 35 retinal zones. These were recorded from 20 diabetic patients without retinopathy, 20 patients with mild to moderate nonproliferative diabetic retinopathy (NPDR), and 30 healthy control subjects. The K1-IT and K2-SNR measurements were then adjusted according to normative and subject median values to reduce or remove the effects of retinal location, intersubject differences, and abnormally small K1 amplitudes.
Results
There was no significant association between K1-IT and K2-SNR in the control group (P > 0.05) and only a marginal association in the NoRet group (P = 0.05). In contrast, longer K1-ITs were significantly associated with reduced K2-SNRs in NPDR subjects (P < 0.01). In the NPDR eyes, zones without retinopathic lesions showed a significant association between K1-IT and K2-SNR (P < 0.01).
Conclusions
The results suggest that an association between longer K1-IT and reduced K2-SNR (abnormal adaptation) develops after the appearance of NPDR, but this association does not depend on the presence of colocalized retinopathic lesions.
The multifocal electroretinogram (mfERG) is a noninvasive method for objectively measuring retinal function within localized patches.1–3 The first-order kernel (K1), the average local flash response, is the most commonly studied mfERG component. Whereas diseases of the cone photoreceptors primarily affect the amplitude of K1,2,4,5 the peak implicit time of this component is typically affected to a greater degree in complete congenital stationary night blindness (cCSNB),6 retinal vein occlusion (RVO),7–9 and diabetes.10 –15
In diabetes, local mfERG K1 implicit time delays have been documented in patients without diabetic retinopathy, are more abnormal and frequent in patients with nonproliferative diabetic retinopathy (NPDR), and are spatially associated with the presence of NPDR and its severity.10,11 More important, these delays are locally predictive of future NPDR development.11,12,16 In contrast, local mfERG K1 amplitudes are not as affected by early diabetic retinal dysfunction or mild to moderate NPDR.10,17
Although local K1 mfERG implicit time delays provide important and predictive indicators of retinal function in diabetes, the pathophysiology underlying the delays is not yet understood. However, K1 implicit time delays have been associated with abnormalities of fast adaptation that may provide clues regarding their sources.3,6,18 The first slice of the second-order kernel (K2) of the mfERG represents the alteration in the mean focal flash response when it is immediately preceded by a focal flash compared with when it is immediately preceded by a dark stimulus.19 Thus, K2 represents a form of two-flash interaction reflecting the activity of fast adaptive mechanisms in the retina, presumably originating in the middle and inner retinal layers.20 –22 In cCSNB, K1 is delayed in implicit time and normal in amplitude, whereas K2 amplitude is severely attenuated.6 Recently, similar findings have been reported in a small sample of diabetic patients with clinically significant macular edema (CSME) and visual field defects.18 These findings have been interpreted as abnormalities originating in the outer plexiform layer of the retina.6,18 In addition to the K1 delays discussed earlier, K2 amplitude attenuation has been documented extensively in patients with diabetes, both with and without NPDR.14,23–26 Taken together, these results suggest that dysfunction within the outer plexiform layer of the retina contributes to the K1 delays and the K2 amplitude reductions (abnormal adaptation) observed in diabetes.
The purpose of the present study was to examine the spatial association between K1 implicit time and K2 amplitude in diabetic subjects. We examined the spatial associations in three groups of subjects: healthy controls, diabetic patients without retinopathy, and diabetic patients with mild to moderate NPDR. Our hypothesis was that, if abnormalities of fast adaptive mechanisms are indeed related to the local K1 implicit time delays observed in diabetes, K1 implicit time and K2 amplitude should be spatially associated across the retina.
Subjects and Methods
Subjects
mfERGs were recorded from one eye of each of 20 diabetic patients without retinopathy in either eye (NoRet group; 48.9 ± 12.2 years old), 20 diabetic patients with mild to moderate NPDR (NPDR group; 51.1 ± 9.3 years old), and 30 healthy control subjects (control group; 44.5 ± 11.5 years old). Mean durations of diabetes were 6.4 ± 3.3 years in the NoRet group and 14.0 ± 9.4 years in the NPDR group. In the NoRet group, five subjects had type 1 diabetes and 15 had type 2 diabetes. Four subjects in the NPDR group had type 1 diabetes and 16 had type 2 diabetes. Retinopathy status was determined from 50° fundus photographs taken within 1 month of mfERG testing and graded by a retina expert who was masked to the other results.
All subjects had best-corrected visual acuity of 20/20 or better, no history of disease unrelated to diabetes, clear ocular media, and no refractive errors outside the range of −6.0 to +4.0 D. The purposes and potential risks of the study were explained, and informed consent was obtained from all subjects before testing. This study adhered to the tenets of the Declaration of Helsinki and was approved by the University of California Committee for the Protection of Human Subjects.
mfERG Recording
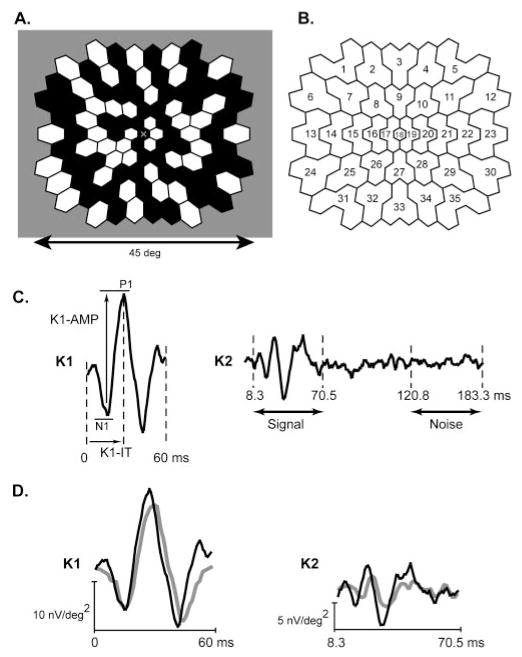
mfERGs were recorded using a visual evoked response imaging system (VERIS Science 4.3; EDI, San Mateo, CA). The stimulus consisted of a 103-element hexagonal array (Fig. 1A). Each hexagon alternated between white (200 cd/m2) and black (less than 2 cd/m2) at a video frame rate of 75 Hz according to a 215-1 m-sequence. Luminances of the surround and fixation target were 100 cd/m2. The stimulus, centered at the fovea, covered approximately 45° of the retina. The fellow eye was occluded. An inline eye camera/refractor was used for best focus of the central fixation target and to monitor fixation and lens placement in situ.
Figure 1.
Multifocal stimulus and response analysis. (A) One hundred three hexagonal stimulus elements were modulated between black (less than 2 cd/m2) and white (200 cd/m2) according to an m-sequence. (B) The 103 K1 and K2 waveforms were each averaged within the indicated 35 retinal zones to improve their signal-to-noise ratios. (C) K1: P1 peak implicit time (K1-IT) and N1-P1 amplitude (K1-AMP) of each of the 35 resultant first-order components were measured using a template-scaling method. K2: The SNR of each K2 component (K2-SNR) was calculated by dividing the RMS of the signal epoch (8.3 – 70.5 ms) by the mean of the RMS amplitudes of the 35 noise epochs (120.8 – 183.3 ms) for that subject. (D) Example K1 and K2 waveforms obtained in zone 21 from a healthy control subject (black traces) and a subject with diabetes (gray traces).
Pupils were dilated fully using 2.5% phenylephrine and 1.0% tropicamide, and the cornea was anesthetized with 0.5% proparacaine. A Burian-Allen bipolar contact lens electrode and a ground electrode clipped to the right earlobe were used. Electrode impedance was measured before each recording and kept at less than 5 kΩ. Each recording consisted of 16 segments and was approximately 8 minutes long. If subjects lost fixation during a segment or the segment was contaminated, it was rejected and rerecorded. The signals were filtered at 10 to 300 Hz, amplified 100,000 times, sampled at 1200 Hz, and digitally low-pass filtered off-line (less than 100 Hz). The 103 local K1 and K2 response components were processed, as in our previous studies, with spatial averaging, with one sixth of the neighboring components and one iteration of artifact removal. The components were then exported from the software (VERIS) for analysis.
Data Analysis
The 103 K1 and K2 mfERG waveforms were each averaged within 35 retinal zones (Fig. 1B) to improve the signal-to-noise ratio (SNR). P1 peak implicit time (K1-IT) and N1-P1 amplitude (K1-AMP) of each of the 35 resultant first-order components were measured using a template-scaling method27 in which the template for each zone was the mean component waveform (0 – 60 ms postflash) of the 30 control subjects at that location (Fig. 1C, K1). In this method, the K1 template at each location was multiplicatively scaled in amplitude and time to minimize the least-squares difference between it and the response measured. K1-AMP was the voltage difference between the scaled N1 trough and P1 peak (Fig. 1C, K1-AMP), and the K1-IT was the time from the local flash to the scaled P1 peak (Fig. 1C, K1-IT). A major advantage of this method is that it was less affected by noise than by direct peak-to-peak amplitude and peak implicit time measurements. In addition, it provided an index of how well the scaled template characterized the measured waveform. A complete description of this method is presented in Hood and Li.27
The SNR of each K2 (K2-SNR) was calculated by dividing the root mean square (RMS) amplitude of the signal epoch (8.3 – 70.5 ms postflash) by the mean of the RMS amplitude of the 35 noise epochs (120.8 – 183.3 ms postflash) for that subject (Fig. 1C, K2). The mean of the 35 noise RMS amplitudes was used because noise varies among different epochs, and, therefore, the mean is the best estimate of the “true” noise within a response kernel. The SNR was then converted to decibels (dB = 10 × log10 [SNR]).
K1-IT, K1-AMP, and K2-SNR normally vary with retinal location. To compensate for this when combining or comparing measurements across locations, median values for each of the 35 zones were calculated for the 30 control subjects, and deviations from these normative median values were calculated for each location or subject. The criterion for response abnormality for each zone was defined as K1-IT values beyond the 95th percentile of the control group and K1-AMP and K2-SNR values below the 5th percentile.
To visualize potential associations between K2-SNR deviations and K1-IT deviations, scatterplots were constructed. To establish whether an association between K2-SNR and K1-IT was statistically significant, a 2 × 2 cell χ2 test was performed. This test does not assume a specific type of association (e.g., linear) but instead tests for a significant trend. When setting up a 2 × 2 table, it is important that all cells have an adequate number of observations. Therefore, before χ2 analyses were performed, the data within each subject group were transformed (shifted) by subtracting the group’s median K1-IT and K2-SNR deviations so that there were adequate frequencies in each cell, allowing for a valid χ2. Values equal to one median, (x,0) or (0,y), were equally assigned to the neighboring cells. (For example, if four values were equal to the K1-IT median, two were assigned to the cell below the median, and two were assigned to the cell above the median.) Values equal to both median deviations (0,0) were excluded from the χ2 analysis because they could not be unambiguously assigned to a cell. This transformation does not significantly affect a potential association between the variables. Instead, it simply shifts the cell borders so that approximately equal numbers of observations occur in the column and row totals.
Results
Differences among the Subject Groups
Examples of zone 21 K1 and K2 waveforms, recorded from a control subject and a diabetic subject, are shown in Figure 1D. The characteristically delayed implicit times and reduced amplitudes observed in subjects with diabetes are illustrated. Differences among the subject groups were examined as follows. We took the subjects’ deviations from the median control values at each retinal location and then averaged across these deviations at each location, which resulted in an average “representative eye” for each subject group. This allowed for an equal n of 35 zones that represented each subject group. Using these “representative eyes,” we used t-tests to compare mean differences between groups (with critical P values adjusted for the multiple comparisons).
For each of the following analyses, the NoRet and NPDR groups differed significantly from the control group and from each other (t-tests; n = 35 zones in each group; P < 0.001). As shown in Figure 2A, the distribution of K1-IT deviations progressively increase from the control group (median deviation, 0.14 ms) to the NoRet group (0.83 ms) and the NPDR group (1.29 ms). The distribution of K1-AMP deviations (Fig. 2B) become more negative, indicating lower K1-AMPs, from the control group (median deviation, −0.01 μV) to the NoRet group (−0.03 μV) and the NPDR group (−0.07 μV). Finally, this trend is also seen for the K2-SNR deviations, indicating lower K2-SNRs, from the control group (median deviation, −0.08 dB) to the NoRet group (−0.70 dB) and the NPDR group (−1.15 dB), as shown in Figure 2C. To place the deviation values in context, the median raw score values for the control group were K1-IT = 27.5 ms, K1-AMP = 0.24 μV, and K2-SNR = 5.7 dB.
Figure 2.
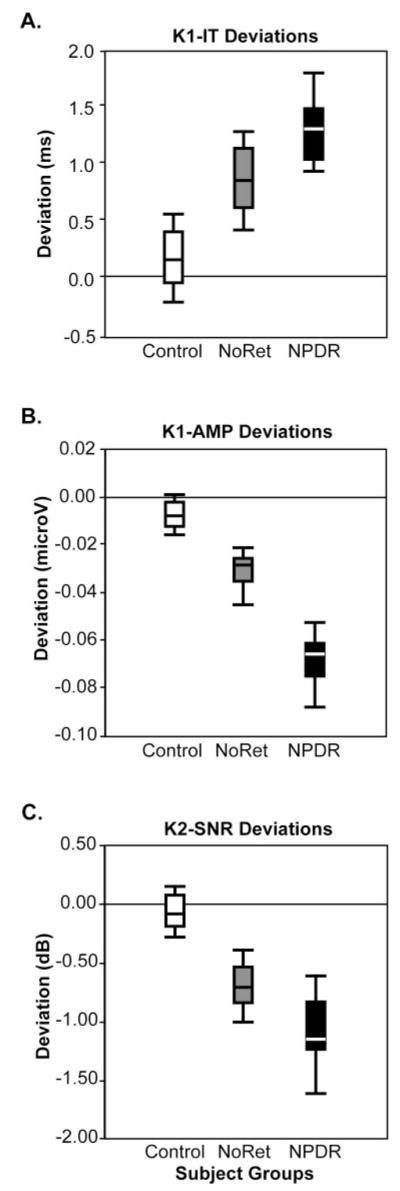
Distributions of deviations from the control medians. (A) K1-IT distributions differed significantly (t-test; n = 35 zones; P < 0.001) among the three groups, with the control group having the shortest median deviation (0.14 ms), the NoRet group having the middle (0.83 ms), and the NPDR group having the longest (1.29 ms). (B) K1-AMP distributions differed significantly (n = 35 zones; P < 0.001) among the groups, with the control group having the smallest median deviation (−0.01 μV), the NoRet group having the middle (−0.03 μV), and the NPDR group having the greatest (−0.07 μV). (C) K2-SNR deviations differed significantly (n = 35 zones; P < 0.001) among the three groups, with the control group median at −0.08 dB, the NoRet group median at −0.70 dB and the NPDR group median at −1.15 dB.
Response abnormalities were most frequent in the NPDR group and least frequent in the control group. The percentage of abnormal responses for the control, NoRet, and NPDR groups were, respectively, 8%, 31%, and 44% for K1-IT, 3%, 7%, and 23% for K1-AMP, and 3%, 10%, and 17% for K2-SNR, as shown in Figure 3. (Abnormalities of exactly 5% were not obtained in the control group. In the case of K1-IT, this was because temporal sampling of the data created bins of 0.83 ms and multiple observations fell within the last bin. For K1-AMP and K2-SNR, a single subject equaled one thirtieth or 3%.) In summary, comparing across the control, NoRet, and NPDR groups, K1-ITs were progressively longer, and K1-AMPs and K2-SNRs were progressively smaller.
Figure 3.
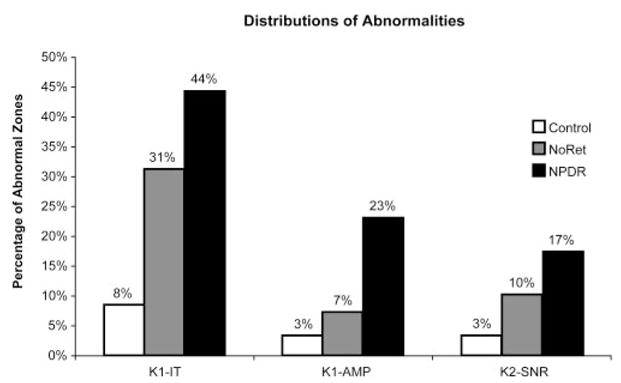
Percentages of retinal zones with abnormal K1-IT, K1-AMP, and K2-SNR measurements for the control (white bars), NoRet (gray bars), and NPDR (black bars) groups. Comparing across the control, NoRet, and NPDR subject groups, all three mfERG component measurements were progressively more frequently abnormal.
Local Associations between K1-IT and K2-SNR
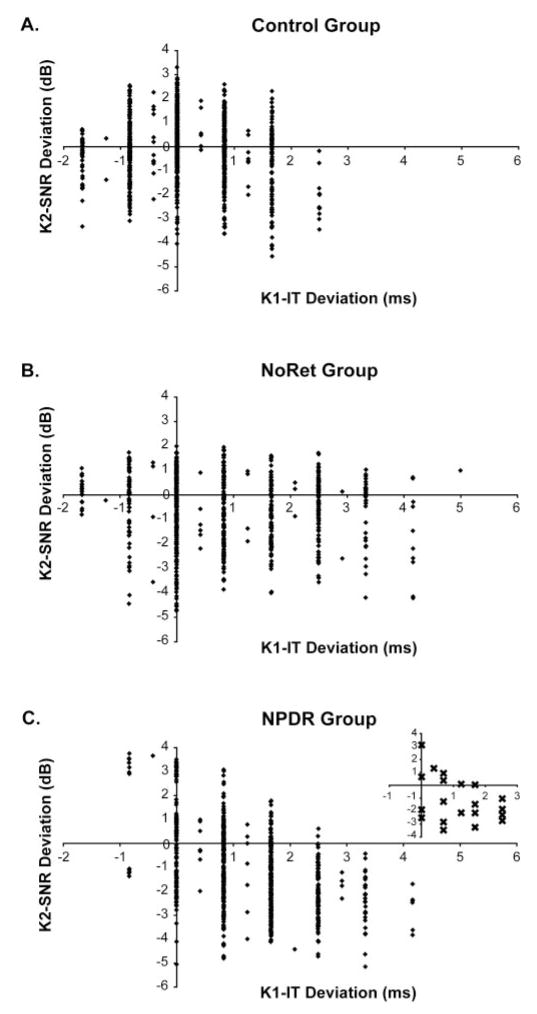
Next, we examined whether, for each subject group, there was an association between K1-IT and K2-SNR across subjects. In the control group, K2-SNR decreased slightly as K1-IT increased (Fig. 4A). Based on the χ2 analysis, this association was not significant (n = 1050 zones; χ2 = 1.34; P = 0.25). A similar nonsignificant trend was observed in the NoRet group, as shown in Figure 4B (n = 700 zones; χ2 = 3.02; P = 0.08). In contrast, as shown in Figure 4C, greater (delayed) K1-IT was significantly associated with reduced K2-SNR in the NPDR group (n = 700 zones; χ2 = 67.46; P < 0.001).
Figure 4.
Association between K2-SNR and K1-IT across subjects. (A) In the control group, K2-SNR decreased only slightly as K1-IT increased (n = 1050 zones; χ2 = 1.34; P = 0.25). (B) A similar nonsignificant trend was observed in the NoRet group (n = 700 zones; χ = 3.02; P < 0.08). (C) In contrast, reduced K2-SNR was significantly associated with longer (delayed) K1-IT in the NPDR group (n = 700 zones; χ2 = 67.46; P < 0.001). Inset: median values for each NPDR subject, illustrating the contribution to the association made by the differences among these subjects.
It is possible that differences among subjects contributed to the presence or absence of the associations described. This possibility is illustrated in the graph inset within Figure 4C, in which the median K1-IT and K2-SNR values are plotted for each NPDR subject. To reduce the potential influence of inter-subject differences, for each subject the median K1-IT, K1-AMP, and K2-SNR deviations were subtracted from the subject’s 35 corresponding deviation values. This centered each subject’s cluster of values at 0,0 (where the x and y axes intersect) so that when the data of all subjects within a group were combined, median differences among the subjects were no longer a factor potentially contributing to, or detracting from, an association.
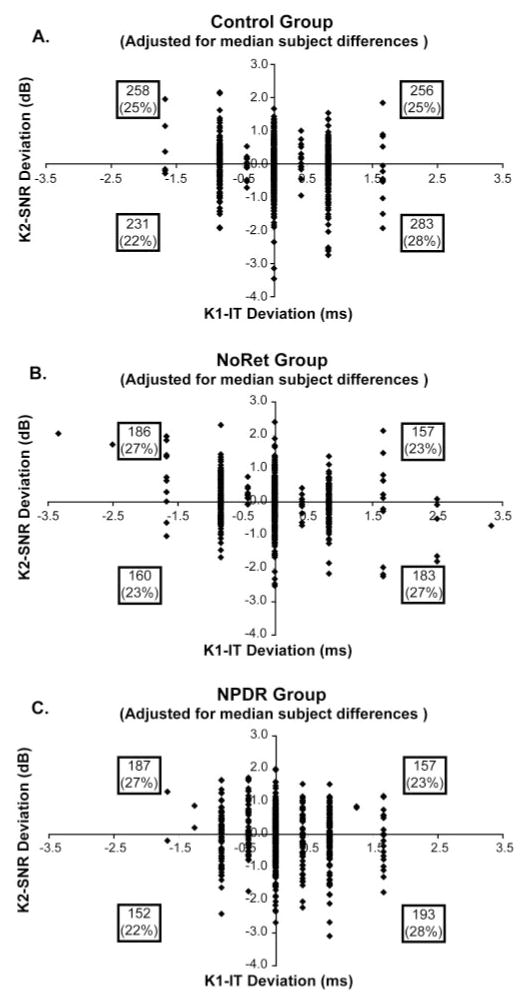
Results of the analysis with median intersubject differences removed are shown in Figure 5. In this figure, the numbers within the boxes (one per quadrant) indicate the number of data points per quadrant, and the number in parentheses is the percentage of data points in the quadrant relative to the total number of points in the χ2. A negative association between K1-IT and K2-SNR is indicated when the greatest number of data points fell within the upper-left and lower-right quadrants. This analysis confirmed that there was not a significant association between K1-IT and K2-SNR in the control group (n = 1028 zones; χ2 = 2.84; P > 0.05) and that there was only a marginally significant association in the NoRet group (n = 686 zones; χ2 = 3.94; P = 0.05), as shown in Figures 5A and 5B, respectively. In contrast, longer K1-ITs were significantly associated with reduced K2-SNRs in the NPDR subjects (n = 689 zones; χ2 = 7.31; P < 0.01), as shown in Figure 5C. Even when limiting our analysis to only zones with normal K1-AMP (not shown), the association remained significant in the NPDR group (n = 526 zones; χ2 = 5.95; P < 0.01). To examine how consistent these trends were among the subjects within each group, we performed regression separately on each subject’s data. This analysis showed that most of the NPDR group (14/20 = 70% of subjects) demonstrated the negative association that the χ2 analysis indicated for the group as a whole. In contrast, only 17 of the 30 (57%) control subjects and 11 of the 20 (55%) NoRet subjects show this trend, in agreement with their χ2 results.
Figure 5.
Spatial association between K2-SNR and K1-IT, with median intersubject differences removed. Numbers within the boxes (one per quadrant in each graph) indicate the number of data points per quadrant, and the number in parentheses is the percentage of points in the quadrant. (A) No significant association between K2-SNR and K1-IT in the control group (n = 1028 zones; χ2 = 2.84; P > 0.05). (B) Weak association in the NoRet group (n = 686 zones; χ2 = 3.94; P = 0.05). (C) In contrast, reduced K2-SNR is still significantly associated with longer (delayed) K1-IT in the NPDR subjects (n = 689 zones; χ2 = 7.31; P < 0.01).
Do Zones with NPDR Differ from Zones without NPDR in the Same Eyes?
In the above analysis, only the subjects in the NPDR group showed a significant association between K1-IT and K2-SNR after controlling for retinal location and median intersubject differences. However, the question remains whether this association between K1-IT and K2-SNR depended on the colocalized presence of retinopathy.
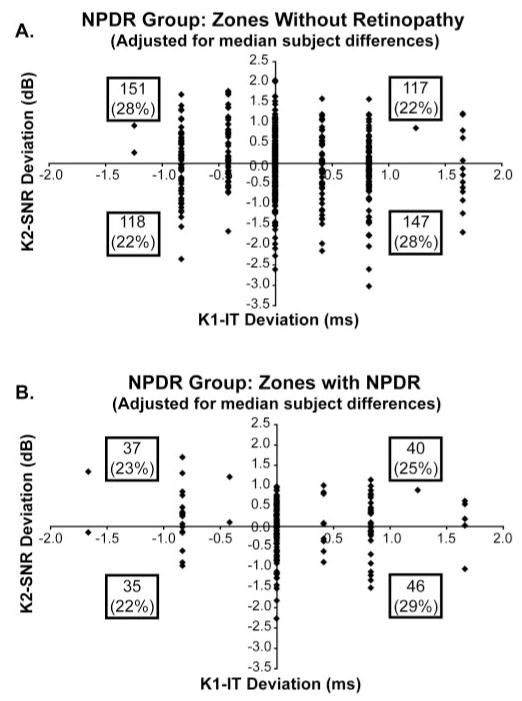
In the NPDR subjects, of the 689 retinal zones available for χ2 analysis, 158 contained at least one retinopathic lesion, and 531 zones contained no lesion. The retinal lesions were composed of microaneurysm (MA) and dot hemorrhage (DH; 17% of the zones), cotton-wool spots (CWS; 1%), hard exudate (HE; 3%), and macular edema (ME; 2%), as shown in Table 1. Whereas retinal zones without retinopathic lesions (Fig. 6A) showed a significant association between longer K1-IT and reduced K2-SNR (n = 531; χ2 = 7.44; P < 0.01), zones containing lesions (Fig. 6B) did not (n = 158; χ2 = 0.37; P = 0.54). The fact that the zones containing lesions did not show a significant association may be attributed in part to the fact that their relatively small number (n = 158) provided insufficient statistical power (β = 0.32). The important result is that colocalized retinopathic lesions were not necessary for the association between longer K1-ITs and diminished K2-SNRs to occur in subjects with NPDR.
Table 1.
Lesion Type and Frequency in NPDR Subjects
| Subject | MA/DH | HE | CWS | ME | Zones (%) |
|---|---|---|---|---|---|
| 1 | 1 | 0 | 0 | 0 | 3 |
| 2 | 1 | 1 | 0 | 0 | 6 |
| 3 | 1 | 2 | 0 | 0 | 9 |
| 4 | 3 | 0 | 0 | 0 | 9 |
| 5 | 2 | 0 | 1 | 0 | 9 |
| 6 | 0 | 3 | 0 | 0 | 9 |
| 7 | 3 | 0 | 0 | 0 | 9 |
| 8 | 7 | 0 | 0 | 0 | 20 |
| 9 | 6 | 0 | 0 | 1 | 20 |
| 10 | 7 | 0 | 0 | 1 | 23 |
| 11 | 8 | 0 | 0 | 0 | 23 |
| 12 | 9 | 0 | 0 | 0 | 26 |
| 13 | 7 | 0 | 0 | 3 | 29 |
| 14 | 7 | 1 | 2 | 1 | 31 |
| 15 | 8 | 2 | 1 | 0 | 31 |
| 16 | 10 | 1 | 0 | 0 | 31 |
| 17 | 9 | 2 | 0 | 1 | 34 |
| 18 | 8 | 4 | 0 | 1 | 37 |
| 19 | 7 | 3 | 3 | 1 | 40 |
| 20 | 16 | 3 | 0 | 4 | 66 |
| Zone totals (%) | 120 (17) | 22 (3) | 7 (1) | 13 (2) | NA |
Figure 6.
Associations in retinal zones with and without retinopathic signs in the NPDR subject group. (A) Retinal zones without retinopathic lesions showed a significant association between longer (delayed) K1-IT and reduced K2-SNR (n = 531; χ2 = 7.44; P < 0.01). (B) Zones containing retinopathic lesions did not demonstrate a significant association between K1-IT and K2-SNR (n = 158; χ2 = 0.37; P = 0.54).
Discussion
This study examined the association between K1-IT and K2-SNR in localized patches of retina to investigate the hypothesis that abnormalities of the fast adaptive mechanisms within the retina are spatially associated with K1 delays. These implicit time and amplitude measurements were adjusted to reduce or remove the effects of retinal location, intersubject differences, and abnormally small K1 amplitudes. Although only weak associations between delayed K1-ITs and smaller K2-SNRs were observed in the control and NoRet subject groups, this association was statistically significant in the subjects with mild to moderate NPDR. These new findings indicated that local K1-IT delays, which are important indicators of diabetic retinal dysfunction10,11 and predictors of the appearance of NPDR,11,12,16 are not necessarily associated with abnormalities of fast adaptive mechanisms reflected in K2 amplitude. An additional new finding was that, in eyes with mild to moderate NPDR, the spatial association between K1-IT and K2-SNR was not dependent on the colocalized presence of retinopathy.
Taken together, these results suggest that the functional integrity of the retina must be compromised to a certain degree before K1-IT and K2-SNR are significantly associated, and that the presence of this association is an indicator of a decline in the overall neurovascular health of the retina. We conclude this because although longer K1-ITs were significantly associated with reduced K2-SNR in retinal locations without lesions in the eyes of diabetic subjects with NPDR, only a weak association was observed in the eyes of diabetic subjects without any NPDR. Furthermore, in the eyes with NPDR, K1-IT was significantly longer and K2-SNR was significantly lower than the corresponding measures in eyes without diabetic retinopathy. It is also important to note that the duration of diabetes was significantly longer in the NPDR group than it was in the NoRet group (t-test; df = 38; P = 0.002).
The present findings extend the mfERG results reported by Greenstein et al.18 for a smaller sample of diabetic patients with CSME. Most (74%) of the retinopathic lesions in our subjects with NPDR were DH and MA. These lesions are associated with less severe mfERG abnormalities than is macular edema (8% of the lesions in our study).10,13 It should be noted, however, that our methods differed from those of Greenstein et al.18 Although we analyzed 35 retinal zones and separately examined zones with and without fundus signs of NPDR, Greenstein et al.18 graphically characterized all stimulated areas with K1-AMPs above a criterion amplitude and did not segregate responses locally on the basis of retinopathy presence or absence. However, an important point of our study is that CSME is not necessary for K2-SNR reduction to be associated with K1-IT delay.
Delayed K1-ITs and reduced K2-SNRs are consistent with abnormal time courses of retinal signal generation and propagation produced by diabetes. Abnormalities of the second-order mfERG kernel and nonlinear components of the first-order kernel were first reported in diabetic subjects by Palmowski et al.23 Abnormal recovery of sensitivity has been demonstrated using a double-flash full-field ERG paradigm, also suggesting abnormal time courses of neural processing in diabetic patients with retinopathy.28 In our study, for diabetic patients with NPDR, the local association between prolonged K1-IT and reduced K2-SNR suggested that these two response abnormalities have a common retinal origin in those eyes. That K1 implicit time delays can occur without locally associated K2 amplitude reduction may be attributed to different rates of development of the two types of functional abnormalities, with K2 amplitude affected later than K1 implicit time. An alternative possibility is that the small size and variable nature of K2 amplitude measures obscure potential associations until later in diabetic eye disease, when the changes become sufficiently large.
Ischemia of the middle and inner retinal layers caused by microvasculopathy likely contributes to the early functional (temporal) abnormalities we measured with the mfERG. A recent study of patients with RVO by Hvarfner et al.9 found that mfERG K1 implicit times were significantly longer in eyes with macular ischemia than in eyes with nonischemic RVO. Delayed mfERGs have also been demonstrated in central5,7 and hemiretinal vein occlusion,8 presumably related to ischemia. Implicit times of K1 were shortened but still significantly delayed compared with normal values in diabetic patients without retinopathy when blood glucose was clamped at hyperglycemic concentrations.14,15
Müller cell abnormalities have also been shown to play a critical role in the development and progression of diabetic eye disease. We know from experimental diabetes models that Müller cells are affected early, before the onset of visible retinopathy.29 –31 Damage to these cells is likely to contribute to abnormal bipolar cell function (the main mfERG generator) because they act as a bridge between vascular and neural cells and as regulators of the K+ gradient across the retina. They also participate in the maintenance of the blood-retinal barrier and play an important role in the uptake and metabolism of extracellular glutamate.32– 40
In conclusion, the present results suggest that temporal abnormalities in the generation and propagation of local retinal signals underlie delayed K1 implicit times and reduced K2 amplitudes (abnormal adaptation) observed in diabetes when NPDR is present. These abnormalities are likely related to retinal ischemia and the toxic effects of elevated blood glucose levels. After a sufficient duration of the disease and the appearance of early NPDR, the functional integrity of the retina is compromised to the extent that there is a spatial association between the K1 implicit time delays and K2 amplitude reductions. This local association does not require colocalized retinopathic lesions. In the future, closer examination of the temporal aspects of local retinal function should provide additional insight on the functional changes leading to the development of diabetic retinopathy.
Acknowledgments
Supported by National Eye Institute Grants EY02271 (AJA) and T32 TY07043 (KB-C).
The authors thank Carl Jacobsen for his initial retinal examinations and retinal photographs, Jason Ng for his clinical expertise and statistical support, and Ken Huie for his technical support.
Footnotes
Disclosure: K.W. Bronson-Castain, None; M.A. Bearse Jr, None; Y. Han, None; M.E. Schneck, None; S. Barez, None; A.J. Adams, None
References
- 1.Sutter EE, Tran D. The field topography of ERG components in man, I: the photopic luminance response. Vision Res. 1992;32:433– 446. doi: 10.1016/0042-6989(92)90235-b. [DOI] [PubMed] [Google Scholar]
- 2.Bearse MA, Jr, Sutter EE. Imaging localized retinal dysfunction with the multifocal electroretinogram. J Opt Soc Am A. 1996;13:634 –640. doi: 10.1364/josaa.13.000634. [DOI] [PubMed] [Google Scholar]
- 3.Hood DC. Assessing retinal function with the multifocal technique. Prog Retin Eye Res. 2000;19:607– 646. doi: 10.1016/s1350-9462(00)00013-6. [DOI] [PubMed] [Google Scholar]
- 4.Kondo M, Miyake Y, Horiguchi M, Suzuki S, Tanikawa A. Clinical evaluation of multifocal electroretinogram. Invest Ophthalmol Vis Sci. 1995;36:2146 –2150. [PubMed] [Google Scholar]
- 5.Kretschmann U, Tornow RP, Zrenner E. Multifocal ERG reveals long distance effects of a local bleach in the retina. Vision Res. 1998;38:1567–1571. doi: 10.1016/s0042-6989(98)00031-5. [DOI] [PubMed] [Google Scholar]
- 6.Kondo M, Miyake Y, Kondo N, et al. Multifocal ERG findings in complete type congenital stationary night blindness. Invest Ophthalmol Vis Sci. 2001;42:1342–1348. [PubMed] [Google Scholar]
- 7.Dolan FM, Parks S, Keating D, Dutton GN, Evans AL. Multifocal electroretinographic features of central retinal vein occlusion. Invest Ophthalmol Vis Sci. 2003;44:4954 – 4959. doi: 10.1167/iovs.03-0083. [DOI] [PubMed] [Google Scholar]
- 8.Dolan FM, Parks S, Keating D, Dutton GN. Wide field multifocal and standard full field electroretinographic features of hemi retinal vein occlusion. Doc Ophthalmol. 2006;112:43–52. doi: 10.1007/s10633-006-0003-0. [DOI] [PubMed] [Google Scholar]
- 9.Hvarfner C, Andreasson S, Larsson J. Multifocal electroretinography and fluorescein angiography in retinal vein occlusion. Retina. 2006;26:292–296. doi: 10.1097/00006982-200603000-00007. [DOI] [PubMed] [Google Scholar]
- 10.Fortune B, Schneck ME, Adams AJ. Multifocal electroretinogram delays reveal local retinal dysfunction in early diabetic retinopathy. Invest Ophthalmol Vis Sci. 1999;40:2638 –2651. [PubMed] [Google Scholar]
- 11.Han Y, Bearse MA, Jr, Schneck ME, Barez S, Jacobsen CH, Adams AJ. Multifocal electroretinogram delays predict sites of subsequent diabetic retinopathy. Invest Ophthalmol Vis Sci. 2004;45:948 –954. doi: 10.1167/iovs.03-1101. [DOI] [PubMed] [Google Scholar]
- 12.Han Y, Schneck ME, Bearse MA, Jr, et al. Formulation and evaluation of a predictive model to identify the sites of future diabetic retinopathy. Invest Ophthalmol Vis Sci. 2004;45:4106 – 4112. doi: 10.1167/iovs.04-0405. [DOI] [PubMed] [Google Scholar]
- 13.Schneck ME, Bearse MA, Jr, Han Y, Barez S, Jacobsen C, Adams AJ. Comparison of mfERG waveform components and implicit time measurement techniques for detecting functional change in early diabetic eye disease. Doc Ophthalmol. 2004;108:223–230. doi: 10.1007/s10633-004-8745-z. [DOI] [PubMed] [Google Scholar]
- 14.Klemp K, Larsen M, Sander B, Vaag A, Brockhoff PB, Lund-Andersen H. Effect of short-term hyperglycemia on multifocal electroretinogram in diabetic patients without retinopathy. Invest Ophthalmol Vis Sci. 2004;45:3812–3819. doi: 10.1167/iovs.03-1260. [DOI] [PubMed] [Google Scholar]
- 15.Klemp K, Sander B, Brockhoff PB, Vaag A, Lund-Andersen H, Larsen M. The multifocal ERG in diabetic patients without retinopathy during euglycemic clamping. Invest Ophthalmol Vis Sci. 2005;46:2620 –2626. doi: 10.1167/iovs.04-1254. [DOI] [PubMed] [Google Scholar]
- 16.Bearse MA, Jr, Adams AJ, Han Y, et al. A multifocal electroretinogram model predicting the development of diabetic retinopathy. Prog Retin Eye Res. 2006;25:425– 448. doi: 10.1016/j.preteyeres.2006.07.001. [DOI] [PMC free article] [PubMed] [Google Scholar]
- 17.Han Y, Bearse MA, Jr, Schneck ME, Barez S, Jacobsen C, Adams AJ. Towards optimal filtering of “standard” multifocal electroretinogram (mfERG) recordings: findings in normal and diabetic subjects. Br J Ophthalmol. 2004;88:543–550. doi: 10.1136/bjo.2003.026625. [DOI] [PMC free article] [PubMed] [Google Scholar]
- 18.Greenstein VC, Holopigian K, Seiple W, Carr RE, Hood DC. Atypical multifocal ERG responses in patients with diseases affecting the photoreceptors. Vision Res. 2004;44:2867–2874. doi: 10.1016/j.visres.2004.06.020. [DOI] [PubMed] [Google Scholar]
- 19.Sutter EE. Imaging visual function with the multifocal m-sequence technique. Vision Res. 2001;41:1241–1255. doi: 10.1016/s0042-6989(01)00078-5. [DOI] [PubMed] [Google Scholar]
- 20.Hood DC, Greenstein V, Frishman L, et al. Identifying inner retinal contributions to the human multifocal ERG. Vision Res. 1999;39:2285–2291. doi: 10.1016/s0042-6989(98)00296-x. [DOI] [PubMed] [Google Scholar]
- 21.Hood DC, Frishman LJ, Saszik S, Viswanathan S. Retinal origins of the primate multifocal ERG: implications for the human response. Invest Ophthalmol Vis Sci. 2002;43:1673–1685. [PubMed] [Google Scholar]
- 22.Hare WA, Ton H. Effects of APB, PDA, and TTX on ERG responses recorded using both multifocal and conventional methods in monkey: effects of APB, PDA, and TTX on monkey ERG responses. Doc Ophthalmol. 2002;105:189 –222. doi: 10.1023/a:1020553020264. [DOI] [PubMed] [Google Scholar]
- 23.Palmowski AM, Sutter EE, Bearse MA, Jr, Fung W. Mapping of retinal function in diabetic retinopathy using the multifocal electroretinogram. Invest Ophthalmol Vis Sci. 1997;38:2586 –2596. [PubMed] [Google Scholar]
- 24.Kurtenbach A, Langrova H, Zrenner E. Multifocal oscillatory potentials in type 1 diabetes without retinopathy. Invest Ophthalmol Vis Sci. 2000;41:3234 –3241. [PubMed] [Google Scholar]
- 25.Bearse MA, Jr, Han Y, Schneck ME, Barez S, Jacobsen C, Adams AJ. Local multifocal oscillatory potential abnormalities in diabetes and early diabetic retinopathy. Invest Ophthalmol Vis Sci. 2004;45:3259 –3265. doi: 10.1167/iovs.04-0308. [DOI] [PubMed] [Google Scholar]
- 26.Tyrberg M, Ponjavic V, Lovestam-Adrian M. Multifocal electroretinography (mfERG) in insulin dependent diabetics with and without clinically apparent retinopathy. Doc Ophthalmol. 2005;110:137–143. doi: 10.1007/s10633-005-4187-5. [DOI] [PubMed] [Google Scholar]
- 27.Hood DC, Li J. A technique for measuring individual multifocal ERG records. In: Yager D, editor. Trends in Optics and Photonics. Washington, DC: Optical Society of America; 1997. pp. 280–283. [Google Scholar]
- 28.Gliem H, Moller DE, Kietzmann G. The double flash ERG in diabetic retinopathy. Acta Ophthalmol (Copenh) 1973;51:85–94. doi: 10.1111/j.1755-3768.1973.tb08250.x. [DOI] [PubMed] [Google Scholar]
- 29.Barber AJ, Antonetti DA, Gardner TW. Altered expression of retinal occludin and glial fibrillary acidic protein in experimental diabetes: the Penn State Retina Research Group. Invest Ophthalmol Vis Sci. 2000;41:3561–3568. [PubMed] [Google Scholar]
- 30.Lieth E, Barber AJ, Xu B, et al. Glial reactivity and impaired glutamate metabolism in short-term experimental diabetic retinopathy: Penn State Retina Research Group. Diabetes. 1998;47:815– 820. doi: 10.2337/diabetes.47.5.815. [DOI] [PubMed] [Google Scholar]
- 31.Rungger-Brandle E, Dosso AA, Leuenberger PM. Glial reactivity, an early feature of diabetic retinopathy. Invest Ophthalmol Vis Sci. 2000;41:1971–1980. [PubMed] [Google Scholar]
- 32.Newman EA, Frambach DA, Odette LL. Control of extracellular potassium levels by retinal glial cell K+ siphoning. Science. 1984;225:1174 –1175. doi: 10.1126/science.6474173. [DOI] [PMC free article] [PubMed] [Google Scholar]
- 33.Kofuji P, Biedermann B, Siddharthan V, et al. Kir potassium channel subunit expression in retinal glial cells: implications for spatial potassium buffering. Glia. 2002;39:292–303. doi: 10.1002/glia.10112. [DOI] [PubMed] [Google Scholar]
- 34.Nagelhus EA, Veruki ML, Torp R, et al. Aquaporin-4 water channel protein in the rat retina and optic nerve: polarized expression in Muller cells and fibrous astrocytes. J Neurosci. 1998;18:2506 –2519. doi: 10.1523/JNEUROSCI.18-07-02506.1998. [DOI] [PMC free article] [PubMed] [Google Scholar]
- 35.Brew H, Attwell D. Electrogenic glutamate uptake is a major current carrier in the membrane of axolotl retinal glial cells. Nature. 1987;327:707–709. doi: 10.1038/327707a0. [DOI] [PubMed] [Google Scholar]
- 36.Qian H, Malchow RP, Ripps H. The effects of lowered extracellular sodium on gamma-aminobutyric acid (GABA)-induced currents of Muller (glial) cells of the skate retina. Cell Mol Neurobiol. 1993;13:147–158. doi: 10.1007/BF00735371. [DOI] [PMC free article] [PubMed] [Google Scholar]
- 37.Biedermann B, Bringmann A, Reichenbach A. High-affinity GABA uptake in retinal glial (Muller) cells of the guinea pig: electrophysiological characterization, immunohistochemical localization, and modeling of efficiency. Glia. 2002;39:217–228. doi: 10.1002/glia.10097. [DOI] [PubMed] [Google Scholar]
- 38.Bringmann A, Pannicke T, Grosche J, et al. Muller cells in the healthy and diseased retina. Prog Retin Eye Res. 2006;25:397– 424. doi: 10.1016/j.preteyeres.2006.05.003. [DOI] [PubMed] [Google Scholar]
- 39.Newman EA, Zahs KR. Modulation of neuronal activity by glial cells in the retina. J Neurosci. 1998;18:4022– 4028. doi: 10.1523/JNEUROSCI.18-11-04022.1998. [DOI] [PMC free article] [PubMed] [Google Scholar]
- 40.Newman EA. Glial cell inhibition of neurons by release of ATP. J Neurosci. 2003;23:1659 –1666. doi: 10.1523/JNEUROSCI.23-05-01659.2003. [DOI] [PMC free article] [PubMed] [Google Scholar]


