

Abstract
Click trains were generated with first- and second-order statistics following Kaernbach and Demany [J. Acoust. Soc. Am. 104, 2298–2306 (1998)]. First-order intervals are between successive clicks, while second-order intervals are those between every other click. Click trains were generated with a repeating alternation of fixed and random intervals which produce a pitch at the reciprocal of the duration of the fixed interval. The intervals were then randomly shuffled and compared to the unshuffled, alternating click trains in pitch-strength comparison experiments. In almost all comparisons for the first-order interval stimuli, the shuffled-interval click trains had a stronger pitch strength than the unshuffled-interval click trains. The shuffled-interval click trains only produced stronger pitches for second-order interval stimuli when the click trains were unfiltered. Several experimental conditions and an analysis of runs of regular and random intervals in these click trains suggest that the auditory system is sensitive to runs of regular intervals in a stimulus that contains a mix of regular and random intervals. These results indicate that fine-structure regularity plays a more important role in pitch perception than randomness, and that the long-term autocorrelation function or spectra of these click trains are not good predictors of pitch strength.
I. Introduction
Several recent papers (Kaernbach and Demany, 1998; Kaernbach and Bering, 2001; Pressnitzer et al., 2002, 2004, and Yost et al., 2005) have studied the pitch perception of click trains in which the statistics of the intervals between the clicks have been manipulated in several ways. A major feature of these investigations has been the study of first- and second-order intervals. A first-order interval is the interval between successive clicks, while a second-order interval is the interval between every other click. These studies have shown that the auditory system is not as sensitive to second-order as it is to first-order intervals, and in some cases a second-order-interval click train cannot be discriminated from a click train in which all of the intervals are randomly determined. The major features of the autocorrelation analysis used to account for the pitch and pitch strength of complex stimuli are insensitive to the order of the intervals of a click train. Thus, if the auditory system uses mechanisms like autocorrelation to process these click trains, performance should be the same for first- and second-order click trains. Since the data indicate differences in performance, these results suggest that autocorrelation may not be the appropriate mechanism for modeling the auditory processing of regular-interval stimuli (RIS; see Yost, 1998; and Licklider, 1951, Meddis and O'Mard, 1997; Yost, 1996a and 1996b).
The current paper demonstrates another aspect of the statistics of regular-interval click trains that presents a challenge to using the long-term autocorrelation function or long-term spectrum as a model for auditory processing of RIS click trains. In the previous work on first- and second-order click trains, the click trains contain a repeating series of intervals of fixed and random intervals. For instance, the first-order click train may consist of a fixed interval, k, of duration d, followed by two intervals whose durations are each randomly determined, x. This kxx sequence is repeated back-to-back many times to construct a first-order regular-interval click train. In this paper, these intervals in this base kxx click train were randomly shuffled so that the resulting shuffled click train could have longer runs of k or x intervals than existed in the base click train, where there is a repeating run of one k and two x's. Since all of the intervals are still preserved in the shuffled click train, the major features of the long-term autocorrelation functions and the long-term spectra of the shuffled and unshuffled (base) click train are the same. That is, the temporal lag at which the major peak in the long-term autocorrelation function occurs and its normalized height remains the same for the shuffled and the unshuffled click trains, and the spectral ripples seen in the long-term spectra associated with these stimuli are similar for the shuffled and the unshuffled click trains. However, the perceived pitch strength of the shuffled click train is often stronger than that of the base or unshuffled click train, indicating that these long-term autocorrelation function or spectral features cannot explain the pitch-strength differences. The experiments of this paper explore several aspects of the pitch-strength differences between shuffled and unshuffled regular-interval click trains.
II. Experiment I—Shuffled Versus Unshuffled First-Order Click Trains
A. Methods
1. Stimuli
Click-train RIS sounds are sequences of interclick interval (ICI) values, each value representing the duration between the prior and current click. Random-interval click trains were created using the same method employed by Kaernbach and Demany (1998) by randomly assigning each ICI a duration from a uniform distribution between zero and twice the mean ICI (d ms) with a resolution of 25 μ s. No more than two consecutive ICIs could be larger or smaller than d. This was done by Kaernbach and Demany to prevent the occurrence of long sequences of short- or long-duration ICIs which could result in a timbre cue.
First-order ICI sequences were created from random ICI sequences by replacing every third random ICI with a regular interval equal to d. These ICI sequences have been termed “kxx” by Kaernbach and Demany (1998), where k represents the regular interval of duration d and x represents intervals of random duration. The normalized autocorrelation functions for kxx stimuli have a major peak (AC1) at d, and the height of AC1 is equal to 0.33 for the kxx stimuli. In general the height of AC1 for any such regular-interval stimulus is equal to the number of k intervals divided by the sum of the number of k and x intervals (e.g., for kxxx, the height of AC1 is 0.25). The spectra of such stimuli have spectral peaks spaced at 1/d and the depth of the peak-to-valley ratio of these spectral peaks is proportional to the ratio of the number of the k to the number of the k+x intervals (i.e., to AC1).
Figure 1 provides a schematic example of a random-order interval (xxx…) click train and a first-order interval (kxx…) and a second-order interval (abx…, to be described later in experiment II) click train. Figure 2 shows the summary autocorrelograms of the kxx and abx wideband stimuli generated when d=2 ms (kxx) and 2d=4 ms (abx), and Fig. 3 shows the auditory spectra of these same two stimuli. The summary autocorrelograms were computed according to Meddis and Hewitt (1991) and used by Patterson, Allerhand, and Giguere (1995) and Yost, Patterson, and Sheft (1996). They are generated using a gamma-tone filter bank and the Meddis hair cell to simulate the biomechanical properties of the inner ear and the neural activity in auditory-nerve fibers (tuned channels) and then forming the autocorrelation function for each tuned channel (the autocorrelogram). The summary autocorrelogram is the sum of the autocorrelogram across all tuned channels shown as a function of autocorrelation lag (ms). As for the autocorrelation function itself, the locations of the largest peaks in the summary autocorrelogram are used to account for pitch and the relative heights of these peaks for pitch strength (see Meddis and Hewitt, 1991). The auditory spectra (see Patterson, Allerhand, and Giguere, 1995) were computed by summing simulated neural activity across time for each tuned channel and displaying the summed simulated neural activity for each tuned channel as a function of frequency (i.e., the center frequency of each gamma-tone filter). The auditory spectra reveal the resolved spectral ripple in the low frequencies for the two types of click trains. These figures suggest that both the spectral ripple and the autocorrelations of these stimuli are likely to be preserved within the peripheral auditory system.
FIG. 1.
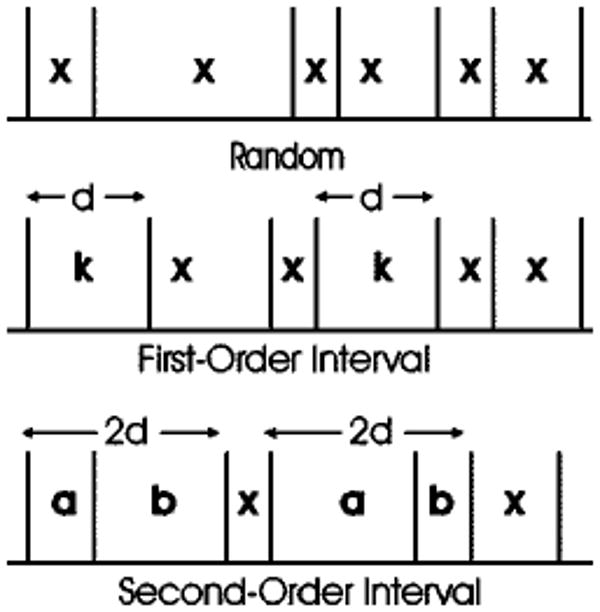
RIS click trains; top: random intervals (x), middle: first-order intervals (kxx), bottom: second-order intervals (abx), d is mean duration.
FIG. 2.
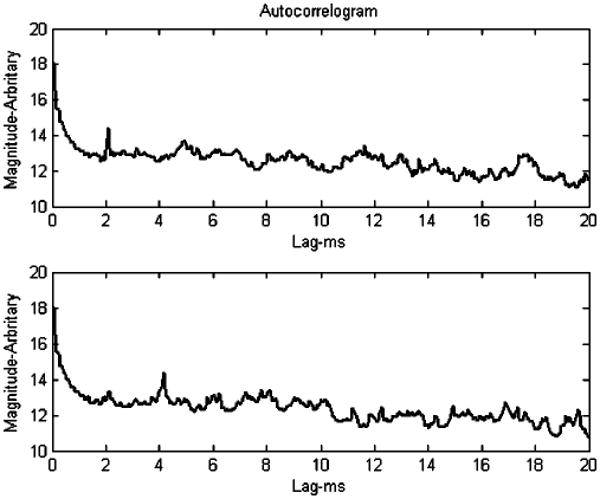
Autocorrelograms for an auditory model are shown for the first-order interval (kxx) stimulus with d=2 ms (top panel) and the second-order interval (abx) stimulus with 2d=4 ms. The peaks at lags of 2 ms (top panel) and 4 ms (bottom panel) indicate the most prominent regularity in these stimuli as might be preserved in the auditory periphery.
FIG. 3.
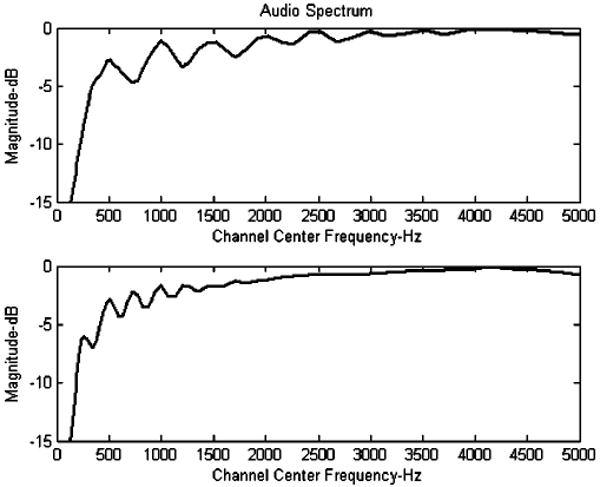
Auditory spectra for an auditory model are shown for the first-order interval (kxx) stimulus with d=2ms (top panel) and the second-order interval (abx) stimulus with 2d=4 ms. The spectral ripple in the low frequencies indicates resolved harmonics as might be preserved in the auditory periphery.
The amplitudes of the clicks were identical and were adjusted to create a click train with a spectrum level1 of 30 dB SPL. Each stimulus was temporally windowed using a 5-ms squared cosine function. The duration of d was 1, 2, 4, or 8 ms, resulting in fundamental frequencies, f0, of 1000, 500, 250, or 125 Hz (f0 is the reciprocal of d), respectively.
Different ordered click-train conditions were run with a different number of random x ICIs per single regular k ICI (kx, kxx, k3x, k4x, k5x). A control condition was also run in which completely random (xxx…) interval stimuli were compared to completely regular (kkk…) interval stimuli. Total stimulus duration for all stimuli was 500 ms.
On each trial after an ordered click train was generated, a randomly shuffled version of this ordered click train was created to make the two stimuli for the pitch-strength discrimination task. A shuffled click train was generated by randomly shuffling the intervals of the ordered click train generated for that trial. That is, rather than having a string of kxxkxxkxxkxx… intervals, these intervals were randomly resampled and something like xkkkxxxxkxxx… may have been generated as the shuffled version. Note that the major features of the spectrum and autocorrelation function of the long-term (computed over the full 500 ms of the stimulus) click trains are the same for the shuffled-click train as for the unshuffled ordered-click.
All stimuli were delivered to listeners via Tucker Davis Technology (TDT) system II D/A converters at 40-kHz sample rate. These wideband stimuli were low-pass filtered with 4-pole filters with 15-kHz cutoff frequencies to eliminate aliasing. Stimuli were delivered diotically over Sennheiser headphones to listeners seated in a double-walled soundproof room.
2. Procedure
Pitch-strength comparisons were measured using a 2AFC task; one of the stimuli was the ordered click train and the other a shuffled version using the same set of ICIs. Listeners were asked to pick the stimuli that had the stronger pitch strength. A 300-ms silent gap was inserted between stimuli. No feedback of any type was provided.
Five conditions were run with different ratios of random x intervals per single regular k interval (kx, kxx, k3x, k4x, k5x). In a control condition a purely regular-interval click train (kkkk…) was compared to a purely random-interval click train (xxxx…) with the same mean click rate. Thus, there were six different conditions at each value of d creating a total of 24 conditions.
A block of trials consisted of all of the six different random-to-regular ratio conditions at a single d value. Twenty trials were run at each ratio condition, resulting in 120 trials per block. Trials were randomly selected without replacement in each block. A block of 120 trials was repeated ten times throughout the course of the experiment, resulting in 100 trials per condition for each listener.
3. Listeners
Four normal-hearing paid listeners participated in experiment I. They were all college undergraduate students between the ages of 19 and 35 who reported normal hearing. In a typical day, each listener ran approximately seven randomly assigned blocks of trials over a 90-min period. The first block of trials from each listener each day was considered practice and was not included in the final results.
B. Results
The overall results of experiment I are shown in Fig. 4 as the percentage of trials the shuffled sequence was judged to have the stronger pitch strength. The results of the control conditions are presented as the percentage of trials the purely random-interval sequence (xxx…) was judged to have a stronger pitch strength than the purely regular-interval sequence (kkk…). The 50% line in Fig. 4 represents equal pitch strength. Only the mean results are presented since the individual results were similar to each other.
FIG. 4.
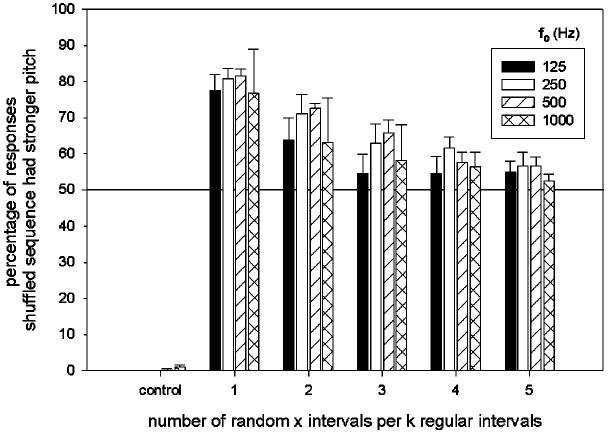
Ordered (unshuffled) vs shuffled click-train RIS pitch strength comparisons for wideband stimuli, first-order intervals, total duration 500 ms. Bars are mean percentage of four listeners; error bars are standard errors.
Figure 4 shows that approximately 80% of the time, shuffled kx stimuli were judged to have a stronger pitch strength than its ordered counterpart. This percentage decreases with increasing number of random intervals. Note that there is also a small fundamental frequency (f0) effect in that there is a small increase in pitch-strength preference for shuffled stimuli with fundamental frequencies 250 and 500 Hz. This tendency is consistent with other RIS pitch experiments (Yost and Hill, 1978) that show a higher pitch saliency in this range of fundamental frequencies (200–666 Hz).
C. Discussion
Given that shuffling ICIs does not change the number of regular intervals in click train RIS, why does its pitch strength increase? The most likely reason is that shuffling creates “clumps” or “runs” of consecutive regular k ICIs. It is these multiple instances of regular ICIs that are the probable cause of an increase in pitch strength. This suggests that pitch strength is based on short-term temporal regularity in a waveform rather than the overall temporal regularity in an entire waveform. However, it is important to point out that shuffling also creates multiple instances of consecutive random ICIs. Thus, pitch strength is more than just the average of a short-term temporal detector. Since shuffled stimuli contain portions of increased and decreased temporal regularity, the average of the short-term temporal regularity is the same as a measure of overall temporal regularity. Thus, the auditory system seems to place increased importance on runs of regular intervals over runs of random intervals. Consider the case of the kx stimuli in which the probability of runs of k ICIs is equal to that of runs of x ICIs in the shuffled click trains, yet shuffled click trains are almost always judged to have a stronger pitch saliency than the unshuffled click trains where the runs of k and x are always one each. The longer runs of random intervals seem to be weighted far less than runs of regular intervals when pitch strength is computed. This asymmetry in the perception of runs of regular intervals vs runs of random intervals is consistent with the notion that listeners are tuned to perceive temporal regularities in sound, rather than the lack of regularity (randomness).
When there is a run of fixed intervals (where d is the duration of each k fixed interval), the autocorrelation function may have a major peak at a lag of d and at integer multiples of d. The normalized height of the peak at d is the greatest and the height of the autocorrelation peaks at lags of the integer multiples of d decrease. For instance, a kkkx repeating stimulus with d=2 ms, will have a major autocorrelation peak at a lag of 2 ms with a peak height of 0.75 (3/4), a peak at a lag of 4 ms (2d) with a peak height of 0.50 (2/4), and a peak at 6 ms (3d) with a peak height of 0.25 (1/4). In general, if there are m consecutive k intervals each of duration d and p consecutive random (x) intervals of random durations, then the autocorrelation function has peaks at lags of nd, where n=1,2,…,m; and the normalized height of the peak at nd is (m−n+1)/(m+p).
Thus, when there are runs of k's in the entire shuffled click trains that are longer than in the unshuffled click trains, it is possible that the correlation associated with the lags at the higher integer multiples of the delay, d, could be the basis for the increased pitch strength of the shuffled click trains. For instance, for a kx base stimulus, many runs of kkx in the shuffled stimulus could produce an autocorrelation function for the entire stimulus with peaks at lags d and 2d (assuming the duration of the k intervals is d). The peak at lag d could have a normalized height of 0.67 and that at lag 2d could have a normalized height of 0.33. It could be that the higher peak at the lag of d and/or the peak at lag 2d “reinforces” that at d to produce the greater pitch strength for the shuffled click train.
There are several reasons why these correlations at the longer lags probably do not account for the increased pitch strength of the shuffled click trains if the entire waveform is considered. First, in the work on other RIS conditions, especially iterated rippled noise, there is little evidence that peaks at integer multiples of d influence either the pitch or pitch strength of these RIS sounds (see Yost, Patterson, and Sheft, 1996; Yost, 1996a, b). That is, these studies indicate that only the first peak at d influences pitch and pitch strength. Second, recall that if one computes the average autocorrelation function over the entire stimulus, the autocorrelation peaks are the same for the shuffled and the unshuffled stimulus. Thus, any additional autocorrelation peaks at higher lags would have to result from stimulus presentations in which there is a strong deviation from the average. If there were a large number of trials in which long runs of regular intervals (k) occurred for the shuffled conditions, then these trials might be the ones influencing the increased pitch strength as a result of the peaks at lag d and its higher integer multiples. Since approximately 80% of the trials (see Fig. 4) appear to produce a stronger pitch for the shuffled stimulus, one would expect that the proportion of trials with runs of k intervals sufficiently long to produce autocorrelation peaks at long lags would also occur in the range of 80%. Table (IV) in the Appendix indicates the mean number of times (and the standard deviations) out of 240 intervals that one might expect long runs of k's to occur. These numbers are too few to produce very many trials in which the autocorrelation functions have noticeable peaks at long lags. In a separate simulation, in a run of 1000 independent generations of a 500-ms shuffled version of a kx stimulus, only 198 of them (19.8%) produced a measurable autocorrelation peak at 2d, 7.8% produced a measurable autocorrelation peak at 3d, and there were no measurable peaks at 4d that were above the noise floor (note that half of the intervals are always k's; thus, the peak at lag d was measurable on all trials). Thus, it is unlikely that autocorrelation functions associated with the entire waveform could account for the shuffled/unshuffled pitch-strength differences. Therefore, it is likely that some other aspect of the consecutive runs of regular intervals (i.e., a short-term statistic) is the basis for the increased pitch strength associated with the shuffled click trains.
These results have been discussed in terms of the autocorrelation function of these stimuli largely because it has been successful in accounting for the pitch strength of these types of complex stimuli. However, since these click trains are wideband they have several resolved harmonics as indicated in Fig. 3. The height of AC1 is proportional to the spectral peak-to-valley ratio in the spectral ripple of these click trains. Thus, some aspect of the peak-to-valley ratio could also be used to account for the pitch-strength judgments, and AC1 could be seen as one way to quantify the peak-to-valley ratio, since no other spectral measure of pitch strength has been proposed (note that the autocorrelation function is the Fourier transform of the power spectrum; see Wightman, 1973, for a discussion of this fact as it pertains to complex pitch processing). Runs of regular intervals would produce momentary spectral ripples in the running spectra of these click trains (whereas runs of random intervals would produce momentary largely flat, but randomly varying, spectral structure). Thus, short-term resolved spectral ripples could be a basis for the increased pitch strength for the shuffled wideband click trains.
It should also be pointed out that the strength of the pitch decreases as the number of random intervals increase (e.g., kx has a much stronger pitch than k4x). The k5x stimulus contained the largest number of random (x) intervals which yielded a detectable pitch. Thus, part of the decline in the increased strength of the pitch of the shuffled click trains over the unshuffled click trains with increasing number of x's is probably due to an overall decrease in pitch strength.
III. Experiment II—Effects of Interval Order and High-Pass Filtering
The stimuli in experiment I were broadband and involved only first-order intervals. Thus, the results could be based on spectral processing of the resolved spectral peaks of the broadband first-order click train rather than temporal processing that might be based on mechanisms like autocorrelation. High-pass filtering the click trains so that the spectral peaks (spaced at 1/d) are not resolved allowed us to more directly test temporal processing of these click trains. We were also interested to know if the shuffled–unshuffled pitch-strength difference that occurred for the first-order interval click trains of experiment I would occur for second-order interval click trains.
A. Methods
1. Stimuli
The first-order interval click train stimuli were generated the same way as in experiment I. Second-orderICI sequences were created from the random ICI sequences by replacing the first two of every three random ICIs with ICIs whose sum was 2d. The duration of the first of the three intervals, denoted a, was randomly drawn from a uniform distribution between zero and 2d. The duration of the second interval, denoted b, was set equal to 2d-a. Thus, the sequences contained second-order regular intervals of duration a+b=2d. These sequences have been termed “abx” by Kaernbach and Demany. RIS sounds created from abx ICI sequences also have a mean AC1 peak height of 0.33 at delay 2d. As mentioned in experiment I, the AC1 peak height corresponds to the proportion of regular intervals to the total number of intervals in the stimuli. The spectra of abx stimuli have spectral peaks at 1/2d, where the spectral peak-to-valley ratio is proportional to the ratio of the number ab to the number of ab+x intervals (refer to Figs. 1–3).
Shuffled click trains were generated in experiment II in the same way they were in experiment I. That is, once a first- or second-order interval click train was generated for a particular trial the intervals were shuffled by randomly resampling the intervals of the base stimulus (k for the first-order interval stimuli and an “ab” pair for the second-order interval stimuli). That is, the pairing of any “a” and “b” interval that was generated in each instance for the base, unshuffled stimuli remained paired after the shuffling (e.g., if an unshufflled a interval of 3 ms was paired with a b interval of 1 ms, this same 3-ms−1-ms ab pairing remained in the shuffled click train). The shuffled and unshuffled (base) click trains were then compared using the same pitch-strength discrimination task used in experiment I. The same stimulus levels, durations, and values of d used in experiment I were used in experiment II.
In the filtered conditions, the high-pass filter cutoff frequencies were 8 and 16 times the fundamental frequency f0 (8f0 and 16f0), based on the type of analysis shown in Fig. 3. During the high-pass filter conditions, a low-pass filtered Gaussian noise was added to the signal to mask lower frequency distortion components so that they could not be used as a discrimination cue. The low-pass filter cutoff frequency was one half of an octave below the high-pass cutoff frequency of the click trains. The spectrum level1 of the masking noise was 20 dB, 10 dB below the spectrum level of the click train stimuli. The relationship between order, fundamental frequency f0, mean interval duration d, and high-pass cutoff frequency is summarized in Table I. Note that since the maximum cutoff frequency of the TDT PF1 module is 15 kHz, the cutoff frequency for the 1000-Hz fundamental frequency, 16f0 high-pass filtered condition was actually 15 kHz instead of 16 kHz.
TABLE I.
Summary of test conditions in Experiment II.
| order | x/k ratios | Fundamental frequency f0 (Hz) | mean interval duration d (ms) | high-pass cutoff frequency (kHz) | ||
|---|---|---|---|---|---|---|
| Wideband | 8f0 | 16f0 | ||||
| 1 | 0-to-5 | 125 | 8 | … | 1 | 2 |
| 1 | 0-to-5 | 250 | 4 | … | 2 | 4 |
| 1 | 0-to-5 | 500 | 2 | … | 4 | 8 |
| 1 | 0-to-5 | 1000 | 1 | … | 8 | 15 |
| 2 | 0-to-5 | 125 | 4 | … | 1 | 2 |
| 2 | 0-to-5 | 250 | 2 | … | 2 | 4 |
| 2 | 0-to-5 | 500 | 1 | … | 4 | 8 |
| 2 | 0-to-5 | 1000 | 0.5 | … | 8 | 15 |
Also, as in experiment I a control set of stimuli was used in which for the first-order interval conditions, a completely fixed-interval sequence (kkk…) was compared to a completely random-interval sequence (xxx…). For the second-order interval conditions, a fixed sequence of second-order intervals (ababab…) was compared to the completely random-interval sequence (xxx…). Again, each “a” interval (a+b=d) in each “ab” pairing was chosen at random.
2. Procedure
The experimental procedure was similar to the procedure in experiment I. The primary difference was the inclusion of high-pass-filtered and second-order regular-interval conditions. One hundred and forty-four different conditions were tested. A block of trials was run at a single fundamental frequency (f0=125, 250, 500, or 1000 Hz) and a single order (first or second). Each block of trials contained three subblocks, each consisting of the three high-pass-filter conditions (wideband, 8f0, 16f0). The order of the subblocks always began with wideband conditions, then 8f0, and finally 16f0 trials. This was done to provide listeners a clear impression of the pitch in the initial wideband stimulus trials in an attempt to maximize performance in the high-pass-filter conditions. Trials within each subblock were randomly drawn without replacement from ten replicates of all of the six different random-to-regular ratio conditions. A complete block of 180 trials was repeated five times throughout the course of the experiment, resulting in 50 trials per condition for each listener.
3. Listeners
The same four listeners who participated in experiment I also participated in experiment II. The first block of trials from each listener each day was considered practice and was not included in the final results.
B. Results
The overall results of first- and second-order conditions in experiment II are shown in Figs. 5 and 6, respectively. Each of the panels presents the results at a single fundamental frequency and order. The results are presented as the percentage of trials the shuffled sequence was judged to have a stronger pitch strength than the ordered (unshuffled) stimuli. The results of the control conditions are presented as the percentage of trials the random sequences were judged to have the greater pitch strength. The 50% line represents equal pitch strength. Only the overall results are presented since the individual results were similar to each other.
FIG. 5.
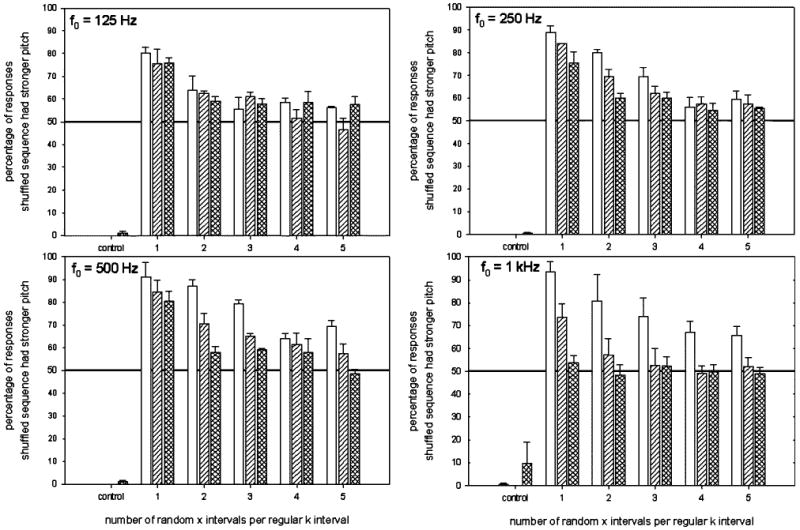
Ordered (unshuffled) vs shuffled click-train RIS pitch strength comparisons first-order kxx-type stimuli for three filter conditions. Bars are mean percentage of four listeners; error bars are standard errors. The left open bars represent the wideband conditions, the middle single-hashed bars represent the high-pass filtered condition at 8f0, and the right double-hashed bars represent the high-pass filtered condition at 16f0.
FIG. 6.
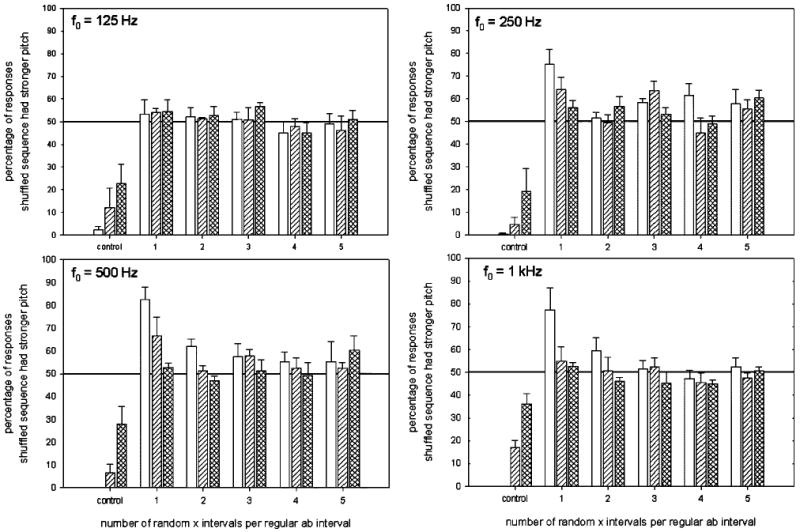
Ordered (unshuffled) vs shuffled click-train RIS pitch strength comparisons second-order abx-type stimuli for three filter conditions. Bars are mean percentage of four listeners; error bars are standard errors. The left open bars represent the wideband conditions, the middle single-hashed bars represent the high-pass filtered condition at 8f0, and the right double-hashed bars represent the high-pass filtered condition at 16f0.
1. First-order interval results
Overall, the wideband conditions in experiment II reveal the same trends exhibited in experiment I (see Fig. 4); a decline in preference for shuffled stimuli as the random to regular ratio increases, and largest preferences for the 250- and 500-Hz fundamental frequencies (f0). However, in nearly all of the conditions there is an increase in choosing the shuffled stimuli as having the stronger pitch strength in experiment II as compared to experiment I. The amount of increase is as much as 17%. The average increase across all conditions is 8%. This increase from experiment I could be due to an overall effect of experience listening to these stimuli, since the same listeners were used in each experiment. Note that most of the increase occurred in the higher fundamental frequency conditions; there was relatively little change in the f0=125 Hz conditions. Also recall that no feedback was provided in either experiment I or II, so it is unlikely that the listeners “learned” anything specific based on feedbacked training.
Considering first-order stimuli, Fig. 5 shows that increasing the high-pass filter cutoff frequency decreased the preference for shuffled stimuli over unshuffled at a given fundamental frequency (f0) and random-to-regular interval ratio. In addition, the change in preference with high-pass cutoff frequency increased with fundamental frequency (f0). This suggests that frequency effects are a function of the actual cutoff frequency rather than its relationship to the fundamental frequency. This is expected at the most extreme cutoff frequency (15 kHz) in the f0=1-kHz condition since not much of the stimuli remains at this high cutoff frequency. The results confirm this since all of the 15-kHz high-pass filter conditions show no preference between shuffled and ordered stimuli. Note the nonzero percentage (10%) in the control condition (kkk… vs xxx…) at the 15-kHz high-pass filter condition, indicating listeners are beginning to experience difficulty in differentiating completely random and completely regular ICIs at this high cutoff frequency.
2. Second-order interval results
The second-order results are shown in Fig. 6. These results are striking in comparison to the first-order results. Note that there is relatively little difference in pitch strength between the shuffled and unshuffled stimuli in nearly all of the second-order conditions. None of the f0=125-Hz conditions show a preference in pitch strength. In addition, none of the conditions that were either high-pass filtered or have a random-to-regular interval ratio greater than 1.0 shows a strong preference in pitch strength. The only conditions that show a preference for shuffled stimuli greater than 70% of the time are the wideband, abx second-order conditions with fundamental frequencies (f0) of 250, 500, and 1000 Hz.
The control conditions give an indication of the difficulty in distinguishing second-order pitch-strength differences. Recall that, in the control conditions, maximal periodic second-order click trains were compared with completely random click trains. These conditions were trivially easy in the first-order conditions; although it was still possible with second-order regular intervals, the increase from 0% in the high-pass filtered conditions indicates some confusion in distinguishing the two stimuli in terms of pitch strength.
C. Discussion
In terms of pitch strength shuffled second-order regular intervals are harder to distinguish than shuffled first-order regular intervals. It was suggested earlier that the reason shuffled first-order regular intervals have a stronger pitch strength is that shuffling increases the likelihood of multiple instances of consecutive regular intervals. The results of this experiment suggest that consecutive second-order regular intervals do not have the same ability to increase pitch strength as consecutive first-order regular intervals.
In terms of the total number of regular intervals in a complete ICI sequence, first-order kxx stimuli are equivalent to second-order abx stimuli with 33% of the total intervals being regular intervals. This relationship between order and number of random intervals per regular interval is summarized in Table II. Note that the percentage of regular intervals also corresponds to the AC1 peak height of the stimuli. Despite these statistics, shuffling the intervals of first-order interval stimuli can increase pitch strength for most conditions, whereas shuffling the intervals of second-order interval stimuli only increases pitch strength for some of the wideband conditions.
TABLE II.
The relationship between first- and second-order stimuli in experiment 2 in terms of the percentage of regular intervals in an ICI sequence.
| First-order condition | Equivalent second-order condition | Percentage of regular intervals (%), (AC1*100%) |
|---|---|---|
| kx | None | 50 |
| kxx | abx | 33 |
| kxxx | abxx | 25 |
| kxxxx | abxxx | 20 |
| kxxxxx | abxxxx | 17 |
| None | abxxxxx | 14 |
The results of the second-order high-pass filter conditions indicate the importance of resolved harmonics in creating a salient pitch strength when only second-order regular intervals are present. This result is in contrast to first-order results in Fig. 5, which shows that shuffled first-order intervals do not require resolved harmonics to produce a preference for shuffled stimuli having the stronger pitch strength. The results of the control conditions further substantiate the importance of resolved harmonics in generating pitch strength with second-order intervals. In these conditions, listeners begin to have difficulty distinguishing even extreme differences in the temporal regularity of second-order stimuli when the resolved harmonics are removed, whereas they had much less difficulty in the corresponding first-order conditions.
However, note that the pitch-strength preference for the shuffled second-order-interval stimuli even in the wideband case is less than the pitch-strength preference for the shuffled stimulus in the first-order-interval conditions. If the pitch-strength judgments were based entirely on the spectra of these stimuli, then one would expect that the pitch-strength preferences for the shuffled-over the unshuffled stimuli would be the same for both first- and second-order wideband click trains, since the main spectral features are also the same for the first- and second-order click trains (e.g., the location of the spectral peaks and their overall spectral peak to valley ratios; see Fig. 3). Thus, while having resolved spectral structure appears to be important for processing second-order-interval stimuli in these experiments, the temporal statistics of how the clicks are presented also influences the perception of pitch strength.
The need for resolved harmonics in second-order stimuli for generating a large pitch strength mirrors the regular- vs random-interval discrimination performance differences between first- and second-order stimuli in experiment II. Recall in experiment II that there was a decrease in second-order-interval discrimination performance as compared to first-order performance, especially when the resolved harmonics were removed. This suggests that regular-interval vs random-interval discrimination performance is largely based on the pitch strength generated by regular intervals, and that second-order click train RIS generate a pitch only if they contain spectral energy in resolved channels.
These results are also consistent with those from Yost et al. (2005) in which the ability of listeners to discriminate second-order interval click trains from random-order interval click trains was lower than their ability to discriminate first-order-interval click trains from their random-order interval comparisons. That is, the Yost et al. study showed that, for all conditions except an 8-kHz high-pass condition, second-order intervals could be discriminated from their random-order interval noise foils. However, performance was always less than for the discrimination of first-order intervals from their random-order-interval noise foils. Those data indicated that the pitch strength of second-order-interval stimuli is less than that for first-order-interval stimuli, which is consistent with the results of the present experiment.
IV. Experiment III—Ordered Click-Train Pitch-Strength Comparisons
Further pitch-strength comparison experiments were conducted to investigate the importance of consecutive regular intervals. In these experiments the exact number of consecutive regular intervals was controlled by only using first-order-interval click-train RIS. The purpose of these experiments was to study the number of consecutive regular intervals as predictors of pitch strength in click-train RIS. This was accomplished by creating stimuli with lower autocorrelation peak height (AC1), but that also have more consecutive regular intervals than the other compared stimuli. Recall that the AC1 peak height is equal to the number of regular k intervals divided by the total number of regular k and random x intervals. In the first set of trials, the pitch strength of kx stimuli with an AC1 peak height of 0.5 was compared to stimuli with a lower AC1 peak height (0.33) but consisted of multiple consecutive regular k intervals (e.g., 2k4x). In a second set of trials, 4k8x stimuli with an AC1 peak height (0.33) were compared to stimuli with higher AC1 peak height (0.5) but fewer multiple consecutive regular k intervals (e.g., kx).
Since the click trains were not high-pass filtered in these experiments, pitch strength could be based on the resolved components in the spectra of these sounds. However, a measure of the spectrum of the complex-pitch stimuli has not been developed that relates to pitch strength in the same way that the AC1 is related to pitch strength (see Yost, 1996a, and Shofner and Selas, 2002). As AC1 increases so does the peak-to-valley ratio of the spectral ripple of these sounds. Thus, changes in AC1 can also serve to indicate the relative changes in the peak-to-valley ratio of the ripples in the spectra of these click trains. Thus, our attempt in these experiments was to determine how AC1, either as an indicator of the percent of regular intervals or as an indicator of the spectral peak-to-valley ratio in these click trains, or both, interacted with runs of regular intervals in determining pitch-strength judgments.
A. Methods
1. Stimuli
The stimuli were generated in a manner similar to that in experiment I. The primary difference was that only ordered stimuli were compared to each other, i.e., none of the stimuli was shuffled. Different conditions were run comparing ordered click-train RIS sounds with different numbers of random x and regular k ICIs. The total duration of each stimulus was 500 ms. Stimuli were not high-pass filtered. All other stimulus conditions were identical to those used in experiment I.
2. Procedure
Pitch-strength comparisons were measured using a 2AFC task; one stimulus was the standard and the other an ordered stimulus with a different AC1 peak height made up from a different proportion of regular and random intervals. Listeners were asked to pick the stimuli that had the stronger pitch strength. All other conditions were the same as in experiments I and II, including the fact that no feedback was provided.
Regular ICIs with fundamental frequencies (f0) of 125, 250, 500, and 1000 Hz were used. In the first set of trials, the standard stimulus was ordered kx click trains (AC1=0.5) and was paired with ordered 2k4x, 3k6x, 4k8x, or 5k10x click trains (AC1=0.33). In the second set of trials, the standard stimulus was ordered 4k8x click trains (AC1=0.33) and was paired with ordered kx, 2k2x, 3k3x, or 4k4x click trains (AC1=0.5).
A block of trials consisted of the four different pairings at a single fundamental frequency. Ten trials were run at each condition, resulting in 40 trials per block. Listeners ran four blocks of trials without a break. Trials were randomly selected without replacement in each block. A block of 40 trials was repeated five times throughout the experiment, resulting in 50 trials per condition for each listener. Three of the four listeners who participated in experiment II also participated in this experiment.
B. Results and discussion
The overall results of the first condition of experiment III are shown in Fig. 7. The results are presented as the percentage of trials the target stimuli (AC1=0.33) were judged to have a stronger pitch strength than the standard kx stimuli (AC1=0.5). The 50% line in Fig. 7 represents equal pitch strength. Figure 7 shows that, when f0 is equal to 1000 and 500 Hz, only two consecutive regular intervals were required to make the pitch strength greater than the standard stimuli which had a higher AC1 peak height. At f0 equal to 250 and 125 Hz, four consecutive regular intervals were required for the mean pitch strength to be stronger than the standard stimuli.
FIG. 7.
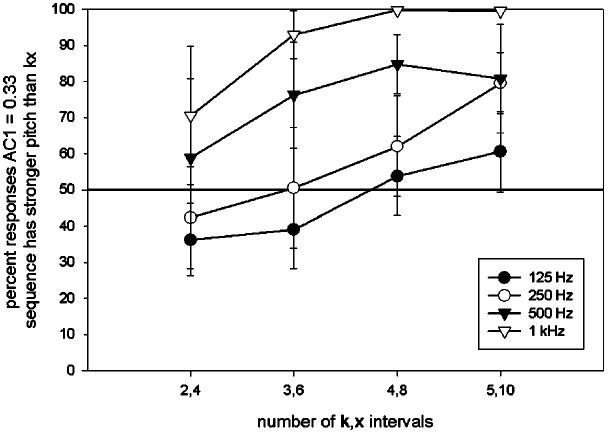
Ordered (unshuffled) click-train RIS pitch strength comparisons. kx vs 2k4x, 3k6x, 4k8x, 5k10x wideband stimuli. Bars are mean percentage of four listeners; error bars are standard errors.
The overall results of the second set of conditions are shown in Fig. 8. The results are presented as the percentage of trials the target stimuli (AC1=0.5) were judged to have a stronger pitch strength than the standard 4k8x stimuli (AC1=0.33). Note that the kx condition in the second set of trials is the same as the 4k8x condition in the first set of trials. The results, although not identical, show the same trend. Figure 8 shows that three consecutive regular intervals can have a larger pitch strength than four consecutive regular intervals if the proportion of regular intervals is 0.5 as compared to 0.33. The change in pitch strength is most striking for the 500- and 1000-Hz fundamental frequency conditions which show an abrupt change in preference from the 2k2x to the 3k3x conditions.
FIG. 8.
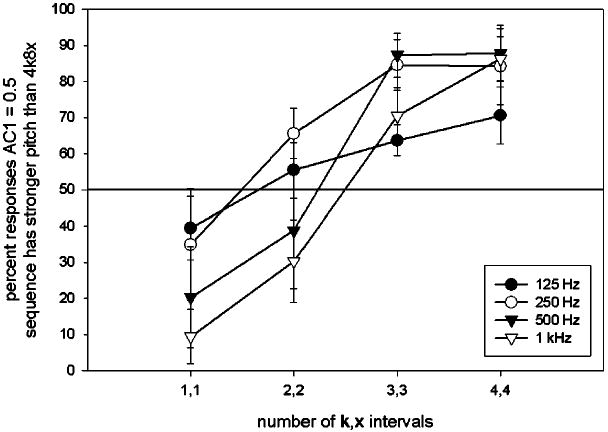
Ordered (unshuffled) click-train RIS pitch strength comparisons. 4k8x vs kx, 2k2x, 3k3x, 4k4x, wideband stimuli. Bars are mean percentage of four listeners; error bars are standard errors.
However, note in Fig. 8 that the 4,4 (4k4x) condition has the same number of k's as the comparison stimulus of (4k8x), yet the 4k4x click train is judged to have the stronger pitch strength. If the number of consecutive k's were the only variable affecting pitch strength, these two stimuli should have been judged equal in pitch strength. In this case, it appears as if the fact that the 4k4x click train has a higher AC1 peak (0.5 as compared to 0.33) led listeners to judge it stronger in pitch. This suggests that pitch strength is both a function of the number of consecutive k's and the ratio of the number k's to the number of k's and x's (i.e., the height of AC1, or spectral peak-to-valley ratio).
In the case of these unshuffled click trains of experiment III, the autocorrelation functions will have peaks at lags at integer multiples of d (see the discussion in experiment I concerning multiple peaks in these types of autocorrelation functions). Thus, click trains with longer runs of k's will have more peaks in the autocorrelation function than click trains with shorter runs. Thus, it is possible that one of the reasons that the pitch of stimuli with longer runs of k's is judged stronger is due to the influence of the autocorrelation function peaks at long lags on the perception of pitch strength. However, as was pointed out in experiment I, other studies have failed to show that the peaks at lags that are integer multiples of d have any influence on either the pitch or the pitch strength of RIS sounds.
The results of the ordered click-train RIS pitch-strength comparisons confirm the importance of consecutive regular intervals in determining the pitch strength of these stimuli. The data also show that the pitch strength of these stimuli is a function of the number of consecutive regular intervals and AC1 peak height (either as an indicator of temporal regularity or of spectral peak-to-valley ratio) of the overall stimulus.
V. Experiment IV—Pitch Strength Ratings for Shuffled Click Trains
An additional set of trials was run comparing the pitch strength between shuffled ICI click-train RIS with different ratios of random-to-regular intervals. Experiment IV was conducted to allow us to estimate the number of consecutive regular intervals that might be sufficient to increase the pitch strength of the shuffled click train over that of the unshuffled click train. Some of the results from experiment III suggest that 2–4 consecutive regular intervals might be sufficient to increase the pitch strength of a first-order RIS click train.
A. Method
The experimental approach and listeners were identical to experiment I. Regular ICIs with mean interval durations d equal to 8, 4, 2, and 1 ms were used. The stimulus set was all x's, k4x, k3x, k2x, kx, and all k's. Stimuli were paired with each other, making for 15 different pairings at each value of d. A block of randomly chosen trials (without replacement) consisted of a set of 10 replicates of all of 15 different pairings at a single d value. These blocks of 150 trials were repeated five times, resulting in 50 trials per pairing for each listener. The three listeners who participated in the experiment III also participated in this experiment.
B. Results
The overall results are tabulated in the preference matrices in Table III. The number in each cell represents the number of times the pitch strength of the row stimuli was judged to be stronger than the pitch strength of the column stimuli.
TABLE III.
Preference table for shuffled stimuli pairings. Each cell is the total number of preferences (out of 200) for the row stimuli over the column stimuli. The last column is the sum of each row representing the total number of preferences (out of 1000) for that stimuli throughout the experiment.
| Stimuli | Total preferences out of 1000 | |||||||
|---|---|---|---|---|---|---|---|---|
| d | 8 ms | All k's | kx | kxx | k3x | k4x | All x's | |
| All k's | 198 | 196 | 200 | 198 | 194 | 986 | ||
| kx | 2 | 157 | 170 | 188 | 188 | 705 | ||
| kxx | 4 | 43 | 127 | 146 | 154 | 474 | ||
| k3x | 0 | 30 | 73 | 106 | 154 | 363 | ||
| k4x | 2 | 12 | 54 | 94 | 124 | 286 | ||
| All x's | 6 | 12 | 46 | 46 | 76 | 186 | ||
| d | 4 ms | Allk's | kx | kxx | k3x | k4x | Allx's | |
| All k's | 194 | 198 | 200 | 198 | 200 | 990 | ||
| kx | 6 | 155 | 174 | 179 | 190 | 704 | ||
| kxx | 2 | 45 | 135 | 163 | 174 | 519 | ||
| k3x | 0 | 26 | 65 | 124 | 168 | 383 | ||
| k4x | 2 | 21 | 37 | 76 | 148 | 284 | ||
| All x's | 0 | 10 | 26 | 32 | 52 | 120 | ||
| d | 2 ms | Allk's | kx | kxx | k3x | k4x | Allx's | |
| All k's | 184 | 198 | 200 | 200 | 200 | 982 | ||
| kx | 16 | 174 | 182 | 188 | 186 | 746 | ||
| kxx | 2 | 26 | 150 | 183 | 188 | 549 | ||
| k3x | 0 | 18 | 50 | 137 | 176 | 381 | ||
| k4x | 0 | 12 | 17 | 63 | 162 | 254 | ||
| All x's | 0 | 14 | 12 | 24 | 38 | 88 | ||
| d | 1 ms | Allk's | kx | kxx | k3x | k4x | Allx's | |
| All k's | 186 | 200 | 200 | 198 | 200 | 984 | ||
| kx | 14 | 176 | 190 | 196 | 200 | 776 | ||
| kxx | 0 | 24 | 162 | 187 | 194 | 567 | ||
| k3x | 0 | 10 | 38 | 122 | 172 | 342 | ||
| k4x | 2 | 4 | 13 | 78 | 166 | 263 | ||
| All x's | 0 | 0 | 6 | 28 | 34 | 68 | ||
1. Pitch-strength ratings using Bradley–Terry rating method
The data in Table III were used to construct relative pitch strength ratings using the Bradley–Terry rating method for paired comparisons (see Bradley, 1984; David, 1988). Separate pitch-strength ratings were created at each value of d. The Bradley–Terry rating method is an iterative procedure that converts a matrix of paired-comparison preference totals to a relative rating for each stimuli on a scale between zero and 1. For the data in Table III, the ratings converged to four decimal accuracy in 500 iterations. The obtained pitch strength ratings are illustrated in Fig. 9.
FIG. 9.
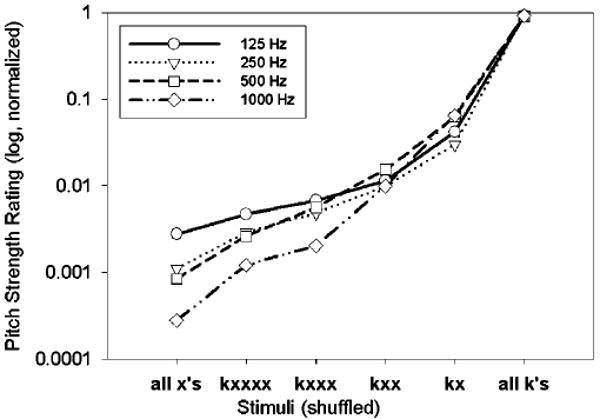
Pitch strength ratings of shuffled click-train RIS based on Bradley–Terry model, average of four listeners.
As expected, Fig. 9 shows that the pitch-strength estimates based on the Bradley–Terry procedure for the control conditions (all x's and all k's) are near zero and 1, respectively. Note that the relative pitch strength for all of the noncontrol conditions is less than 0.1. This suggests that these stimuli were relatively weak in pitch strength and that they would need more regular intervals than random intervals (e.g., 4k1x) to have a pitch strength rating greater than 0.5. It is expected that if such stimuli were included that the pitch strength lines would resemble the familiar “S-shaped” curves of paired-comparison psychometric functions. The current stimulus set seems to only include conditions representing the bottom portion of the “S.”
2. Statistical analysis of consecutive regular intervals in shuffled ICI sequences
The previous experiments using shuffled ICI sequence have shown that
A shuffled ICI sequence can exhibit a higher pitch strength as compared to its unshuffled counterpart; and
The pitch strength of shuffled ICI sequences increases with increasing proportion of regular intervals.
These results suggest that the pitch strength in these stimuli is largely determined by multiple occurrences of runs of consecutive regular intervals. The question arises as to what size(s) of runs determine(s) pitch strength. One way to determine the importance of regular interval run size on pitch strength is to analyze the expected number of runs of different sizes in shuffled ICI sequences and to compare these statistics to the pitch strength ratings determined above in experiment IV. Both empirical and analytical solutions for the expected numbers of runs of a given size were derived. The details of these statistical analyses are given in the Appendix.
The asymptotic solution for large numbers of ICIs given in Eq. (A2) was used to compare the run statistics to the pitch-strength ratings illustrated in Fig. 9. These data for the noncontrol conditions are replotted in Fig. 10 along with curves proportional to the expected number of consecutive runs of size 1, 2, 3, 4, and 5. Figure 10 shows that only the runs of size 2, 3, and 4 match the curvature of the pitch-strength ratings, as appears consistent with some of the results from experiment III.
FIG. 10.
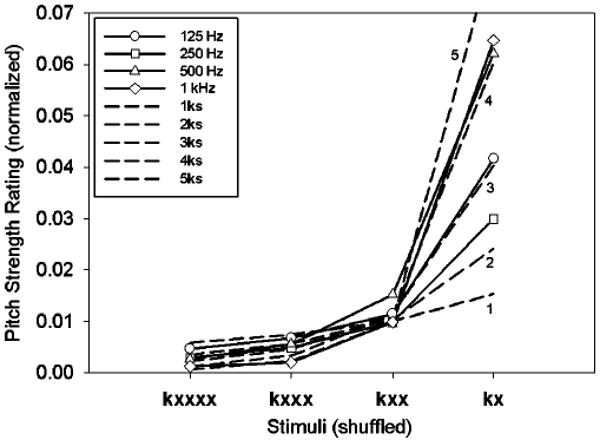
Pitch strength ratings from Fig. 9 and curves based on statistics of the expected number of consecutive regular intervals of different sizes.
Another way to appreciate the importance of run size is to determine at what size the expected number of large runs in ICI sequences is less than 1. For example, consider the d=2-ms regular-interval condition that contains 240 total ICIs. Using Eq. (A2), it can be shown that the expected number of runs of size 8 is less than 1 for shuffled kx stimuli. The same is true for runs of size 6, 5, and 4 for kxx, k3x, and k4x stimuli, respectively. One would not expect pitch to be based on events that occur less than once per trial.2
One must be careful not to make too strong predictions when comparing run statistics and pitch-strength rating data. For example, Fig. 9 suggests that the pitch strength of d=1- and 2-ms shuffled click trains are based on four consecutive intervals and the d=8-ms data are based on three consecutive intervals. However, the auditory system may not rely on only a single run size. It must also be remembered that ordered click-train RIS sounds contain no consecutive regular intervals and yet still have pitches. Also, recall that some of the results of experiment III suggested that consecutive runs of two or three regular intervals may be sufficient to increase the pitch strength of first-order interval click trains. In summary, comparing regular-interval run statistics to shuffled ICI sequences and their corresponding pitch-strength ratings suggests that runs of sizes of only two or three consecutive regular intervals may be all that is required in some conditions for shuffled ICI sequences to impart a stronger pitch strength than ordered ICI sequences. However, additional research will be necessary to obtain a more accurate estimate of the minimum run of regular intervals that influence pitch strength.
VI. Conclusions
In almost all of the conditions considered in this paper the results depended on d (or equivalently, f0). It is important to point out that the timbre of these sounds changes significantly as a function of d. When d is long (e.g., 8 ms), the average duration between clicks is long, and the click train has a “rattling timbre” as discussed by Kaernbach and Demany (1998), and when the duration is near its longest possible value (∼16 ms), an “interruption” can be perceived (although this occurs very infrequently). At short durations (e.g., d=1 ms), the timbre is much more like that of a continuous noise. As pointed out previously, the pitch strength of RIS sounds (e.g., the pitch strength of iterated rippled noise, Yost and Hill, 1978) also changes with d, such that most studies indicate that the pitch strength at d's of 8 and 1 ms (f0's of 125 and 1000 Hz) is lower than at 2 and 4 ms, where the pitch strength has been measured to be about the same. The pitch strength of these click trains must be made in comparison to the overall timbre of the sounds in that there are two percepts associated with these RIS sounds; the base timbre and the pitch that “arises” from the base timbre (see Patterson et al., 1996). There are times in which the weakest pitch strength measured seems to be associated with delays of 1 and 8 ms (e.g., Fig. 4); while in some cases (Figs. 7 and 8), the pitch strength at d=1 ms seems to be the strongest. In general, the data for d=2 and 4 ms appear to be similar. We do not have a clear understanding of why the pitch strength changes as it does with d across the conditions of this study. We do believe that the normally low-pitch strength associated with a delay of 8 ms coupled with the rattling nature of its timbre conspire to lower its pitch strength in almost all cases.
Shuffled first-order click trains have runs of regular intervals and as a consequence they are perceived as having higher pitch strength than unshuffled first-order click trains with shorter runs of regular intervals. These results also appear when the stimuli are high-pass filtered so that the spectral peaks associated with these stimuli cannot be resolved, though the pitch-strength differences between shuffled and unshuffled click train becomes smaller as the cutoff frequency of the filters increases. Shuffled second-order click trains are judged to have higher pitch strength than the unshuffled second-order click train only in the broadband conditions when the spectral peaks are resolvable.
Current autocorrelation models based on the long-term autocorrelation functions cannot account for the data of this study as explained in experiment I, nor could spectral models which are based on the long-term spectrum. Wiegrebe and colleagues (Wiegrebe, Hirsch, and Patterson, 1999; Wiegrebe et al., 1998) applied a short-term autocorrelation model to account for the pitch strength of an RIS sound generated by repeating short segments of frozen noise samples. The pitch strength was a nonlinear transform of the height of AC1 as suggested by Yost (1996a) and Shofner and Selas (2002). A similar short-term autocorrelation function analysis in which pitch strength is nonlinearly related to the height of AC1 can qualitatively account for the wideband, first-order-interval click-train pitch-strength discrimination data of experiment I and, to some extent, the high-pass filtered conditions seen in experiment II. However, this model would predict the same results for the second-order-interval pitch-strength discriminations (experiment II) as it would for the first-order intervals. Since the results of experiment II show that this is not the case, this short-term autocorrelation analysis does not appear as a model that could be used to account for some of the key data described in this paper. It appears as if the type of model (either spectral or temporal) that might account for the data of these experiments is one based on a short-term statistic that is most sensitive to first-order intervals in a waveform.
These data also conflict in some ways with studies that have shown that complex pitch processing is sluggish in that it appears to take perhaps hundreds of milliseconds for the pitch strength of complex sounds to reach maximal saliency (Yost, 1980; Buunen, 1980; Wiegrebe, 2001). The results of the current paper and that of Wiegrebe et al. (1998) indicate that pitch strength can be influenced by short-duration changes in the regularity of the sound. These results may not be contradictory in that maximal pitch strength or the best estimate of pitch may require considerable time for processing, but short-term changes can change pitch strength independent of whether or not the pitch is maximal in pitch strength or if the most accurate estimate of the pitch has been achieved.
The fact that runs of regular intervals seem to effect the perception of pitch more than runs of random intervals appears to suggest that the auditory system is more influenced by regularity than randomness. If the suggestion in this paper that a change of only two or three consecutive regular intervals influences pitch-strength judgments, this perhaps implies that the auditory system is very sensitive to the regularity in a complex sound.
Acknowledgments
This research was supported by a program project grant from the National Institutes of Deafness and other Communication Disorders (NIDCD) and more recently by an NIDCD grant to Dr. Yost, and was part of Dr. Dan Mapes-Riordan's Ph.D. dissertation.
Appendix: Determining the Probability of Runs of Different Lengths
Determining the expected number of runs of regular k intervals of a given size in a shuffled ICI sequence consisting of a known number of regular k and random x intervals is a problem known in the field of probability and statistics as run or clump analysis (e.g., Godbole and Papastavridis, 1994). This problem is identical to finding, for example, the number of runs of red cards of a certain value in a shuffled deck of playing cards with the proportion of red and black cards being variable and cards being drawn without replacement. The distributions of sampling without replacement are known as hypergeometric distributions, whereas sampling with replacement is known as binomial or Bernoulli distribution (see Johnson and Kotz, 1977).
In determining the statistics of runs, care must be taken to define how runs are counted. Runs can be defined as overlapping or nonoverlapping, and contiguous or noncontiguous. For example, if overlapping runs are counted, the sequence kkkk contains one run of length 4, two runs of length 3, three runs of length 2, and four runs of length 1. If only nonoverlapping runs are counted, then the above sequence contains one run of length 4, one run of length 3, two runs of length 2, and four runs of length 1. If runs are further restricted to be nonoverlapping and noncontiguous, then the number of runs of length 2 is reduced to 1, and the number of runs of length 1 is reduced to 2. Note that the number of nonoverlapping runs of a given size is always less than the number of overlapping runs of the same size except for the endpoint conditions consisting of runs of size 1 and nk (nk is the total number of k's in the entire ICI sequence). In these cases, the number of overlapping and nonoverlapping runs is equal. The statistics of overlapping runs were used (except where noted) for relating the statistics of consecutive regular intervals in an ICI sequence to the perception of pitch strength in these click-train RIS.
A literature search turned up no analytical solution for the distribution of numbers of overlapping runs of a given size in a shuffled sequence. The closest known solution is given by Godbole (1990) for the distribution of nonoverlapping runs. As an alternative, a computer program was written that exhaustively searches all permutations of a given sequence of k's and x's (represented by 1's and 0's) and tallies the number of runs of every size. Unfortunately, this program was limited to a maximum ICI sequence length of 32 intervals. The ICI sequence lengths in the shuffled ICI sequence experiments were 60, 120, 240, and 480 intervals. A program for exhaustively searching ICI sequences longer than 32 intervals was not undertaken given the exponentially increasing calculation time for computing the distributions for these sequence lengths. However, the program was used to verify the analytical and empirical solutions given below.
Given equal numbers of regular k intervals (nk) and random x intervals (nx) in an ICI sequence, the expected number of k runs of size m in a shuffled sequence of these intervals is given (without proof) in Eq. (A1) below.
| (A1) |
Equation (A1) is only applicable for equal numbers of regular and random ICIs (nk=nx). An empirical approach was taken to determine the run statistics for conditions with differing numbers of regular and random intervals. This was accomplished by constructing the desired ICI sequence and repeatingly shuffling it and tallying the number of runs of different sizes. The results for the d=2-ms regular-interval condition (240 total ICIs) using 10 000 random permutations are given in Table IV.
An examination of the empirical results in Table IV indicates that the expected number of consecutive regular intervals of a given size resembles a binomial distribution. This is expected given that the results of sampling without replacement converge to the solution with replacement (binomial distribution) as the total number of intervals increases. This asymptotic solution for the expected number of consecutive regular intervals of size m in a sequence of ICIs made up of nk regular intervals and nx random intervals is given in Eq. (A2).
| (A2) |
TABLE IV.
The results of 10 000 random permutations of an ICI sequence containing 240 total intervals of varying proportion of regular-to-random intervals (columns). The top half of the table are the mean number of consecutive regular intervals of size 2–13 (rows) and the bottom half are the corresponding standard deviations.
| Mean number of consecutive intervals of run length (m) | Shuffled stimulus | ||||
|---|---|---|---|---|---|
| kx | kxx | kxxx | kxxxx | kxxxxx | |
| 2 | 59.4701 | 26.3466 | 14.7555 | 9.3882 | 6.5023 |
| 3 | 29.3299 | 8.5552 | 3.5791 | 1.8147 | 1.0284 |
| 4 | 14.4066 | 2.746 | 0.8574 | 0.3427 | 0.1637 |
| 5 | 7.0305 | 0.8788 | 0.1989 | 0.0657 | 0.0271 |
| 6 | 3.4167 | 0.28 | 0.0461 | 0.0117 | 0.0039 |
| 7 | 1.644 | 0.0886 | 0.0096 | 0.002 | 0.0005 |
| 8 | 0.7856 | 0.0275 | 0.0022 | 0.0001 | 0 |
| 9 | 0.3702 | 0.0092 | 0.0006 | 0 | 0 |
| 10 | 0.1763 | 0.002 | 0.0001 | 0 | 0 |
| 11 | 0.0845 | 0.0003 | 0 | 0 | 0 |
| 12 | 0.0409 | 0 | 0 | 0 | 0 |
| 13 | 0.0202 | 0 | 0 | 0 | 0 |
| Standard deviation of number of consecutive intervals of run length (m) | |||||
| 2 | 3.9038 | 3.4606 | 2.877 | 2.4882 | 2.12 |
| 3 | 4.7836 | 2.9818 | 1.9953 | 1.4501 | 1.0914 |
| 4 | 4.3859 | 2.0007 | 1.0971 | 0.6783 | 0.4651 |
| 5 | 3.5808 | 1.2296 | 0.5515 | 0.3003 | 0.1886 |
| 6 | 2.725 | 0.7128 | 0.2645 | 0.1264 | 0.0699 |
| 7 | 1.9942 | 0.4054 | 0.1237 | 0.0469 | 0.0224 |
| 8 | 1.4306 | 0.2235 | 0.06 | 0.01 | 0 |
| 9 | 1.0101 | 0.1171 | 0.0283 | 0 | 0 |
| 10 | 0.7084 | 0.051 | 0.01 | 0 | 0 |
| 11 | 0.4994 | 0.0173 | 0 | 0 | 0 |
| 12 | 0.3564 | 0 | 0 | 0 | 0 |
| 13 | 0.2585 | 0 | 0 | 0 | 0 |
Footnotes
Since the spectra of many of the stimuli are “rippled” rather than “flat,” spectrum level was computed for all stimuli as the total power of the stimulus divided by the bandwidth, which for the broadband conditions was 15 kHz. Thus, the spectral peaks for those stimuli with rippled spectra are greater than the stated spectrum level.
The statistical results are shown for the expected number of overlapping consecutive intervals. If nonoverlapping interval statistics are used, then runs of size 3, 4, and 5 best match the pitch strength ratings. Refer to the Appendix for a more detailed discussion on the differences between the statistics of overlapping and nonoverlapping runs.
References
- Bradley RA. Paired comparisons: Some basic procedures and examples. In: Krishnaiah PR, Sen PK, editors. Handbook of Statistics. Vol. 4 Elsevier; New York: 1984. [Google Scholar]
- Buunen TJF. The effect of stimulus duration on the prominence of pitch. In: van den Brink G, Bilsen FA, editors. International Symposium in Hearing; Delft: Delft University Press; 1980. pp. 374–379. [Google Scholar]
- David HA. The Method of Paired Comparisons. Oxford; New York: 1988. pp. 61–63. [Google Scholar]
- Godbole AP. On hypergeometric and related distributions of order k. Commun Stat: Theory Meth. 1990;19:1291–1301. [Google Scholar]
- Godbole AP, Papastavridis S, editors. Runs and Patterns in Probability: Selected Papers. Kluwer; Boston: 1994. [Google Scholar]
- Johnson NL, Kotz S. Urn Models and Their Application. Wiley; New York: 1977. [Google Scholar]
- Kaernbach C, Demany L. Psychophysical evidence against the autocorrelation theory of auditory temporal processing. J Acoust Soc Am. 1998;104:2298–2306. doi: 10.1121/1.423742. [DOI] [PubMed] [Google Scholar]
- Kaernbach C, Bering C. Exploring the temporal mechanisms involved in the pitch of unresolved harmonics. J Acoust Soc Am. 2001;110:1039–1048. doi: 10.1121/1.1381535. [DOI] [PubMed] [Google Scholar]
- Licklider JCR. A duplex theory of pitch perception. Experientia. 1951;7:128–133. doi: 10.1007/BF02156143. [DOI] [PubMed] [Google Scholar]
- Meddis R, Hewitt MJ. Virtual pitch and phase sensitivity of a computer model of the auditory periphery. I Pitch identification. J Acoust Soc Am. 1991;89:2866–2882. [Google Scholar]
- Meddis R, O'Mard L. A unitary model of pitch perception. J Acoust Soc Am. 1997;102:1811–1820. doi: 10.1121/1.420088. [DOI] [PubMed] [Google Scholar]
- Patterson RD, Allerhand M, Giguere C. Time-domain modeling of peripheral auditory processing: A modular architecture and a software platform. J Acoust Soc Am. 1995;98:1890–1894. doi: 10.1121/1.414456. [DOI] [PubMed] [Google Scholar]
- Patterson RD, Handel S, Yost WA, Datta J. The relative strength of tone and noise components in iterated rippled noise. J Acoust Soc Am. 1996;100:3286–3294. [Google Scholar]
- Pressnitzer D, de Cheveigné A, Winter IM. Perceptual pitch shift for sounds with similar waveform autocorrelation. ARLO. 2002;3:1–6. [Google Scholar]
- Pressnitzer D, de Cheveigné A, Winter IM. Physiological correlates of the perceptual pitch shift for sounds with similar autocorrelation. ARLO. 2004;5:1–6. [Google Scholar]
- Shofner WP, Selas G. Pitch strength and Stevens' power law. Percept Psychophys. 2002;64:437–450. doi: 10.3758/bf03194716. [DOI] [PubMed] [Google Scholar]
- Wiegrebe L. Searching for the time constant of neural pitch extraction. J Acoust Soc Am. 2001;109:1082–1091. doi: 10.1121/1.1348005. [DOI] [PubMed] [Google Scholar]
- Wiegrebe L, Hirsch HS, Patterson RD. Time constants of pitch processing arising from auditory filtering. J Acoust Soc Am. 1999;105:1234. [Google Scholar]
- Wiegrebe L, Patterson RD, Demany L, Carlyon RP. Temporal dynamics of pitch strength in regular interval noises. J Acoust Soc Am. 1998;104:2307–2313. doi: 10.1121/1.423743. [DOI] [PubMed] [Google Scholar]
- Wightman FL. Pitch and stimulus fine structure. J Acoust Soc Am. 1973;54:397–406. doi: 10.1121/1.1913591. [DOI] [PubMed] [Google Scholar]
- Yost WA. Temporal Aspects of Ripple Noise and Other Complex Stimuli. In: van den Brink G, Bilsen FA, editors. International Symposium in Hearing; Deflt: Delft University Press; 1980. pp. 367–374. [Google Scholar]
- Yost WA. Pitch of iterated rippled noise. J Acoust Soc Am. 1996a;100:511–518. doi: 10.1121/1.415873. [DOI] [PubMed] [Google Scholar]
- Yost WA. Pitch strength of iterated rippled noise. J Acoust Soc Am. 1996b;100:329–3335. doi: 10.1121/1.416973. [DOI] [PubMed] [Google Scholar]
- Yost WA. Auditory processing of sounds with temporal regularity: Auditory processing of regular interval stimuli. In: Palmer AR, Rees A, Summerfield AQ, Meddis R, editors. Psychophysical and Physiological Advances in Hearing; Proceedings of the 11th International Symposium on Hearing; London: Whurr; 1998. [Google Scholar]
- Yost WA, Hill R. Strength of the pitches associated with ripple noise. J Acoust Soc Am. 1978;64:485–492. doi: 10.1121/1.382021. [DOI] [PubMed] [Google Scholar]
- Yost WA, Mapes-Riordan D, Dye R, Sheft S, Shofner W. Discrimination of first- and second-order regular intervals from random intervals as a function of highpass filter cutoff frequency. J Acoust Soc Am. 2005;117:59–62. doi: 10.1121/1.1830671. [DOI] [PMC free article] [PubMed] [Google Scholar]
- Yost WA, Patterson RD, Sheft S. A time domain description for the pitch strength of iterated ripple noise. J Acoust Soc Am. 1996;99:1066–1078. doi: 10.1121/1.414593. [DOI] [PubMed] [Google Scholar]