Abstract
Fourier-transform infrared (FT-IR) difference spectroscopy has been proven to be a significant tool in biospectroscopy. In particular, the step-scan technique monitors structural and electronic changes at time resolutions down to a few nanoseconds retaining the multiplex advantage of FT-IR. For the elucidation of the functional mechanisms of proteins, this technique is currently limited to repetitive systems undergoing a rapid photocycle. To overcome this obstacle, we developed a flow-flash experiment in a miniaturised flow channel which was integrated into a step-scan FT-IR spectroscopic setup. As a proof of principle, we studied the rebinding reaction of CO to myoglobin after photodissociation. The use of microfluidics reduced the sample consumption drastically such that a typical step-scan experiment takes only a few 10 ml of a millimolar sample solution, making this method particularly interesting for the investigation of biological samples that are only available in small quantities. Moreover, the flow cell provides the unique opportunity to assess the reaction mechanism of proteins that cycle slowly or react irreversibly. We infer that this novel approach will help in the elucidation of molecular reactions as complex as those of vectorial ion transfer in membrane proteins. The potential application to the oxygen splitting reaction of cytochrome c oxidase is discussed.
Keywords: Carbonmonoxymyoglobin, Cytochrome c oxidase, Microfluidics, Step-scan spectroscopy, Vibrational spectroscopy
Introduction
Myoglobin is a monomeric oxygen transporting and storing protein of muscle tissue. The protein is well characterised and considered the hydrogen atom of biology [1]. The structure of the protein comprises eight helices A–H. The cofactor, heme b, is embedded in a hydrophobic pocket between helices E and F and ligated to the protein via a proximal histidine residue. The central ferric iron of heme b is able to bind oxygen and other small molecules, like carbon monoxide or nitric oxide. Substrate binding and rebinding kinetics after photolysis of myoglobin have been intensively studied, e.g. by X-ray crystallography [2, 3], time-resolved UV/Vis spectroscopy [4, 5] and time-resolved infrared spectroscopy [6, 7]. Instead of the natural ligand oxygen, infrared (IR) spectroscopy mostly uses the polar CO as IR probe which is photo-labile with a quantum efficiency of photolysis of close to unity [7]. Photodissociation of carbonmonoxymyoglobin (Mb-CO) yields a short-lived photoproduct, which relaxes to the deoxy form of myoglobin (deoxy-Mb) [8]. Deoxy-Mb exhibits several structural differences to Mb-CO, in particular heme-doming due to the out-of-plane movement of the heme iron, protein backbone displacements of helices B, C and E and, to a lesser extent, of helices F and G. As a consequence, single amino acids change their positions: H64 (sperm whale numbering) moves into the heme pocket, and the side chain of L29 rotates [2, 9]. The photo-dissociated CO is able to exit the protein through transiently opened cavities [10]. Rebinding of CO from the solution to the heme recovers the initial Mb-CO state. This recovery, which takes several milliseconds, has shown to be an intricate reaction with a number of intermediate states. The intermediates were studied with spatially resolved techniques such as crystallography with kinetic resolutions down to the sub-nanosecond time range [2, 3, 11].
To study the rebinding kinetics and the subsequent protein relaxation, step-scan Fourier-transform infrared (FT-IR) spectroscopy with high time resolution was also employed [6, 7, 12]. This method takes advantage from both the sensitivity of IR spectroscopy to electronic changes of the heme cofactor and structural changes of the apo-protein, as well as from the multiplex advantage of FT spectroscopy.
Up to now, most of the applications of step-scan FT-IR spectroscopy to biological samples are restricted to reversible or fast cycling systems. The reason is the necessity to record hundreds of time traces at the various sampling positions of the interferometer to generate the time-resolved data set. It is mandatory that the reaction under study must be precisely synchronised and strictly reversible for the ~1.000 sampling points that constitute the interferogram at a given optical resolution of 4 cm−1. In total, as much as 100.000 repetitions of the same experiment are not uncommon to achieve sufficient signal-to-noise ratio in a time-resolved step-scan experiment of a large protein [13]. This is most practically realised in studies of light-activated proteins by the use of pulsed laser sources [14, 15]. The sample is optically excited and measured and eventually recovers back to the initial state before the next reaction is induced.
For the investigation of irreversible reactions, it is essential that each measurement is performed on a fresh sample of identical concentration. Rödig and Siebert implemented a sample-changing wheel to provide fresh sample after each reaction [16]. Rammelsberg et al. reported a step-scan experiment using an IR microscope and an xy-stage that moves the sample after each excitation [17]. A major problem in both approaches is the change in optical path length when moving from one sampling position to the next because absorption changes as small as <1‰ are recorded on a film thickness of <10 μm! Moreover, both experiments employed hydrated films of membrane protein in which the concentration of compounds is difficult to control.
Here, we present a novel approach to perform step-scan FT-IR experiments for kinetic investigations of irreversible reactions of biological samples in solution. In our setup, the fresh sample condition is provided by continuously pumping the protein solution through a miniaturised flow cell with a sampling volume of only a few nanoliters. The rebinding reaction of CO to myoglobin was studied as a model for the catalytic reaction performed by highly complex heme proteins, like e.g. cytochrome c oxidase. The investigation of the mechanism of the irreversible reaction of cytochrome c oxidase with molecular oxygen was pioneered by Gibson and Greenwood when they developed the so-called flow-flash technique [18, 19]. There, a solution of the CO complex of reduced cytochrome c oxidase was mixed with oxygenated buffer in an observation tube. Heme-bound CO was displaced by a short photolysis flash, molecular oxygen binds to the vacant position and is immediately split [19]. Our experimental setup is designed to finally perform a time-resolved flow-flash IR experiment on the oxygen reaction of cytochrome c oxidase, the terminal enzyme of the mitochondrial respiratory chain.
Experimental section
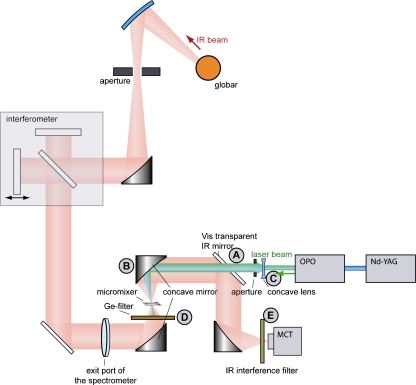
Optical setup All measurements were carried out on an IFS 66v/S FT-IR spectrometer (Bruker Optics, Rheinstetten, Germany) which was controlled by OPUSTM software. The collimated infrared light beam exiting the spectrometer through an external port was focused (focal diameter 1.0 mm) onto a microfluidic flow cell by a homemade focusing unit described in Fig. 9a [20]. The micro-fluidic device is positioned within the focus using an xyz-stage. The transmitted light is collected by the second off-axis parabolic mirror (B in Fig. 1) and transferred to a LN2-cooled MCT detector. To limit the IR radiation to the range(s) of interest, suitable interference filters (E in Fig. 1; OCLI, Santa Rosa, CA, USA and Spectrogon, Täby, Sweden) were inserted into the beam path. Photodissociation of Mb-CO was initiated with a 10 ns, 540 nm light pulse that is absorbed by the β-band of CO-bound heme of myoglobin. Laser pulses were produced by a tuneable optical parametric oscillator (OPO) system (Opta GmbH, Bensheim, Germany) pumped by the third harmonic of a Nd:YAG laser (Quanta-Ray Lab-150, Spectra Physics, Mountain View, CA, USA) at a repetition rate of 10 Hz. The laser pulse was enlarged by a concave lens (C in Fig. 1), and the diameter was adjusted by an aperture. The laser beam is made colinear to the IR beam via a dichroic mirror (3 × 3 in. MirrIR plate, Kevley Technologies, Chesterland, OH, USA; item A in Fig. 1) that is highly reflective to the infrared radiation but transmissive to the visible laser light. The laser pulse was focused onto the micro fluidic device by the same parabolic mirror that collects the transmitted infrared radiation (B in Fig. 1). To avoid damage to the spectrometer, the intense laser pulse was blocked by an infrared transparent germanium filter after it passed the micro fluidic device (D in Fig. 1). The whole optical setup was encased by a Plexiglas box that was purged by dry air (dew point −70 °C).
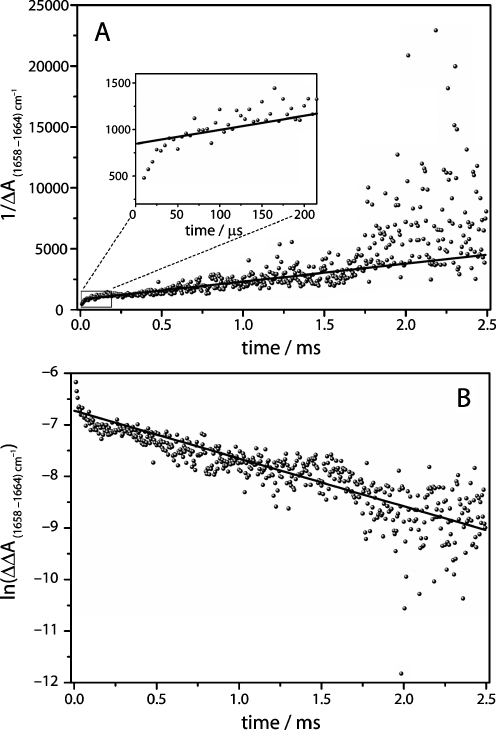
Fig. 9.
Kinetic analysis of the decay of the difference band 1,658–1,664 cm−1. a The plot of 1/∆A vs time exhibits linear behaviour in the time range of 15 μs to 1 ms. b The plot of ln∆∆A(1,658–1,664 cm−1) shows linear behaviour between 1 ms and 2.5 ms
Fig. 1.
Setup of the combination of the flow-flash and the time-resolved step-scan FT-IR experiment using the flow-channel of the micromixer. The black-body emission from the globar source is collimated before passing the interferometer and the exit port of the spectrometer and is focussed on the micromixer by a concave mirror (B). After transmitting the micromixer and reflection via a series of mirrors, the IR beam is fed onto the MCT detector. Before hitting the detector, the IR beam is filtered by interference filters (E) that limit the free spectral range of detection. The pulsed laser emission from the OPO, driven by the third harmonic of the Nd:YAG laser, is coupled into the path of the focusing optic by the use of a dichroitic mirror that is transmissive to visible light but reflective to IR radiation (A). After photoexcitation of the sample, the intense laser pulse is blocked by a germanium filter (D) from entering the spectrometer
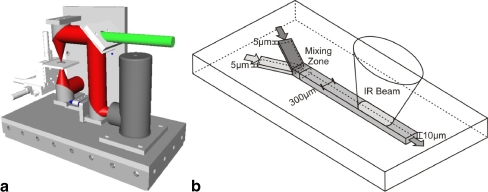
Micro mixer/liquid handling A previously described micromixer was used as a flow cell [21]. This microfluidic device consists of micro-channels made of SU8 epoxy resin that are embedded between two 1-mm thick CaF2 windows. As illustrated in Fig. 2, the measurement channel itself is 300 μm wide and 10 μm deep. With the diameter of 1,000 μm of the IR beam, a volume of 3 nl is sampled. Two inlet channels having a height of 5 μm are superimposed in the measurement channel where diffusion-based mixing takes place due to the forced laminar flow. The mixer was pressed onto a special mounting made of stainless steel by two PEEK clamps, and the openings between the CaF2 of the mixer and the support are sealed by O-rings. The support connects two inlet and one outlet capillary made of PEEK with the microfluidic device. Solution was pumped through the mixer with the help of two 1-ml Hamilton syringes simultaneously driven by a syringe pump (KDS Model 200, Novodirect, Kehl/Rhein, Germany). Because the micromixer was used as a continuous flow cell in this experiment, both syringes were filled with the same solution. The solution was filtered with 0.2 μm PEEK in-ferrule frits (Upchurch Scientific) to avoid blockage of the measurement cell by solid particles. A flow rate of 8 μl/min was chosen to ensure that no more than 10% of the sample volume was exchanged during the sampling time of a single step-scan experiment of 2.5 ms. The sample volume was exchanged more than four times from one laser pulse to the next which ensures that fresh sample was in the measurement spot before the next photo-excitation.
Fig. 2.
a Optical setup of the focusing unit with the IR beam shown in red and the laser beam in green. The microfluidic device (b) is placed in the focal point of the IR beam. b Schematic layout of the micromixer with the dimensions as indicated. The IR beam probes an area of about 0.3 mm2of the measuring channel
Sample preparation A 4 mM solution of myoglobin (from horse heart 90%, Sigma) was prepared in 25 mM phosphate buffer at pH 7.0. The solution was placed in an ultrasonic bath for 1 h and centrifuged at 21,900×g (Hettich, Micro 22R, Tuttlingen, Germany). The supernatant was sterile filtrated (0.2 μm cutoff) to remove insoluble components. The resulting myoglobin solution was chemically reduced by the addition of dithionite (final concentration of 16 mM) under anaerobic conditions at a Schlenk line (five cycles of vacuum and purging by Argon). In the final step, Argon was replaced by carbon monoxide, and the resulting solution was stirred for 30 min, yielding a solution of Mb-CO in the presence of an excess of 1 mM non-bound carbon monoxide. The formed Mb-CO complex is stable in solution but photolabile. For UV/Vis spectroscopy, the sample was diluted by 1:100 with 16 mM Na2S2O4 in water to control the formed Mb-CO state of the protein. Shortly before the time-resolved FT-IR experiments were started, the two gastight Hamilton syringes were filled with sample and connected to the inlets of the microfluidic cell under a stream of argon.
Time-resolved FT-IR experiments and data analysis Step-scan spectroscopy was performed with a spectral resolution of 4.5 cm−1 and a time resolution of 5 μs. Other technical details have been previously described [22]. The FT-IR experiments were performed in two different spectral regions, 2,429–1,669 cm−1 and 1,973–0 cm−1, by using suitable broadband and long-pass interference filters, respectively (E in Fig. 1). Ten time traces were co-added for each mirror position of the interferometer. Each step-scan experiment was repeated four times for the spectral region 2,429–1,669 cm−1 and 15 times for the region 1,973–0 cm−1. At the given flow rate of the myoglobin solution, these acquisition conditions resulted in a total sample consumption of 22.4 μl for measuring the first spectral range 2,429–1,669 cm−1, 469 mirror positions, four averaged full spectral datasets) and 229.5 μl for the second spectral range (1,973–0 cm−1 and 1,024 mirror positions, 15 averaged full spectral datasets). The first 36 spectra of a step-scan experiment, before the laser flash hits the sample, were averaged and used as the reference spectrum to calculate the difference spectra. The resulting difference spectra after photo-activation covered the time range from 5 μs to 2.5 ms. After generation of the matrix of 500 IR difference spectra at the respective time, singular value decomposition (SVD analysis) was applied [13, 23]. Global fit analysis was used to analyse the spectral range of 1,800–1,500 cm−1 as described by Majerus et al. [24].
Results and discussion
The functionality of proteins is critically dependent on the water content, calling for an aqueous environment. Unlike UV/Vis spectroscopy, the strong absorptivity of water presents a problem in IR spectroscopy of proteins. Thus, an optical path length of a few micrometres is typically used, and hydrated films are often employed to maximise the protein concentration. The challenge of time-resolved IR spectroscopy is to record difference spectra in the presence of the strong background absorption by the aqueous protein solution. IR spectroscopy of proteins in solution suffers from the fact that proteins are difficult to be concentrated to higher than a few millimolar. These considerations set the limits to the design of a microfluidic cell for IR spectroscopy as described in the experimental section. The optical path length of the mixer is 10 μm allowing FT-IR measurements in the spectral regions of water absorptions. The width of the measurement channel of 300 μm compromises adequate transmission of the focussed measuring beam and minimal sample consumption. The sample volume in the measuring spot is exchanged within 23 ms at the chosen flow of 8 μl·min−1. Thus, sample consumption is minimised to about 250 μl of 4 mM protein solution for the entire time-resolved step-scan experiments.
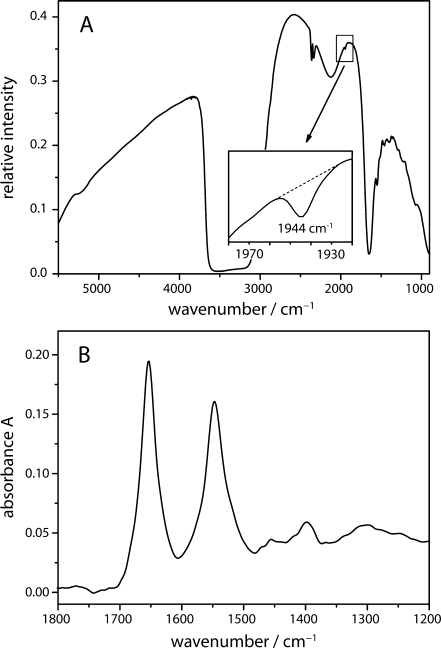
The microfluidic cell was filled with an anaerobic solution of Mb-CO. Figure 3a shows the single-beam IR spectrum which reflects the spectral emission of the globar source limited primarily by the detector’s spectral response. The strong absorption bands of water (3,360, 2,130 and 1,641 cm−1) overlapped by the weak bands of the protein backbone (amide A at 3,300 cm−1, amide I at 1,650 cm−1 and amide II at 1,549 cm−1) are evident. Small contributions from atmospheric CO2 are visible at 2,362 and 2,336 cm−1. The inset of Fig. 3a depicts the band of the stretching vibration of heme-bound CO (1,943 cm−1). The absorption spectrum of the protein (Fig. 3b) is calculated from the single-beam spectrum of the Mb-CO solution and of pure water. The latter was manually corrected for the displaced water, giving a flat baseline between 1,700 and 1,800 cm−1. The amide I and II absorption bands show maxima at 1,654 and 1,547 cm−1, respectively, characteristic for the predominant α-helical structure of myoglobin.
Fig. 3.
a Spectral intensity of 4 mM Mb-CO in 25 mM phosphate buffer pH 7.0 measured in the flow channel of the micro mixer. The very weak absorption of the bound CO at 1,943 cm−1 was detectable even in the single beam spectrum (see inset for the zoom-out). b Absorption spectrum of the aqueous Mb-solution with the IR spectrum of buffer solution as reference. The short path length of the microcell allows for the clear detection of the amide I and amide II absorption bands of the protein backbone
For time-resolved experiments, the photoreaction of Mb-CO was induced by a nanosecond laser pulse to dissociate bound CO from myoglobin. The laser pulse was spatially overlapped with the measuring IR beam (Fig. 1). Absorption changes were recorded with the step-scan technique where the intensity changes at each position of the moving mirror were recorded over time. To follow the kinetics of CO dissociation, the spectral range was limited by an interference filter to the 2,300–1,850 cm−1 range where the C–O stretching vibration of the ligand absorbs. The filter also blocked stray light of the exciting laser from hitting the detector and prevented spectral aliasing. As an additional benefit, undersampling was applied which effectively reduced the number of sampling positions required for a full interferogram.
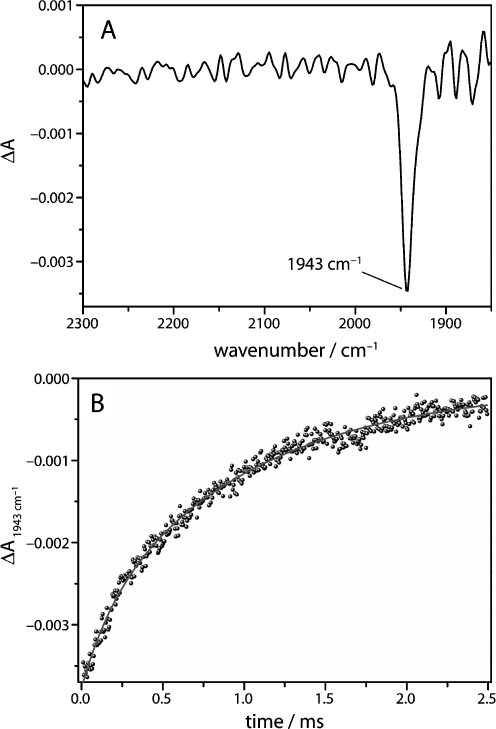
As a consequence of the photodissociation of CO, a pronounced negative difference band appears at 1,943 cm−1 (Fig. 4), indicating the loss of absorption in the newly generated state of the protein (deoxy-Mb). Due to the time-resolution of 5 μs of the setup, this band appears instantaneously. At room temperature, the released carbon monoxide is able to leave the protein through exit pathways that are transiently opened by protein fluctuations [2]. Re-binding of carbon monoxide from the solvent to the heme iron of myoglobin results in the decay of the negative difference band over time (Fig. 4b). The difference band at 1,943 cm−1 corresponds to the A1-band of the CO-stretching vibration. A shoulder corresponding to the A0-band is expected at 1,963 cm−1, but this band is difficult to be distinguished from noise [6, 25]. The time trace of the absorption at 1,943 cm−1 is plotted in Fig. 4b. The absence of large fluctuations in the kinetics of the change in absorbance demonstrates the constant optical path length during the experiment. The time trace is fitted using the sum of two exponentials (solid trace) which yields phenomenological time constants of 185 μs and 1 ms, respectively. A detailed kinetic analysis revealed that the reaction of the deoxy state of myoglobin to carbonmonoxymyoglobin obeys (pseudo-) first-order kinetics, if the concentration of carbon monoxide does not change significantly during reaction [25]. Thus, the kinetics of the reaction are described by simple integration of the differential rate law of a first-order reaction which results in:
 |
were [Mb] is the concentration of the decaying deoxy state of myoglobin, k1 the first-order rate constant, t the reaction time and c a constant that depends on the initial concentration. A plot of ln[Mb] vs t should result in a straight line if the assumption of a first-order reaction is valid. For the case where the concentration of carbon monoxide affects the reaction rate, the integrated rate law of the reaction corresponds to
 |
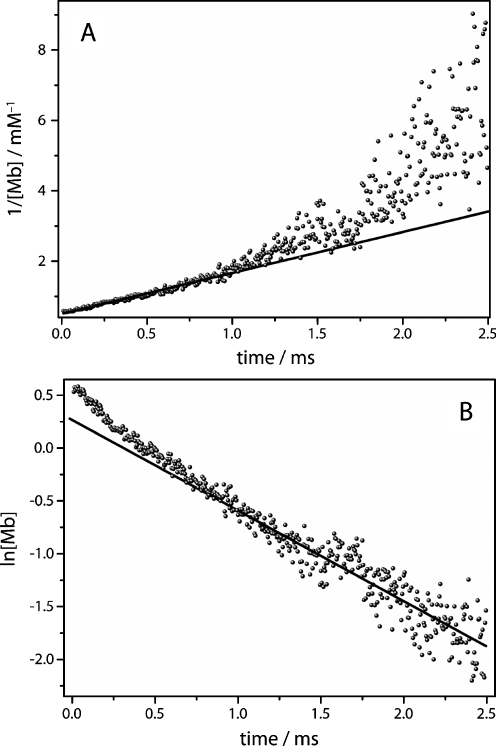
with k2 as the second-order rate constant and [Mb]0 as the initial concentration of deoxy myoglobin. The temporal change of [Mb]t was derived from the absorption difference at 1,943 cm−1 using the extinction coefficient εCO = 1.920 M−1 cm−1 as described by Plunkett et al. [7]. The plot of 1/[Mb] vs. t yields a linear relationship, if the reaction follows a second-order rate law. In agreement with Dixon et al. [25], the first part of the reaction (t < 1 ms) exhibits second-order kinetics that depend on the concentrations of both the unbound myoglobin and the free carbon monoxide (Fig. 5a). The initial concentration of photolysed CO significantly exceeds the concentration of dissolved CO in the buffer solution because of the high concentration of myoglobin used in the experiment (Fig. 5b). After the concentration of free carbon monoxide is reduced to the level of dissolved carbon monoxide (~1 mM at 293 K), the kinetic behaviour changes to pseudo first-order behaviour (Fig. 5b). In our experiment, this takes place for rebinding kinetics at t > 1 ms.
Fig. 4.
a Time-resolved step-scan difference spectrum of the photodissociation of CO from myoglobin at t = 10 μs after pulsed laser excitation. The negative band at 1,943 cm−1 corresponds to the stretching vibration of the photolabile CO ligand. b Time trace of the C–O stretching vibration at 1,943 cm−1. The solid line is a bi-exponential fit to the data with time constants τ1 = 185 μs and τ2 = 1.0 ms and relative amplitudes of 21% and 79%, respectively
Fig. 5.
Kinetic analysis of the recovery of the C–O stretching vibration. a The early kinetics (5 μs to 1 ms) exhibit second-order recovery kinetics as shown by the linear behaviour of the plot 1/[Mb] vs time. b The later part of the recovery kinetics display first-order kinetics as shown by the linear behaviour of the plot ln{[Mb]/mM} vs time
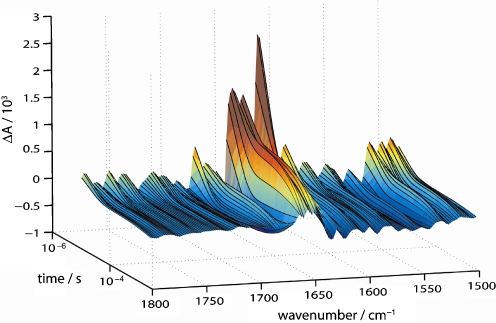
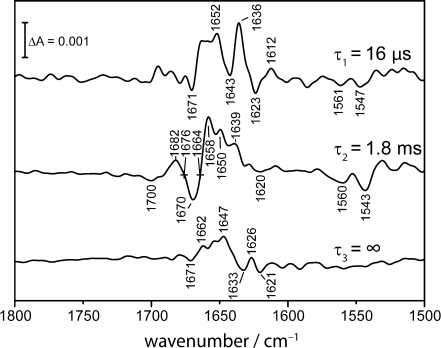
In a second set of step-scan experiments, the spectral range of 1,800–1,500 cm−1 was studied where the structural response of the protein is examined after CO dissociation. Because of the smaller magnitude of the difference bands as compared to the C-O stretching vibration band (vide supra), it was necessary to average more experiments for a sufficient signal-to-noise ratio. To further reduce the noise level, SVD analysis was applied, and the 3D data set was reconstructed using the three most significant components (see Fig. 6 for a 3D representation) [22]. It is evident that the vibrational changes across the spectral region of 1,800–1,500 cm−1 are much more complex than those reflected in the CO kinetics at 1,943 cm−1 (Fig. 4b). Therefore, global kinetic analysis was applied which identified three species-associated difference spectra (SADS): a fast decaying component (τ1 = 16 μs) which is followed by a second component (τ2 = 1.8 ms). The final SADS (τ3 = ∞) corresponds to the difference spectrum at the end of data recording because rebinding of CO from the bulk has not reached completion.
Fig. 6.
Time course of the FT-IR difference spectra of CO recombination to myoglobin. The spectral range is 1,800–1,500 cm−1 and covers the amide I and amide II vibrational bands. The time range of 10 μs to 2.5 ms is plotted on the logarithmic scale. Data shown are those reconstructed from fitting the absorbance changes to a sum of three exponentials (see text for details on the global fitting analysis)
The difference bands shown in the spectra of Fig. 7 were assigned to specific structural changes mainly in secondary structure with weak contributions from amino acid side chain vibrations [7, 8, 26, 27]. The differential shaped feature at 1,701 (−) and 1,683 cm−1 (+) represents a shift of the C–O stretching band of the terminal –COOH of the heme-propionic acid [8, 9]. The difference bands in the amide I range are indicative for changes in the structure of the protein backbone. The bleach at 1,669 cm−1 (−) was assigned to a change in a turn structure, the band at 1,658 cm−1 (+) to a shift of an α-helix, the band at 1,650 cm−1 (+) to an unordered structure and the features at 1,637 (+) and 1,624 cm−1 (–) to β-type turn structures [28]. The negative bands at 1,561 and 1,543 cm−1 are related to the structural changes in the amide II region, corresponding to the aforementioned changes in β-turn and α-helical structures [28].
Fig. 7.
Species-associated difference spectra (SADS) as a result of the global fitting to the step-scan difference spectra of CO-poised myoglobin. Three intermediate spectra were identified with time constants of τ1 = 16 μs, τ2 = 1.8 ms and τ3 = ∞ with the latter not decaying during the recording range of 2.5 ms. The calculation of the spectra from the raw data is described in the text
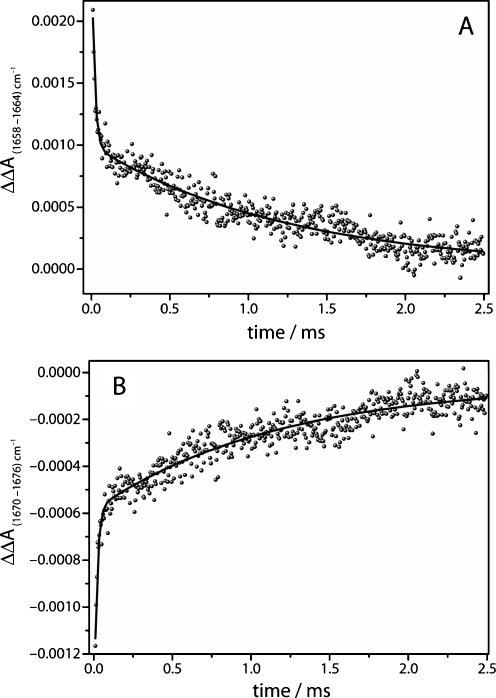
The kinetics of two distinct difference absorption bands in the range of the amide I vibrations are plotted exemplarily at 1,658 cm−1 in Fig. 8a and at 1,670 cm−1 in Fig. 8b. To account for baseline drifts, the difference to nearby isosbestic points (1,664 cm−1 in Fig. 8a and 1,676 cm−1 in Fig. 8b) were taken. Analogous to the rebinding kinetics of carbon monoxide to myoglobin, the kinetics of the protein structural changes do not exhibit simple mono-exponential behaviour. Again, a bi-exponential fit is used to describe the decay of these bands. While the fast components of the fit are too fast to be correlated to the CO-recombination process (τ = 17 μs), the slower components exhibit a time constant of 1.2 ms that corresponds well to the slow time constant of CO recombination (see Fig. 4b). The kinetics of secondary structure changes, as monitored by the changes of amide I difference bands, should tally to the rebinding kinetics of CO, if the binding of CO to the heme is the rate-limiting step in the formation of Mb-CO from deoxy-Mb and if the relaxed deoxy-state is already formed at the start of the measurement due to the fast relaxation of the ligated conformation of myoglobin after photolysis. Although the kinetics of the band at 1,658 cm−1 are noisier than those determined at 1,943 cm−1 (Fig. 5), it is evident that the fast kinetics exhibit linear behaviour in the time range up to 1 ms. This contrasts to later times (>1 ms) where a clear deviation from a linear fit is observed (see Fig. 9a). The early secondary structure changes exhibit second-order kinetics as it was observed for the CO rebinding kinetics. Plotting the reaction time of 1 to 2.5 ms against the natural logarithm of the absorption reveals the first-order behaviour for later timescales (Fig. 9b).
Fig. 8.
Time trace of two difference bands in the amide I spectral region a at 1,658–1,664 cm−1, b at 1,670–1,676 cm−1. Solid line Bi-exponential fit to the data. The slow components agree well to the slow component of the C–O stretching band kinetics (see Fig. 5b)
A detailed view on the early time range (5 to 30 μs in Fig. 9a) shows that the kinetics exhibit a significant deviation from the linear behaviour demonstrating that these structural changes are not correlated to the CO rebinding kinetics. A possible interpretation of this behaviour is an ongoing relaxation of the ligated conformation of myoglobin to deoxy-Mb after photolysis. Step-scan FT-IR experiments on myoglobin from horse-heart in D2O performed by Plunkett et al. agree with our data [7]. These authors found that the decay of the amide I difference band exhibited faster second-order kinetics than the recovery of CO. In contrast, studies on sperm-whale myoglobin in D2O using a tuneable CW lead salt diode infrared probe laser, concluded that protein relaxation after photolysis of CO from Mb-CO is complete after 100 ns [8]. The variation in the experimental results may be attributed to the different behaviour of myoglobin from different organism (horse heart vs. sperm whale) and to the influence of the solvent isotope effect (H2O vs. D2O).
Conclusion
It is demonstrated that the combination of microfluidics with time-resolved step-scan FT-IR spectroscopy can be successfully applied to studies of the reaction kinetics of proteins in solution. As a proof of concept, we studied the kinetics after CO photodissociation from myoglobin. Rebinding of CO from solution to the heme-iron was monitored together with the subsequent protein structural changes. The major technological advance of this novel spectroscopic approach lies in the fact that it allows for step-scan spectroscopy on non-cyclic reactions of proteins in aqueous solution. Previous step-scan studies were commonly performed on hydrated films to reduce the absorption of water in the IR range. We minimised the sample consumption by using a microfluidic flow cell which enables to record multiple co-additions to improve the signal-to-noise ratio while keeping the sample consumption at realistic levels of milligram amounts of protein for a full step-scan experiment. The noise level is reduced by using a dedicated focusing unit which optimises optical throughput of our microfluidic setup.
An additional benefit lies in the opportunity to mix two solutions immediately before excitation. This flow-flash approach has provided valuable insights into the mechanism of the oxygen splitting reaction of cytochrome c oxidase by monitoring the visible absorption of the heme and copper cofactors [18, 19]. Up to now, the short optical path length of ∼10 μm mandatory for mid-IR spectroscopy of aqueous solutions has prevented the application of the classical flow-flash technique to time-resolved IR spectroscopy. As mixing experiments have been successfully performed with the micromixer [21, 29], an oxygen-containing solution will be rapidly mixed with the reduced and CO-bound cytochrome c oxidase, and the irreversible reaction of the enzyme with oxygen is initiated by photodissociation of the carbon monoxide complex. Temporal synchronisation of the flow, photolysis and mirror movement of the interferometer was achieved as demonstrated by the experiments shown here. Thus, the experimental prerequisites are now implemented to perform a flow-flash experiment with FT-IR detection on cytochrome c oxidase in order to study the oxygen-splitting reaction of this central membrane complex of the respiratory chain. These experiments are currently under way.
Acknowledgements
Financial support for the German part of this research was provided by the Volkswagen Foundation (“Intra- und intermolekulare Elektronenübertragung”). Support for the Austrian part from Carinthian Tech Research AG and the COMET Competence Centre Programme of the Austrian Government is gratefully acknowledged.
Open Access This article is distributed under the terms of the Creative Commons Attribution Noncommercial License which permits any noncommercial use, distribution, and reproduction in any medium, provided the original author(s) and source are credited.
Footnotes
An erratum to this article can be found at http://dx.doi.org/10.1007/s00216-009-2928-0
References
- 1.Frauenfelder H, McMahon BH, Fenimore PW (2003) Proc Natl Acad Sci U S A 100:8615–8617 [DOI] [PMC free article] [PubMed]
- 2.Ostermann A, Waschipky R, Parak FG, Nienhaus GU (2000) Nature 404:205–208 [DOI] [PubMed]
- 3.Schotte F, Lim M, Jackson TA, Smirnov AV, Soman J, Olson JS, Phillips GN Jr, Wulff M, Anfinrud PA (2003) Science 300:1944–1947 [DOI] [PubMed]
- 4.Frauenfelder H, Alberding NA, Ansari A, Braunstein D, Cowen BR, Hong MK, Iben IET, Johnson JB, Luck S, Marden MC, Mourant JR, Ormos P, Reinisch L, Scholl R, Schulte A, Shyamsunder E, Sorensen LB, Steinbach PJ, Xie AH, Young RD, Yue KT (1990) J Phys Chem 94:1024–1037 [DOI]
- 5.Gibson QH, Regan R, Elber R, Olson JS, Carver TE (1992) J Biol Chem 267:22022–22034 [PubMed]
- 6.Rödig C, Siebert F (1995) Rebinding and concomitant protein relaxation of photodissociated CO-myoglobin studied by time-resolved FTIR spectroscopy. Dyer, R. B., Martinez, M. D., Shreve, A., and Woodruff, W. A. Proceedings of the 7th International Conference on Time-Resolved Vibrational Spectroscopy, 291-292. 1997. Los Alamos National laboratory, Los Alamos, New Mexico. Ref Type: Conference Proceeding
- 7.Plunkett SE, Chao JL, Tague TJ, Palmer RA (1995) Appl Spectrosc 49:702–708 [DOI]
- 8.Causgrove TP, Dyer RB (1993) Biochemistry 32:11985–11991 [DOI] [PubMed]
- 9.Kuriyan J, Wilz S, Karplus M, Petsko GA (1986) J Mol Biol 192:133–154 [DOI] [PubMed]
- 10.Olson JS, Phillips GN Jr (1996) J Biol Chem 271:17593–17596 [DOI] [PubMed]
- 11.Schmidt M, Nienhaus K, Pahl R, Krasselt A, Anderson S, Parak F, Nienhaus GU, Srajer V (2005) Proc Natl Acad Sci U S A 102:11704–11709 [DOI] [PMC free article] [PubMed]
- 12.Hu X, Frei H, Spiro TG (1996) Biochemistry 35:13001–13005 [DOI] [PubMed]
- 13.Heitbrink D, Sigurdson H, Bolwien C, Brzezinski P, Heberle J (2002) Biophys J 82:1–10 [DOI] [PMC free article] [PubMed]
- 14.Uhmann W, Becker A, Taran C, Siebert F (1991) Appl Spectrosc 45:390–397 [DOI]
- 15.Zscherp C, Heberle J (1997) J Phys Chem B 101:10542–10547 [DOI]
- 16.Rödig C, Siebert F (1999) Vib Spectrosc 19:271–276 [DOI]
- 17.Rammelsberg R, Boulas S, Chorongiewski H, Gerwert K (1999) Vib Spectrosc 19:143–149 [DOI]
- 18.Gibson QH, Greenwood C (1963) Biochem J 86:541–554 [DOI] [PMC free article] [PubMed]
- 19.Greenwood C, Gibson QH (1967) J Biol Chem 242:1782–1787 [PubMed]
- 20.Hinsmann P, Haberkorn M, Frank J, Svasek P, Harasek M, Lendl B (2001) Appl Spectrosc 55:241–251 [DOI]
- 21.Kaun N, Kulka S, Frank J, Schade U, Vellekoop MJ, Harasek M, Lendl B (2006) Analyst 131:489–494 [DOI] [PubMed]
- 22.Heberle J, Zscherp C (1996) Appl Spectrosc 50:588–596 [DOI]
- 23.Shrager RI, Hendler RW (1998) J Biochem Biophys Methods 36:157–173 [DOI] [PubMed]
- 24.Majerus T, Kottke T, Laan W, Hellingwerf K, Heberle J (2007) ChemPhysChem 8:1787–1789 [DOI] [PubMed]
- 25.Dixon AJ, Glyn P, Healy MA, Hodges PM, Jenkins T, Poliakoff M, Turner JJ (1988) Spectrochim Acta A 44:1309–1314 [DOI]
- 26.Schlereth DD, Mantele W (1992) Biochemistry 31:7494–7502 [DOI] [PubMed]
- 27.Dong A, Huang P, Caughey B, Caughey WS (1995) Arch Biochem Biophys 316:893–898 [DOI] [PubMed]
- 28.Krimm S, Bandekar J (1986) Adv Protein Chem 38:181–364 [DOI] [PubMed]
- 29.Svasek P, Svasek E, Lendl B, Vellekoop M (2004) Sens Actuators A 115:591–599 [DOI]


