

Abstract
Early detection and diagnosis of prostate cancer (PCA) is key to designing effective treatment strategies. Microarrays have resulted in the discovery of Hepsin (HPN) as a biomarker for detection of PCA. In this study we explore the development of HPN imaging probes for detection of prostate cancer. We used phage display to isolate HPN binding peptides with 190 ± 2.2 nM affinity in monomeric form and high specificity. The identified peptides were able to detect human prostate cancer on tissue microarrays and in cell based assays. HPN targeted imaging agents were synthesized by conjugating multiple peptides to fluorescent nanoparticles to further improve avidity through multivalency and to improve pharmacokinetics. When injected into mouse xenograft models, HPN-targeted nanoparticles bound specifically to HPN-expressing LNCaP xenografts compared to non-HPN expressing PC3 xenografts. HPN imaging may provide a new method for detection of PCA.
Keywords: Prostate cancer, early detection, molecular imaging
Introduction
Prostate cancer is the most commonly diagnosed non-skin cancer in American men, and the second leading cause of cancer-related death in this group (1). Local therapy (surgery or radiation) can be curative, and surgery is proven to save lives when compared with watchful waiting (2). However, the efficacy of local therapy is predicated on early detection; prostate cancer recurs in up to 40% of men after local therapy, presumably because it had spread prior to diagnosis (3). Moreover, imaging tools to accurately define tumor volume are lacking. Clearly, to improve current prostate cancer cure rates and decrease treatment-related morbidity by selecting appropriate patients for active surveillance, tools to accurately identify small amounts of localized disease and quantify tumor volume are needed.
The foundation of prostate cancer screening is serum prostate specific antigen (PSA). This test is limited by the simple fact that PSA is produced both by prostate cancer and by the normal prostate. Thus, not surprisingly, serum PSA screening for early detection of prostate cancer is neither sensitive nor specific and leads to a) unnecessary biopsies in men with benign prostatic hypertrophy (BPH) and high circulating PSA and b) missed prostate cancer in men with smaller prostate glands and low circulating PSA (4-6). Novel prostate cancer biomarkers without these significant flaws are needed.
An important step in the discovery of novel biomarkers is a molecular understanding of prostate cancer development and progression. Several published, microarray analyses have revealed the presence of a cluster of genes upregulated only in prostate cancer tumor cells (7). One gene, hepsin (HPN), was consistently upregulated and had one of the highest differences in expression ratio between normal/BPH and PCA. Specifically, analyses of 9 published datasets (7-15), comprising ∼500 patients revealed that HPN was collectively upregulated in prostate cancer.
Hepsin (HPN; EC 3.4.21.106) is a type II transmembrane serine protease that is normally expressed during development but has absent or low levels of expression in normal prostate or benign prostate hyperplasia (BPH) (7-15). Importantly, HPN is expressed both in the precursor lesion of prostate cancer, high-grade prostate intra-epithelial neoplasia (HG-PIN), and in hormone-refractory metastatic tumors (7). Its cell surface expression and malignant cell localization thus make it an ideal candidate for the development of prostate cancer targeted imaging agents. Unfortunately, to date there are no commercially available reagents with sufficiently high affinity such as peptides or small molecules. Therefore, we used iterative phage display selection to identify novel high affinity binding peptides selective and specific for HPN. The identified peptides were able to detect human prostate cancer on tissue microarrays. Using the developed agent, we were able to visualize 4.6 mm prostate cancer by tomographic optical imaging.
Materials and Methods
Materials
RPMI medium without phenol red, 1 M HEPES solution, sodium pyruvate solution, sodium bicarbonate solution, Dulbecco's phophate-buffered saline with Ca2+ and Mg2+ (DPBS+), and Hanks balanced salts solution (HBSS) were purchased from Biowhittaker Bioproducts (Walkersville, MD). Fetal calf serum (FCS) was purchased from Cellgro (Herndon, VA). Lipofectin was obtained from Invitrogen (Carlsbad, CA). All other chemicals were of the highest quality grade available from Fisher Scientific (Suwanee, GA) or Sigma Chemical Co. (St. Louis, MO).
Cell lines
PC3, LNCap, and DU145 human prostate cancer cells were obtained from the American Type Tissue Culture Collection. The PC3 and DU145 (HPN negative) (16) and LNCaP (HPN positive) (16) cell lines were maintained in RPMI without phenol red medium supplemented with 10% FCS, 2mM L-glutamine, and 1mM sodium pyruvate at 37°C in 5% CO2. HPN stably transfected PC3 cells (HPN-PC3) were maintained in RPMI without phenol red supplemented with 10% FCS, 2mM glutamine, 1mM sodium pyruvate, and 500 ug/mL G418 at 37°C in 5% CO2. For routine maintenance, cells were passaged by trypsinization immediately upon reaching confluence.
Transfections
The entire HPN encoding sequence fused to a FLAG tag was cloned into the vector PC-DNA3.1 (gift from Dr. Dhanasekaran and Dr. Chinnaiyan). The plasmid was grown in E. coli (MAX Efficiency DH5-α Competent Cells, Invitrogen, Carlsbad, CA) and isolated with an endotoxin-free preparation kit (Endo-Free Plasmid Maxikit, Qiagen, Valencia, CA). Transfection into PC3 cells was performed by overnight incubation of PC3 cells with a mixture of plasmid and Lipofectin at a DNA/lipid ratio of 1:7.5 in serum-free medium (OptiMem 1, Invitrogen, Carlsbad, CA) for 12 hours. A total of 2 μg DNA was used per 5 cm culture dish. After incubation, the cells were washed and incubated with complete medium. After 2 days with complete medium, the cells were transferred into selection medium (700 μg/mL of G418). Stably-transfected clones were isolated by limiting dilution. For selected clones, this step was repeated to ensure monoclonality. The HPN-transfected clone was designated HPN-PC3. The expression of HPN was confirmed by real time, quantitative PCR and FACS.
Phage Display Selection
Phage selection and negative depletion were performed using previously published protocols (17). Briefly 1010 PFU of phage, displaying random 7 amino acid peptides (7-PhD; New England Biolabs, Beverly, MA) were incubated with HPN-PC3 cells at 37°C for 1 hour to allow time for HPN-mediated internalization. Extracellular restricted phage were removed with 0.2M glycine pH 2.2 (3 × 8 minutes). Internalized phage were recovered by lysis with 0.1% triethanolamine (Sigma Chemical Company) in PBS, pH 7.4, (4 min, room temperature). Extracts were neutralized with 500 μl of 0.5 M Tris-HCl pH 9.0. In order to deplete phage that bound to identical markers present on both HPN-PC3 and PC3 cells, the phage pool isolated after one round of selection was subtracted by three rounds of successive incubation at 37°C for 30 minutes with confluent monolayers of PC3 cells that are negative for HPN. The phage that were internalized by HPN-PC3 cells but not PC3 cells were amplified by E. coli, titered, subjected to three additional rounds of positive selection, and individual clones selected for ELISA assay and sequencing (Fig. 1A).
Figure 1.
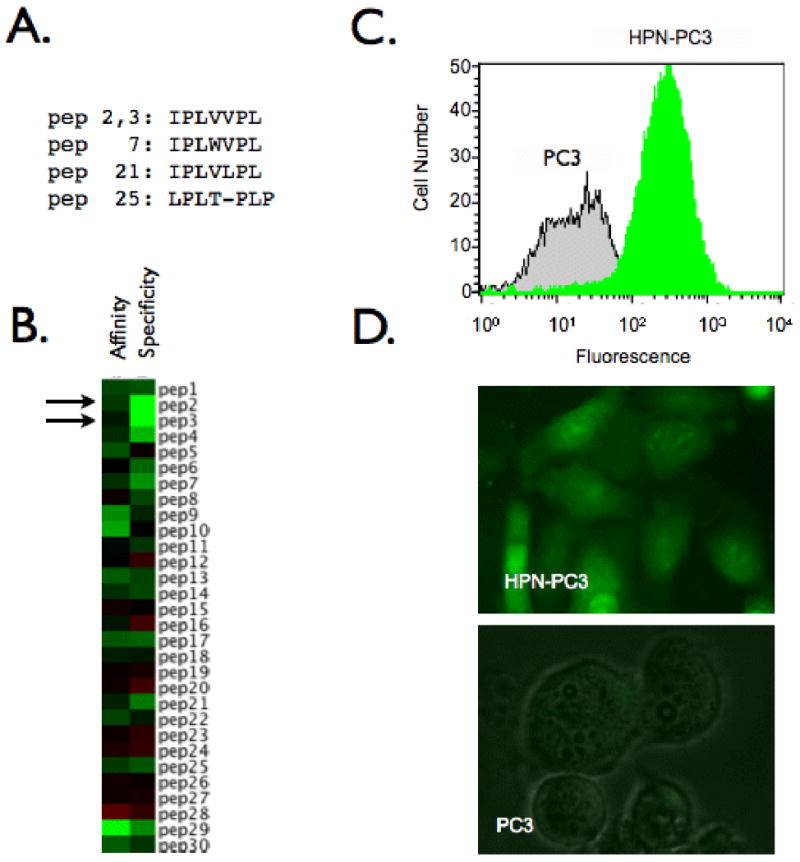
Phage display screening produces a peptide specific for HPN. A. Consensus family identified through selection B. Heatmap depicting affinity and specificity of individual phage clones. Green: high value, black: average value, red: low value. C. FACs analysis demonstrating specificity of IPL-• for HPN-PC3 cells. D. Fluorescence microscope images of IPL-• binding to HPN-PC3 cells but not parental PC3 cells.
ELISA
Confluent monolayers of HPN-PC3 or PC3 cells were incubated at room temperature with individual phage clones (1010 PFU, 1 h), washed with PBS containing 0.1% Tween-20, incubated with biotinylated anti-M13 antibody (1:40, 1 h), detected with streptavidin-HRP (1:500), developed with tetra methyl benzidine and absorbance650 was determined (Emax, Molecular Devices, Sunnyvale, CA). Heat maps are a graphical representation of the ELISA data with green representing highest values, black representing mean values and, red representing low values. Affinity refers to the absorbance of clones on HPN-PC3 cells and specificity is the ratio of absorbance of clones on HPN-PC3 and PC3 cells (Fig. 1B).
Peptide synthesis
Peptides (HPN targeted and scrambled; Table 1) were purchased from Tufts peptide core facility with a GGSK(FITC)C linker for conjugation of the peptide to a model fluorescent nanoparticle (Cross Linked Iron Oxide: CLIO), which has been previously used as a targeting platform (18). Briefly, succinimidyl iodoacetic acid was reacted with aminated starting material for 15 minutes, purified by size exclusion chromatography, then reacted with peptidyl-cysteine for 1 hour. The nanoparticles were purified again using size exclusion chromatography and the ratio of peptides/nanoparticle was quantified by absorbance spectroscopy. A typical synthesis results in 11 peptides/CLIO.
Table 1.
Description of agents used in this study.
| Abbreviation | Sequence | Label | Use | |
|---|---|---|---|---|
| IPL-Φ | Phage | IPLVVPL | FITC | Microscopy Competition FACs |
| IPL-F | Peptide | IFLVVPLGGSCK(FITC) | FITC | Microscopy Competition FACs |
| ScP | Peptide | VILVPPLGGSCK(FITC) | FITC | Competition |
| IPL-NP | Nanoparticle | IPLVVPLGGSC(NP-Cy5.5)K (FITC) | FITC (pep) Cy5.5(NP) | Microscopy FACs TMA Imaging |
| NP | Nanoparticle | AF750 (NP) | Imaging |
Fluorescence Confocal Microscopy and Flow Cytometry
Phage were FITC labeled as previously described (19). Confluent HPN-PC3 cells or PC3 cells were incubated with 10×1010 PFU of FITC labeled phage for 1 hour at 37°C, washed 3× with PBS, analyzed via flow cytometry (Fig. 1C) (10,000 cells/sample) on a Becton Dickinson FACsCalibur (San Jose, CA), and then visualized by fluorescence microscopy (Fig. 1D) (Nikon 80i Eclipse equipped with a 512 Photometrics Cascade CCD, Nikon, Melville, NY). HPN-PC3, LNCaP, PC3, and DU145 cells were incubated with 1 μM of IPL-F for 1 hour at 37°C, washed then analyzed via flow cytometry. Mean fluorescence from 30,000 cells was plotted to describe relative IPL-F uptake (Fig. 2A).
Figure 2.
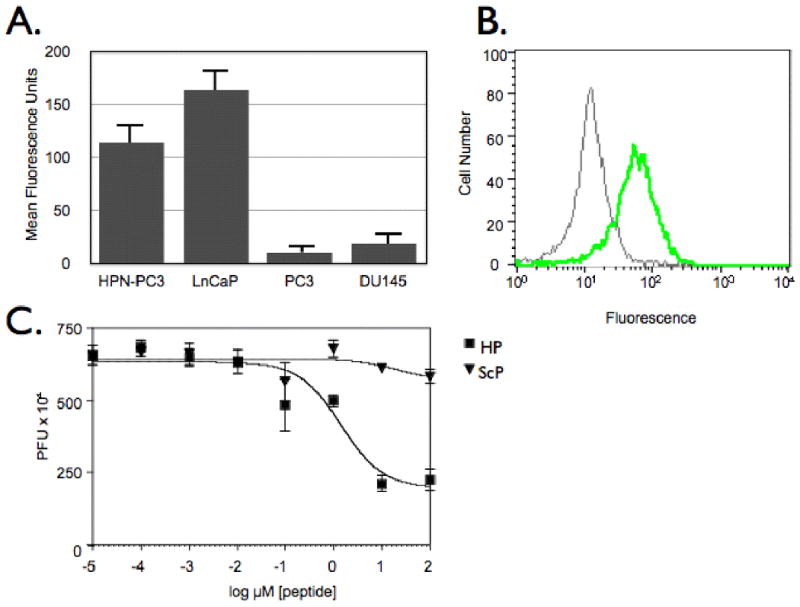
Characterization of IPL-F binding to HPN-expressing cells. A. IPL-F discriminates between HPN expressing prostate cancer cell lines HPN-PC3 and LNCaP and non-expressing cell lines PC3 and DU145. B. IPL-F binds to HPN. Anti-HPN antibody competes for IPL-F binding to HPN-PC3 cells. Green Histogram: HPN-PC3 cells incubated with IPL-F, Gray Histogram: HPN-PC3 cells incubated with anti-HPN antibody and IPL-F. C. Competition assay. IPL-• were competed from HPN-PC3 cells with increasing concentrations of IPL-F whereas ScP was unable to compete for binding at assayed concentrations of peptide
Competition Experiments
HPN-PC3 cells were incubated with IPL-F and either anti-HPN antibody or vehicle for 1 hour at 37°C, washed, detached, then analyzed via flow cytometry (Becton Dickinson FACsCalibur (Fig. 2B) (San Jose, CA)). Additionally, IPL-Φ and IPL-F or ScP were incubated with HPN-PC3 cells for 1 hour at 37°C, washed, then phage were eluted and titered to determine the extent of competition (Fig 2C).
Tissue Microarray
Binding of HPN specific peptides to ex vivo human tissues was tested using frozen tissue sections and tissue microarrays (Fig. 3 and Supplementary Fig. 1). The prostate samples used for the study were part of the prostatectomy cohort obtained from the BWH-DFHCC prostate cancer SPORE tissue bank. A multi-tumor frozen array was constructed using a manual tissue arrayer (Beecher Instruments, Silver Spring, MD) with prior institutional review board approval. The array consisted of benign prostate samples (N=6) and localized prostate cancer (N=5). Four of the tumor samples had Gleason grades of 6 with one sample having a Gleason grade of 8. Each sample was represented by two cores in the array for a total of 22 tissue sections. During the array construction, samples were placed in dry ice to prevent melting. Dry ice was held against the needle before and after coring and while dispensing the core to minimize melting. 5 μm sections were used for in situ analysis of the peptides. The sections were fixed in ice-cold acetone and blocked with 5% BSA, 30 min at room temperature followed by 10% normal goat serum, 30 min at room temperature and with serum free protein block (Dakocytomation, Carpinteria, CA) for 10 min at room temperature. Following this, the sections were washed three times with calcium magnesium-free PBS and incubated with 0.1 μM IPL-F or 0.1 μM IPL-NP in PBS containing 0.1% BSA for 2 hours at 37°C, washed 3×with PBS, mounted with prolong gold anti-fade reagent containing DAPI (Invitrogen, Carlsbad, CA). The binding was visualized via fluorescence microscopy (Olympus, Center Valley, PA) BX-51 fluorescence microscope equipped with a charge-coupled device camera, and the CytoVision FISH imaging and capturing software (Applied Imaging, San Jose, CA)). The specificity of binding was confirmed by two pathologists (SP, MAR). Fig. 3A and C are representative images taken from tumor samples incubated with probe and Fig. 3B and D are representative images taken from benign samples incubated with probe.
Figure 3.
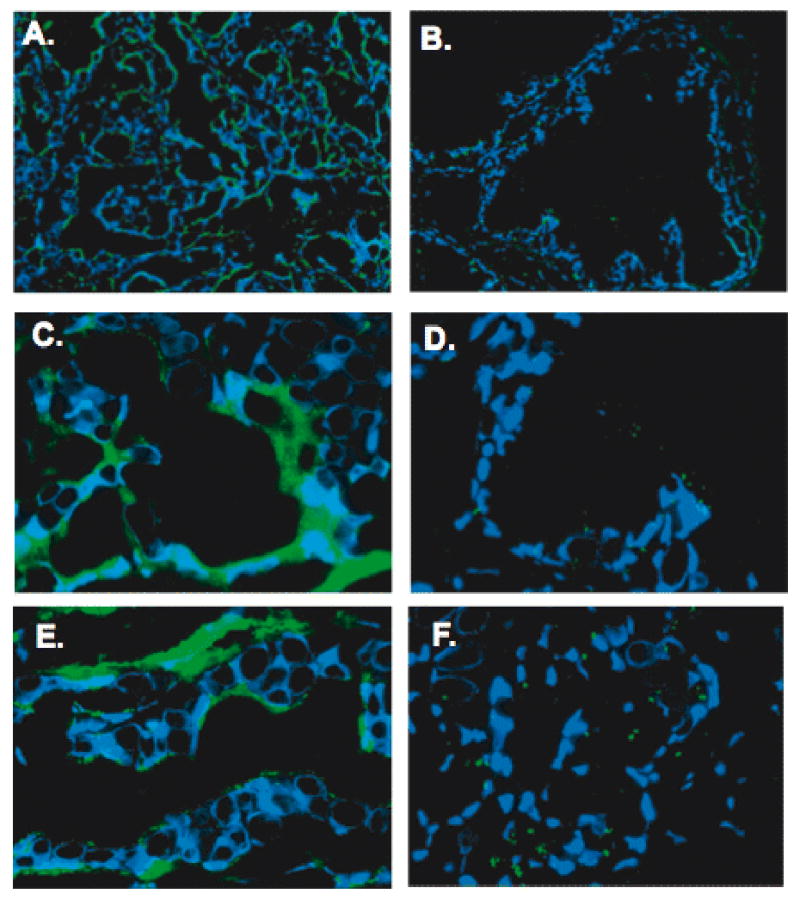
HPN targeted peptides and nanoparticles are able to identify human prostate cancer. IPL-F or IPL-NP was incubated with tissue microarrays consisting of 6 normal and 5 cancer human radical prostatectomy specimens. Results shown are representative images. Panels A. and C show the binding of IPL-F/IPL-NP to cancer glands and panels B. and D. show the binding to benign glands (Original magnification of A and B, 20×; Original magnification of C and D, 60×). Note staining in the tumor cells and the absence/weak staining in benign tissues and stroma.
Specificity of IPL-NP
HPN-PC3 and PC3 cells were incubated with 1 μM of IPL-F or IPL-NP for 1 hour at 37°C, washed then analyzed via flow cytometry. Mean fluorescence from 30,000 cells was plotted to describe relative IPL-F uptake (Fig. 4A).
Figure 4.
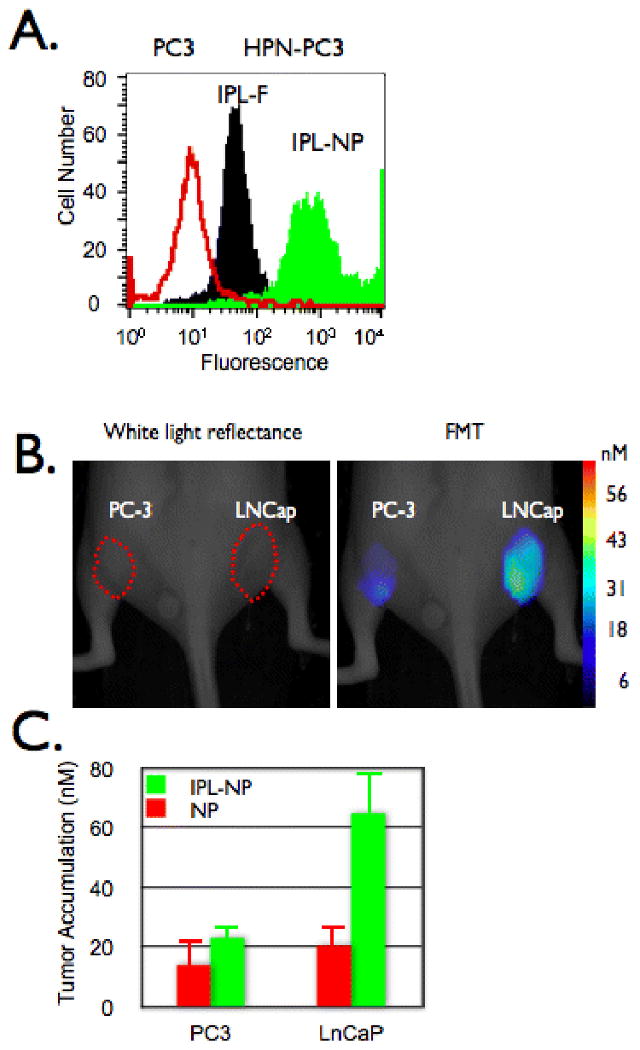
In vivo imaging of prostate cancer. A. HPN-PC3 (black and green histograms) or PC3 (red histogram) cells were incubated with IPL-F (black histogram) or IPL-NP (green histogram) then analyzed via flow cytometry. B and C. Mice bearing tumors derived from PC-3 (left flank) or LNCaP (right flank) were co-injected with IPL-NP (green bars) and NP (red bars) then (B) imaged and (C) accumulation quantified via FMT 24 hours post injection.
In vivo Optical Imaging Experiments
Male nude mice ages 7-9 weeks were purchased from the MGH breeding colony (COX-7) and maintained in approved pathogen free institutional housing facilities. All experiments were performed according to institutional guidelines. In all experiments, probe was administered intravenously at 20 mg Fe/kg body weight. For the in vivo specificity of IPL-NP, optical imaging of nude mice (n=7) bearing subcutaneously implanted tumors (diameter 5-6 mm) derived from the immortalized human prostate cancer cell lines the HPN negative PC3 (Fig. 4B, left flank) and HPN positive LNCaP (Fig. 4B, right flank) was performed. We chose LNCaP cells since they express HPN, IPL-F binds to them, and HPN-PC3 cells fail to form tumors in immunocompromised mice (data not shown and (20)). Mice were co-injected via tail vein with IPL-NP and NP (see Table 1 for description) then imaged via fluorescence-mediated tomography (FMT) 24 hours after injection (Fig. 4B) and the results quantitated in Fig. 4C. Image acquisition parameters, analysis, and quantization was similar to what was recently described (21). For blood half-life studies and tumor accumulation time course studies, nude mice (n=5) were subcutaneously implanted with LNCaP cells on each flank (Fig. 5A and B). The mice were imaged via FMT for IPL-NP tumoral accumulation and blood drawn at 0, 1, 3, 6, 24, and 48 hours post probe administration. Blood was analyzed for IPL-NP presence by fluorescence reflectance imaging, which quantitates the amount of fluorochrome in the sample (Bonsai, Siemens Medical, Malvern, PA, USA). Background fluorescence of blood was analyzed using non-injected control animals (n=3). To determine the size limit of tumor detection, mice bearing different size LNCaP derived tumors were injected with probe then imaged via FMT 3 hours post injection (Fig. 5C).
Figure 5.
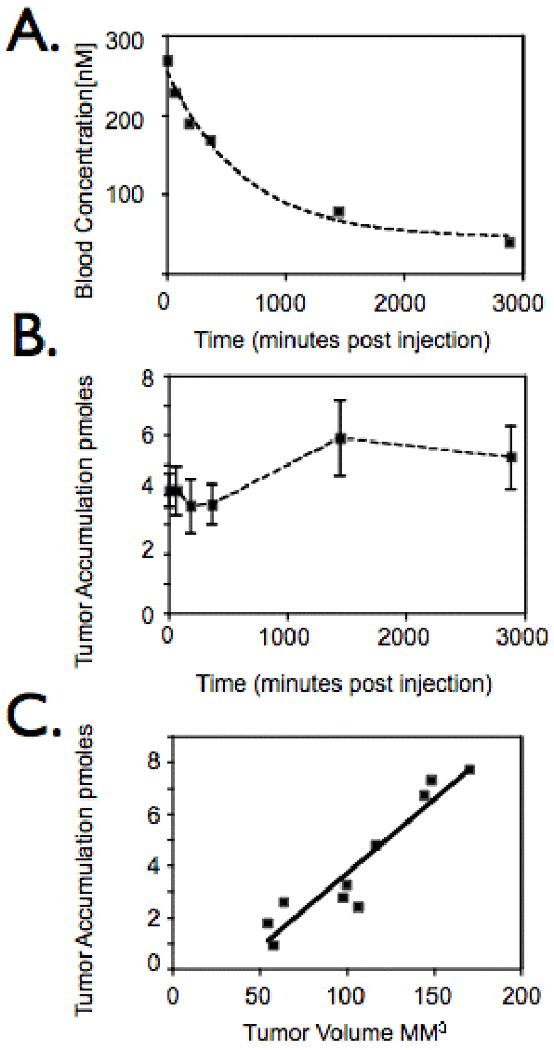
In vivo characterization of IPL-NP. A. Mice bearing tumors derived from LNCaP cells were injected with IPL-NP (20 mg/kg Fe) then blood analyzed for agent presence at indicated time points post injection. B. Time course of IPL-NP accumulation into LNCaP derived tumors. Mice bearing LNCaP derived tumors were injected with IPL-NP (20 mg/kg Fe) then imaged via FMT at 0,1,3,6,24, and 48 hours post injection. C. Mice bearing tumors of different volumes derived from LNCaP cells were injected with identical doses of IPL-NP (20 mg/kg Fe) then imaged via FMT.
Results
Identification of peptides
To facilitate the phage display selection we utilized HPN negative PC3 cells and stably transfected them to perform iterative positive and negative selections. Two transfected clones in particular had high levels of HPN mRNA expression by real time quantitative PCR when compared with parental PC3 cells (clone 27: 1,960 fold difference, clone 30: 967 fold difference). A total of 30 individual phage were randomly identified and selected for further analysis. Two of the 30 clones had identical sequences with each other and 3 other clones shared homology to form a consensus sequence, IPLXVPL (Fig. 1A). The 2 identical phage clones were shown to have nearly identical binding patterns as seen by heatmaps of ELISA analysis results (Fig. 1B- closed arrows). Additionally, peptides with similarity to the consensus sequence had the same binding profile (peptides 7, 21, 25). To confirm the ELISA results, phage corresponding to the sequence IPLVVPL were labeled with FITC (IPL-Φ) incubated with either HPN-PC3 or PC3 cells and analyzed via flow cytometry (Fig. 1C) and fluorescence microscopy (Fig. 1D). Using IPL-Φ, we were able image and to label 95.2% of HPN-PC3 cells 12 fold better than PC3 cells. In further validation experiments, IPL-F bound to HPN-PC3 cells and LNCap cells, which express HPN (Fig. 2A) whereas, PC3 cells and DU145 cells, which do not express HPN had background levels of IPL-F binding (Fig. 2A). In addition, IPL-Φ were able to compete with IPL-F for binding to HPN-PC3 cells with an IC50 of 1.4 ± 1.7 μM whereas ScP was unable to compete at the concentrations examined (Fig. 2B). Pre-incubation of HPN-PC3 cells with anti-HPN antibody abrogated IPL-F binding by 84.4% (Fig. 2B). Finally, synthetic IPLVVPL peptide (IPL-F) had an affinity of 190 ± 2.2 nM (mean ± SD) for HPN-PC3 cells whereas scrambled control peptide, ScP, exhibited negligible binding (Fig. 2C). Taken together, these experiments demonstrate specific binding of the identified peptide to the prostate cancer biomarker, HPN.
HPN targeted peptides and nanoparticles are able to identify human prostate cancer. Since IPL-F, IPL-NP, and IPL-Φ were all able to detect human prostate cancer in vitro, we next determined their specificity on human tissues samples. The binding of IPL-F was first tested on frozen tissue sections. The peptide was seen to bind specifically to the tumor glands, with adjacent benign glands showing no staining (Supplementary Figure). The results were further validated on a tissue microarray. Frozen tissue microarray consisting of 22 prostate samples (2 cores per case, 6 normal prostates and 5 prostate cancers) was constructed and used for in situ fluorescent histochemical analysis. IPL-F and IPL-NP were able to bind selectively to prostate cancer cells (Fig. 3A and 3C), staining 100% of the tumor cores and 0% of the control benign cores (Fig. 3 B and 3D). Staining was localized to the prostate tumor cells with the stromal cells showing basal staining. Control NP did not show any binding (data not shown).
In vivo imaging of HPN-expressing tumors
Conjugation of IPL-F to a model nanoparticle (IPL-NP) increased the fluorescent signal via FACs by >10 fold when compared to peptide alone, presumably due to multivalency effects (Fig. 4A). IPL-NP retained its specificity for HPN expressing cells, as binding to PC3 cells was 80 fold less than binding to HPN-PC3 cells, (Fig. 4A). To determine whether we could detect HPN expressing tumors in vivo, we used a xenograft model of prostate cancer with a PC3 cell derived tumor on the left flank and LNCaP (HPN positive) cell derived tumor, on the right flank (Fig. 4B). Following intravenous co-injection of IPL-NP and NP (untargeted control nanoparticle) fluorescence mediated tomography (FMT) images were obtained (Fig. 4B). HPN positive tumors accumulated 65 ± 3.1 nM IPL-NP whereas HPN negative tumors showed lower amounts (23 ± 1.6 nM; p= 0.0675 students t-test). The differences in tumoral accumulation were not due to differences in bulk tumor properties such as angiogenesis or tumor size since untargeted NP had a statistically identical accumulation between the two tumors (Fig. 4C). Moreover, the peptide sequence imparted in vivo HPN targeting to the nanoparticle since LNCap tumors had 21 ± 8.1 nM of NP, which is indistinguishable from NP accumulation in PC3 derived tumors. As part of the in vivo characterization of IPL-NP, we determined the blood half-life of IPL-NP to be 7.4 hours (R2 value of 0.99) (Fig. 5A). The time course of tumoral accumulation was assessed showing maximal signal at 24 hours with signal persisting past 48 hours (Fig. 5B). Finally, an important clinical question especially for early detection of tumors is determining the smallest size of tumors that can be detected. Using FMT imaging, we were able to detect 4.6 mm diameter prostate cancer (Fig. 5C). The correlation of tumoral accumulation of IPL-NP with tumor volume was linear with an R2 value of 0.89.
Discussion
Improving prostate cancer detection will ultimately lead to improving prostate cancer cure rates. Moreover, accurately quantifying prostate cancer burden could dramatically improve the ability to select appropriate candidates for active surveillance. Currently, prostate cancer detection relies on serum PSA and the digital rectal exam (22). Due to the fact that the normal prostate produces PSA and the high rates of BPH in the patient population at risk for prostate cancer, serum PSA is neither a sensitive nor specific biomarker (23). In fact, it has been argued that in the era of PSA screening, serum PSA is much more highly correlated with prostate volume than with the presence of prostate cancer (24). While several variations of serum PSA may improve its characteristics slightly (free PSA, PSA density), overall it is a relatively poor screening test (25).
The goal of this project was to develop targeted imaging agents against an emerging, potential new prostate cancer biomarker to improve prostate cancer detection. We choose HPN as a candidate target because it is expressed at high levels by prostate cancer cells (and HG-PIN) and not at all or at low levels in the non-malignant prostate (7-15). The fact that HPN is a cell surface protein and is absent or at low levels in BPH made it a particularly attractive candidate for further study. Additionally, HPN expression in other cancers including ovarian, breast, and renal has been documented (26-28). Using an iterative phage display selection approach, we identified a novel peptide (IPL) with both high affinity and high selectivity for HPN. This peptide when tested on human tissue sections, was seen to bind specifically to the tumor glands (characterized by small glands and large nuclei), with the adjacent benign glands (large glands with smaller nuclei) showing little or no staining. The stromal compartment showed minimal staining.
In our view, the ideal prostate cancer screening modality incorporates imaging, because imaging is non-invasive, repeatable, and provides both binary information (cancer present versus cancer absent) and anatomic information useful in making treatment decisions. Therefore, we have developed a noninvasive approach for imaging HPN expression and prostate cancer. Incorporating a C-terminal extension onto IPL allowed fluorescein attachment and nanoparticle conjugation, ideal for increasing the circulation time of the agent. As expected, nanoparticle conjugation (at 11 peptides to one nanoparticle) improved avidity, as demonstrated by a > 10 fold increase in fluorescent signal compared with peptide alone. Importantly, the fluorescent IPL-NP was able to distinguish between a HPN-expressing LNCaP xenograft and a non-HPN expressing PC-3 xenograft in vivo. The agent appeared to be selective for human prostate cancer samples tested and was absent in the normal prostate sections.
In conclusion, we have identified and developed a novel imaging agent (IPL-NP), which binds HPN with high affinity. We have demonstrated, with both an in vivo model and with in situ histochemical analysis on patient tissues, its potential as an imaging agent for prostate cancer. Our next step is to investigate the suitability of IPL-based peptides for human use. We envision using similar nanoparticle platforms as those used in clinical trials, as the nanoparticles used in this study have similar properties to those used in the clinic (29). Such a HPN-targeted imaging agent would be useful in all stages of prostate cancer, from biopsy-targeting (pre-diagnosis), to the delineation of non-localized disease to identification of disease recurrence post-therapy, and would make a significant impact on the diagnosis and treatment of this lethal disease.
Supplementary Material
Supplementary Figure 1: Binding of the Hepsin binding peptide IPL-F to human tissue. The binding of the peptide to cancer and benign tissue is shown in panels A., C., and E. (arrow heads indicate cancer glands), and panels B., D., and F. respectively. Panel C shows adjacent benign and cancer glands (Original magnification, 60×).
Acknowledgments
Funding for this work was provided by U54-CA119349 (RW), P50-CA86355 (RW and KAK), R24-CA92782 (RW), AdmeTech (KAK), P50-CA090381 (MAR), R01AG21404 (MAR), and the DOD Prostate Cancer Program PC- 050965 (SRS). The authors are grateful to Dr. Nikolay Sergeyev for nanoparticle synthesis, Dr Lee Josephson for many helpful discussions, Timur Shtatland for HPN metaanalysis, Drs. Saravana Dhanasekaran and Arul Chinnaiyan for providing the HPN PCDNA3.1 clone, to Martina Storz-Schweizer for her help with the frozen array construction and to Dr. Sven Perner for his role in the pathological evaluation of the in situ histochemical analysis.
References
- 1.Jemal A, Siegel R, Ward E, Murray T, Xu J, Thun MJ. Cancer statistics, 2007. CA Cancer J Clin. 2007;57:43–66. doi: 10.3322/canjclin.57.1.43. [DOI] [PubMed] [Google Scholar]
- 2.Bill-Axelson A, Holmberg L, Ruutu M, et al. Radical prostatectomy versus watchful waiting in early prostate cancer. N Engl J Med. 2005;352:1977–84. doi: 10.1056/NEJMoa043739. [DOI] [PubMed] [Google Scholar]
- 3.D'Amico AV, Whittington R, Malkowicz SB, et al. Biochemical outcome after radical prostatectomy, external beam radiation therapy, or interstitial radiation therapy for clinically localized prostate cancer. JAMA. 1998;280:969–74. doi: 10.1001/jama.280.11.969. [DOI] [PubMed] [Google Scholar]
- 4.Sakr WA, Haas GP, Cassin BF, Pontes JE, Crissman JD. The frequency of carcinoma and intraepithelial neoplasia of the prostate in young male patients. J Urol. 1993;150:379–85. doi: 10.1016/s0022-5347(17)35487-3. [DOI] [PubMed] [Google Scholar]
- 5.Thompson IM, Pauler DK, Goodman PJ, et al. Prevalence of prostate cancer among men with a prostate-specific antigen level < or =4.0 ng per milliliter. N Engl J Med. 2004;350:2239–46. doi: 10.1056/NEJMoa031918. [DOI] [PubMed] [Google Scholar]
- 6.Woolf SH. Screening for prostate cancer with prostate-specific antigen. An examination of the evidence. N Engl J Med. 1995;333:1401–5. doi: 10.1056/NEJM199511233332107. [DOI] [PubMed] [Google Scholar]
- 7.Dhanasekaran SM, Barrette TR, Ghosh D, et al. Delineation of prognostic biomarkers in prostate cancer. Nature. 2001;412:822–6. doi: 10.1038/35090585. [DOI] [PubMed] [Google Scholar]
- 8.LaTulippe E, Satagopan J, Smith A, et al. Comprehensive gene expression analysis of prostate cancer reveals distinct transcriptional programs associated with metastatic disease. Cancer Res. 2002;62:4499–506. [PubMed] [Google Scholar]
- 9.Luo J, Duggan DJ, Chen Y, et al. Human prostate cancer and benign prostatic hyperplasia: molecular dissection by gene expression profiling. Cancer Res. 2001;61:4683–8. [PubMed] [Google Scholar]
- 10.Luo JH, Yu YP, Cieply K, et al. Gene expression analysis of prostate cancers. Mol Carcinog. 2002;33:25–35. doi: 10.1002/mc.10018. [DOI] [PubMed] [Google Scholar]
- 11.Magee JA, Araki T, Patil S, et al. Expression profiling reveals hepsin overexpression in prostate cancer. Cancer Res. 2001;61:5692–6. [PubMed] [Google Scholar]
- 12.Nelson PS. Identifying immunotherapeutic targets for prostate carcinoma through the analysis of gene expression profiles. Ann N Y Acad Sci. 2002;975:232–46. doi: 10.1111/j.1749-6632.2002.tb05955.x. [DOI] [PubMed] [Google Scholar]
- 13.Ramaswamy S, Tamayo P, Rifkin R, et al. Multiclass cancer diagnosis using tumor gene expression signatures. Proc Natl Acad Sci U S A. 2001;98:15149–54. doi: 10.1073/pnas.211566398. [DOI] [PMC free article] [PubMed] [Google Scholar]
- 14.Singh D, Febbo PG, Ross K, et al. Gene expression correlates of clinical prostate cancer behavior. Cancer Cell. 2002;1:203–9. doi: 10.1016/s1535-6108(02)00030-2. [DOI] [PubMed] [Google Scholar]
- 15.Welsh JB, Sapinoso LM, Su AI, et al. Analysis of gene expression identifies candidate markers and pharmacological targets in prostate cancer. Cancer Res. 2001;61:5974–8. [PubMed] [Google Scholar]
- 16.Srikantan V, Valladares M, Rhim JS, Moul JW, Srivastava S. HEPSIN inhibits cell growth/invasion in prostate cancer cells. Cancer Res. 2002;62:6812–6. [PubMed] [Google Scholar]
- 17.Kelly KA, Jones DA. Isolation of a colon tumor specific binding peptide using phage display selection. Neoplasia. 2003;5:437–44. doi: 10.1016/s1476-5586(03)80046-5. [DOI] [PMC free article] [PubMed] [Google Scholar]
- 18.Kelly KA, Allport JR, Tsourkas A, Shinde-Patil VR, Josephson L, Weissleder R. Detection of vascular adhesion molecule-1 expression using a novel multimodal nanoparticle. Circ Res. 2005;96:327–36. doi: 10.1161/01.RES.0000155722.17881.dd. [DOI] [PubMed] [Google Scholar]
- 19.Kelly KA, Waterman P, Weissleder R. In vivo imaging of molecularly targeted phage. Neoplasia. 2006;8:1011–8. doi: 10.1593/neo.06610. [DOI] [PMC free article] [PubMed] [Google Scholar]
- 20.Vasioukhin V. Hepsin paradox reveals unexpected complexity of metastatic process. Cell Cycle. 2004;3:1394–7. doi: 10.4161/cc.3.11.1273. [DOI] [PubMed] [Google Scholar]
- 21.Montet X, Figueiredo JL, Alencar H, Ntziachristos V, Mahmood U, Weissleder R. Tomographic fluorescence imaging of tumor vascular volume in mice. Radiology. 2007;242:751–8. doi: 10.1148/radiol.2423052065. [DOI] [PubMed] [Google Scholar]
- 22.Catalona WJ, Richie JP, Ahmann FR, et al. Comparison of digital rectal examination and serum prostate specific antigen in the early detection of prostate cancer: results of a multicenter clinical trial of 6,630 men. J Urol. 1994;151:1283–90. doi: 10.1016/s0022-5347(17)35233-3. [DOI] [PubMed] [Google Scholar]
- 23.Gann PH, Hennekens CH, Stampfer MJ. A prospective evaluation of plasma prostate-specific antigen for detection of prostatic cancer. JAMA. 1995;273:289–94. [PubMed] [Google Scholar]
- 24.Stamey TA, Caldwell M, McNeal JE, Nolley R, Hemenez M, Downs J. The prostate specific antigen era in the United States is over for prostate cancer: what happened in the last 20 years? J Urol. 2004;172:1297–301. doi: 10.1097/01.ju.0000139993.51181.5d. [DOI] [PubMed] [Google Scholar]
- 25.Polascik TJ, Oesterling JE, Partin AW. Prostate specific antigen: a decade of discovery--what we have learned and where we are going. J Urol. 1999;162:293–306. doi: 10.1016/s0022-5347(05)68543-6. [DOI] [PubMed] [Google Scholar]
- 26.Roemer A, Schwettmann L, Jung M, et al. The membrane proteases adams and hepsin are differentially expressed in renal cell carcinoma. Are they potential tumor markers? J Urol. 2004;172:2162–6. doi: 10.1097/01.ju.0000144602.01322.49. [DOI] [PubMed] [Google Scholar]
- 27.Tanimoto H, Yan Y, Clarke J, et al. Hepsin, a cell surface serine protease identified in hepatoma cells, is overexpressed in ovarian cancer. Cancer Res. 1997;57:2884–7. [PubMed] [Google Scholar]
- 28.Tozlu S, Girault I, Vacher S, et al. Identification of novel genes that co-cluster with estrogen receptor alpha in breast tumor biopsy specimens, using a large-scale real-time reverse transcription-PCR approach. Endocr Relat Cancer. 2006;13:1109–20. doi: 10.1677/erc.1.01120. [DOI] [PubMed] [Google Scholar]
- 29.Harisinghani MG, Barentsz J, Hahn PF, et al. Noninvasive detection of clinically occult lymph-node metastases in prostate cancer. N Engl J Med. 2003;348:2491–9. doi: 10.1056/NEJMoa022749. [DOI] [PubMed] [Google Scholar]
Associated Data
This section collects any data citations, data availability statements, or supplementary materials included in this article.
Supplementary Materials
Supplementary Figure 1: Binding of the Hepsin binding peptide IPL-F to human tissue. The binding of the peptide to cancer and benign tissue is shown in panels A., C., and E. (arrow heads indicate cancer glands), and panels B., D., and F. respectively. Panel C shows adjacent benign and cancer glands (Original magnification, 60×).