

Abstract
GABRA2and GABRG1, which encode the α2 and γ1 subunits, respectively, of the GABA-A receptor, are located in a cluster on chromosome 4p. The GABRA2 locus has been found to be associated with alcohol dependence (AD) in several studies, but no functional variant that can account for this association has been identified. In order to understand the reported associations, we sought to understand LD patterns and haplotype structure of these genes. With close intergenic distance, ~90 kb, it was anticipated some markers might show intergenic LD. Variation in 13-SNP haplotype block structure was observed in 5 different populations: European American, African American, Chinese [Han and Thai], Thai, and Hmong. In Hmong, a 280 kb region of considerably higher LD spans the intergenic region, whereas in other populations, there were two or more LD blocks cross this region. These findings may aid in understanding genetic association of this locus with alcohol dependence in several populations.
Keywords: Linkage disequilibrium, alcohol dependence, GABRA2, GABRG1, Haplotype
Introduction
γ-aminobutyric acid (GABA) is the major inhibitory neurotransmitter in the human brain. It is widely involved in the modulation of neurotransmission, particularly via regulation of neuronal excitability [1; 2]. GABA exerts its effects through interaction with GABA receptors. Functionally, fast synaptic inhibition in the mammalian CNS is mediated largely by activation of the γ-amino butyric acid type A (GABAA) receptors [3], a ligand-gated receptor that is expressed in many regions of mammalian brain. The working receptor is composed of five protein subunits that form a chloride channel that remains closed until it binds its ligand. Each subunit is a long chain polypeptide with four putative α-helical cylinder domains embedded within the cell membrane, with the N-terminal end being extracellular [4; 5]. The 19 distinct GABAA receptor subunits have been classified into α, β, γ, δ, ε, π, and ρ types [6]. Two α and two β subunits are typically part of the pentameric assemblies of GABAA receptors. The particular subunit composition varies widely among brain regions and species. GABA binds specifically to the recognition site in the GABAA receptor and forms a chloride ion-selective channel that mediates neuronal membrane potential [7; 8; 9]. Other pharmacologically important molecules, for example, barbiturates, benzodiazepines, ethanol, and the anesthetic steroids, also interact with these receptors, either directly or indirectly.
Among the 19 distinct subunits of mammalian GABAA receptors identified to date [6], the γ-aminobutyric acid α-2 receptor (encoded by GABRA2) [OMIM 137140] is the subtype that has received the greatest attention in relation to alcohol dependence risk. Based on its physiological role and its direct interactions with ethanol [10], as well as evidence from genetic linkage studies, it was suggested that the gene encoding GABAA receptor α-2 subunit should be considered a candidate locus for influencing risk for alcohol dependence [11; 12] [13]. Results from a genomewide linkage scan by the Collaborative Study on the Genetics of Alcoholism (COGA) showed suggestive linkage to alcohol dependence in the region of the GABA receptor gene cluster on chromosome 4p13-12. This region contains the GABRG1, GABRA2, GABRA4, and GABRB1 genes, encoding γ-1, α-2, α-4, and β1 subunits of the GABAA receptor, respectively. Association studies considering some of these loci indicated that a genetic predisposition to alcohol dependence is related to polymorphic variation at or near GABRA2 [14; 15; 16; 17]. Edenberg et al. 2004 [14] reported significant association between SNPs in the GABRA2 flanking genes and alcohol dependence (AD). They found that the region of strongest association with AD extended from intron 3 to 58 kb beyond the 3′ end of the gene, spanning 164 kb. This study included 31 SNPs within or closely flanking GABRA2 that were significantly associated with alcohol dependence. They also found that all consecutive three-SNP haplotypes within GABRA2 -- 1 of the 5 haplotypes at the 5′ end of the gene, and all 43 of the haplotypes starting within exon 3 and extending to the 3′ end of the gene -- were significantly associated with AD. The association was confirmed by Covault et al. [15], who compared allele frequencies of 10 GABRA2 SNPs spanning the coding region in European American (EA) controls and subjects with AD. The strongest evidence of association was shown across a region encompassed by seven of the 10 SNPs, from rs279837 in intron 3 through rs567926 in the 3′ downstream region. This location provided the best evidence for association in all studies published to date. Subsequent studies have shown association of these GABRA2 SNPs and alcohol dependence in populations of European and American ancestry; including Russians, Germans, Finns, and American Indians [16; 17; 18; 19]. These replicated findings established the importance of GABRA2 variation – or variation at loci mapping close enough to GABRA2 to be in linkage disequilibrium (LD) with associated markers -- in discovering genetic risks for AD.
GABRA2 spans approximately 140 kb. There are 10 transcribed exons present in human GABRA2 mRNA (NM_000807), with four major isoforms, consisting of combinations of two alternative 5′ and 3′ exons caused by alternative splicing and (potentially) alternative promoter use [20]. LD data from previous studies have employed sets of markers that extended only through the 3′ end of the GABRA2 gene; these data showed strong pairwise LD between the last two markers at the 3′ end of the haplotype block of each study, consistent with the possibility of an extended LD block in the 3′ direction [15; 16; 17; 18]. Across the intergenic region in the 3′ direction, the gene encoding the γ-1 subunit (GABRG1) of the GABAA receptor is located. This gene spans approximately 83kb and consists of 9 exons [21]. A consistent pattern of LD was previously constructed in EAs; this study [19] also showed an extended (193-kb) LD region, with D′ 0.6–1.0. This region of LD spans from rs279867 in GABRA2 intron 6 across the intergenic region to rs1391168, which located in intron 1 of GABRG1 [19].
We analyzed 13 SNPs, located either within these genes or in the intergenic region. We aimed to provide sufficient SNP density such that our SNP set would be informative for most other non-genotyped SNPs that map to the region (Figure 1). To evaluate whether the effect of differing genetic background among populations with different ethnicities is reflected in distinct patterns of LD blocks, six populations were included: European American, African American, and Han Chinese American samples from the US, and Hmong, Thai, and Chinese Thai from Thailand.
Figure 1.
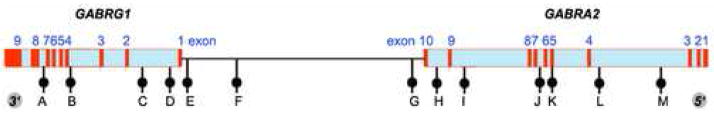
location of SNP markers genotyped across GABRG1 and GABRA2 in GABA cluster on chromosome 4p13-1. The order of the genes is shown from telomere to centromere (distances not to scale)
In this study, we consider the LD relationships within and between GABRA2 and GABRG1, to improve our understanding of the previously reported associations between GABRA2 and AD. The extent of LD in the populations of African, European, and Chinese descents, represent by African American, European American, and Chinese American (USC) presented in this study are comparable to those observed in the YRI, CEU, and CHB populations in the International HapMap projects. These data are complementary; some of our samples of unrelated subjects are larger than those included in HapMap and although the samples are of comparable ethnicity they are not identical. Understanding LD patterns and the GABRA2/GABRG1 haplotype structure by extending it to multiple populations also will facilitate inferring the evolutionary history of any variant that increases AD risk.
RESULTS
Allele frequency differences between populations
Allele frequencies in each population are presented in Table 1. The genotype distributions of all SNPs were consistent with Hardy-Weinberg equilibrium expectations, in all populations.
Table 1.
Location and prevalence of allele frequencies of GABRG1 and GABRA2 polymorphisms
| Marker information | Populations | |||||||||
|---|---|---|---|---|---|---|---|---|---|---|
|
| ||||||||||
| Marker | Position | gene | NT | THC N=38 | HM N=48 | THT N=59 | AA N=48 | USC N=100 | EA N=160 | |
| A | rs1497571 | 45,900,178 | GABRG1 intron 7 | [C/T] | 0.66/0.34 | 0.73/0.27 | 0.62/0.38 | 0.38/0.62 | 0.57/0.43 | 0.56/0.44 |
| B | rs2350438 | 45,912,197 | GABRG1 intron 3 | [C/T] | 0.66/0.34 | 0.72/0.28 | 0.62/0.38 | 0.37/0.63 | 0.57/0.43 | 0.56/0.44 |
| C | rs1391166 | 45,946,795 | GABRG1 intron 1 | [A/T] | 0.39/0.61 | 0.28/0.72 | 0.35/0.65 | 0.77/0.23 | 0.45/0.55 | 0.50/0.50 |
| D | rs10938426 | 45,959,163 | GABRG1 intron 1 | [A/G] | 0.66/0.34 | 0.72/0.28 | 0.59/0.41 | 0.30/0.70 | 0.56/0.44 | 0.51/0.49 |
| E | rs7654165 | 45,967,995 | Intergenic | [C/T] | 0.62/0.38 | 0.73/0.27 | 0.64/0.36 | 0.30/0.70 | 0.55/0.45 | 0.53/0.47 |
| F | rs10033451 | 45,993,260 | Intergenic | [C/T] | 0.28/0.72 | 0.24/0.76 | 0.34/0.66 | 0.29/0.71 | 0.38/0.62 | 0.44/0.56 |
| G | rs567926 | 46,082,697 | Intergenic | [A/G] | 0.46/0.54 | 0.43/0.57 | 0.49/0.51 | 0.81/0.19 | 0.54/0.46 | 0.61/0.39 |
| H | rs534459 | 46,097,733 | GABRA2 intron 9 | [A/G] | 0.50/0.50 | 0.55/0.45 | 0.48/0.52 | 0.71/0.29 | 0.46/0.54 | 0.39/0.61 |
| I | rs529826 | 46,112,580 | GABRA2 intron 8 | [C/T] | 0.48/0.52 | 0.55/0.45 | 0.47/0.53 | 0.70/0.30 | 0.42/0.58 | 0.39/0.61 |
| J | rs279869 | 46,148,923 | GABRA2 intron 6 | [G/T] | 0.50/0.50 | 0.43/0.57 | 0.48/0.52 | 0.28/0.72 | 0.50/0.50 | 0.60/0.40 |
| K | rs279858 | 46,155,521 | GABRA2 exon 5(Synonymous) | [C/T] | 0.48/0.52 | 0.57/0.43 | 0.52/0.48 | 0.19/0.81 | 0.53/0.47 | 0.39/0.61 |
| L | rs279837 | 46,180,251 | GABRA2 intron 3 | [A/G] | 0.48/0.52 | 0.36/0.64 | 0.45/0.55 | 0.78/0.22 | 0.44/0.56 | 0.61/0.39 |
| M | rs9291283 | 46,212,761 | GABRA2 intron 3 | [A/G] | 0.13/0.87 | 0.18/0.82 | 0.17/0.83 | 0.33/0.67 | 0.04/0.96 | 0.26/0.74 |
Position is given according to the numbering in Genbank database entry NT_006238 (Homo sapiens chromosome 4 genomic contig, reference assembly).
NT represents nucleotide change from allele 1, Genbank NT_006238 strand, to allele 2. Both are presented in the parenthesis [allele1/allele2].
Abbreviations: THC=Chinese Thai, HM= Hmong, THT=Thai, AA=African American, USC=Chinese American, EA=European American
Analysis of LD and Tagging SNPs
LD and haplotype block structure results are summarized in Figure 2. Blocks were defined by LD analysis function and the confidence-interval method [22; 23; 24] selected within the parameter list. In the HM population, high LD (D′ > 0.85) extended from rs1497571 in intron 7 of GABRG1 to rs279837 in intron 3 of GABRA2, a 280 kb segment, whereas in other populations, there were two or more LD blocks across this region. The LD block boundary observed in other populations corresponds to lower D′ between rs10033451 and rs567926, which are located 89 kb apart in an intergenic region. Based on the SNP tagging function in HAPLOVIEW, we determined that the largest number of htSNPs required was seven, in the AA population, whereas the smallest number required was three, in the HM population (Figure 2).
Figure 2.

Comparisons of LD structure and htSNPs over the GABRG1/GABRA2 region on chromosome 4p13–12 across 5 different ancestral populations. Blue marks represent htSNPs shown in each population. Some markers with>25% missing genotypes are excluded as they are not informative for haplotype block definition
(a) EA = European American
(b) AA = African American
(c) USC = Chinese American
(d) THC = Chinese Thai
(e) THT = Thai
(f) HM = Hmong
Haplotype frequencies
Haplotype frequencies (for those >0.05) are summarized in Table 2. The number of common haplotypes in populations varied between 4 (HM) and 8 (AA). Haplotype diversity also varied among populations. Four common haplotypes in the HM population accounted for 88% of the total information of all haplotypes. For the other populations, the set of population-specific common haplotypes represented 62–77% of the total information.
Table 2.
Distribution of common haplotype among population: 13 SNPs (A-M)
| Haplotype; SNPs A-M | THC | HM | THT | AA | USC | EA |
|---|---|---|---|---|---|---|
| C-C-T-A-C-T-A-G-T-G-T-A-G | 0.27 | 0.35 | 0.25 | 0.09 | 0.3 | 0.2 |
| T-T-T-A-C-T-A-G-T-G-T-A-G | 0.16 | |||||
| C-C-A-G-T-C-A-G-T-G-T-A-G | 0.08 | |||||
| C-C-A-G-T-C-G-A-C-T-C-G-A | 0.08 | |||||
| T-T-A-G-T-C-G-A-C-T-C-G-G | 0.07 | 0.24 | 0.12 | 0.21 | 0.08 | |
| C-C-A-G-T-C-G-A-C-T-C-G-G | 0.07 | |||||
| T-T-A-G-T-C-G-A-C-T-C-G-A | 0.05 | 0.06 | 0.05 | |||
| C-C-T-A-C-T-A-A-C-T-T-A-A | 0.06 | |||||
| C-C-T-A-C-T-A-A-C-T-T-A-G | 0.05 | |||||
| C-C-T-A-C-T-A-G-T-G-T-G-G | 0.05 | |||||
| C-C-T-A-C-T-G-A-C-T-C-G-A | 0.17 | 0.07 | ||||
| C-C-T-A-C-T-G-A-C-T-C-G-G | 0.14 | 0.12 | 0.11 | 0.14 | ||
| C-C-T-A-C-T-G-G-T-G-T-A-G | 0.06 | |||||
| T-T-A-G-T-C-A-G-T-G-T-A-G | 0.06 | 0.06 | 0.05 | 0.07 | ||
| T-T-A-G-T-T-A-A-C-T-T-A-G | 0.15 | |||||
| T-T-A-G-T-T-A-G-T-G-T-A-G | 0.06 | |||||
| T-T-A-G-T-T-G-A-C-T-C-G-G | 0.08 | |||||
|
| ||||||
| Total | 0.68 | 0.88 | 0.66 | 0.52 | 0.77 | 0.72 |
In most of the populations studied, there are two major haplotype blocks. Block I includes SNPs A-F, and spans a region of 93 kb, and block II includes SNPs G-L and extends 98 kb. The LD break (between these blocks) observed in most populations corresponds to lower D′ between SNP F and G, which are located 89 kb apart in an intergenic region. The populations that showed different LD structure were the HM, where there was a single block spanning both of these blocks (i.e., SNPs A through L); and the AA population, where we observed four main blocks. In the AAs, block I was divided into Ia (comprised of SNPs A and B) and Ib (SNPs D-F), and block II was divided into blocks IIa (SNPs H and J) and IIb (SNPs K and L), as shown in Figure 2. The EAs and THT also showed a small difference in block definition in which smaller blocks were defined rather than the two main haplotype blocks. Three main haplotype blocks were observed in these populations. The definition of blocks in EAs is as seen in AAs where LD breaks between SNP B and C and creates sub-block Ia and Ib; whereas block I in THT were divided into block Ia and Ib by LD breaks between SNP C and D (Figure 2a and 2e).
Since it was previously reported that in EAs the LD block spanning from SNPs G-L contains haplotypes that are associated with alcohol dependence [15], the two major haplotype blocks (Block Ib and Block II) examined in this population across GABRA2 and GABRG1 in this study were used as a standard to compare haplotype frequencies among populations. Three haplotype blocks were reconstructed in the EA population. We analyzed frequencies of the 4-SNP haplotypes (block Ib) and the 6-SNP haplotype (block II) compared to other populations. Block I, with SNPs C-F, covers part of the 5′ region, a 46-kb segment of the GABRG1 gene; and Block II, comprised of SNPs G-L, which spans the 5′ flanking region through exon 3 of the GABRA2 gene. Block II corresponds to that identified in a previous study [15] starting at rs567926 (SNP G) and extending to rs279837 (SNP L), covering a 97 kb region.
Two major block I haplotypes, T-A-C-T and A-G-T-C, were observed in all populations except AA (Table 3). These two common haplotypes accounted for 78% (THC), 97% (HM), 79% (THT), 93% (USC) and 86% (EA) of those observed. In AA, however, the most common haplotypes were T-A-C-T and A-G-T-T (Table 3). For block II (six-locus LD analysis for SNPs G-L), haplotypes A-G-T-G-T-A and G-A-C-T-C-G represented the common haplotype in other populations with 83–96% of chromosomes, there was only 45% (26% and 19% for A-G-T-G-T-A and G-A-C-T-C-G respectively) in African Americans. The haplotype A-A-C-T-T-A was uniquely found in African American with 48% of total chromosomes.
Table 3.
Haplotype frequencies reconstructed by comparing Block Ib (SNP C-D-E-F) in European Americans to other populations
| Haplotype SNP C-D-E-F | THC | HM | THT | AA | USC | EA |
|---|---|---|---|---|---|---|
| T-A-C-T | 0.56 | 0.73 | 0.53 | 0.26 | 0.55 | 0.46 |
| A-G-T-C | 0.22 | 0.24 | 0.26 | 0.29 | 0.38 | 0.40 |
| T-G-C-T | 0.05 | |||||
| A-G-T-T | 0.16 | 0.03 | 0.07 | 0.40 | 0.07 | |
| T-G-T-C | 0.06 | |||||
|
| ||||||
| Total | 0.94 | 1.00 | 0.92 | 0.95 | 1.00 | 0.91 |
Discussion
With methodological developments in high-throughput genotyping, and the development of large-scale genotyping projects such as the international HapMap project, huge quantities of data are being generated making it possible to measure correlations between SNP genotypes and creating better marker maps for association studies. Improved understanding of underlying LD-based mapping approaches has been helpful in elucidating the relationship between common genetic variation and heritable risk for common diseases [25; 26; 27]. Polygenic and oligogenic effects are considered to play important roles in influencing complex traits and behaviors. Further, it is likely that the genetic architecture of common, complex traits will differ, at least to some extent, among major population groups. To understand the genetic basis of these traits, we need to understand linkage disequilibrium profiles and haplotype diversity in genomic regions of interest in multiple populations.
In the present study, we focused on two adjacent GABAA receptor subunit genes, one of which has been associated to risk for alcohol dependence in several previous studies. To define extensively linkage disequilibrium in the chromosomal region, more SNPs covering the GABRG1 gene located telomeric to GABRA2 on chromosome 4p were studied. This made it possible to investigate whether these two genes are located within the same LD block, and, more broadly, to ascertain the possibility that the effect observed at GABRA2 could actually be mediated through a variant mapped to GABRG1. We conclude that this is in fact the case, and associations observed with GABRA2 might be attributable to functional genetic variation at the GABRG1 locus, or that or there may be disease-related variants at both loci; this may facilitate our understanding of reported associations between GABRA2 polymorphisms and AD, and permit a more informed search for the functional variant or variants underlying this association –a search that must now extend into the intergenic region and the GABRG1 locus. It is not known how well genetic information from the four HapMap populations (CEU, YRI, JPN, and CHB) represents that of other populations around the world; it is thus useful to answer this question directly, especially for loci of great interest.
Allele frequencies for the 13 SNPs of GABRA2 and GABRG1 that were genotyped in this study in six different populations from three continents provide a measure of allele distribution and different LD patterns among populations. These results should allow investigators studying populations similar to those characterized herein, or admixed population derivatives, to explore association between these genes and substance dependence and other phenotypes.
This present study provides the first comprehensive analysis of patterns of LD spanning these two important genes. In general, LD block size might vary between different populations in which the degree of admixture and differences in ancestries are found. Thus, from generation to generation, differences in LD between markers from the initial populations due to LD decay can be observed by changes in LD block and haplotype structure and long stretches of LD that can reflect haplotype diversity [28; 29]. That is clearly the case for these loci in the populations studied. We have systematically analyzed SNPs covering the range of GABRA2 and GABRG1 in the GABA receptor cluster on human chromosome 4p, estimating haplotypes in a total of 453 unrelated healthy individuals. The more complex LD structure found in the African American population is consistent with what is known about the population’s history, i.e., that it is older than Asian or European populations, which show less complex LD patterns. This is consistent with the observation of Gabriel et al [22] that haplotype blocks found in African populations showed a set of shorter genomic LD blocks than samples from Europe and Asia. While haplotype blocks defined in African Americans indicated the presence of 4 main LD regions spanning all 13 of the SNPs examined, we found that Chinese populations both in Thailand and in the US, and the Thai population were characterized by a two-block structure in this genomic region. In contrast, the Hmong population, which is an isolated minority Hill Tribe dwelling in the northern part of Thailand, was found to have a unique long-ranged haplotype block structure with a single block encompassing the two blocks observed in the others. This interesting finding in the Hmong population may be attributed to the occurrence of recent selection that can be reflected in long-range haplotypes [30]. Alternatively, the Hmong population may be relatively new or have undergone a recent bottleneck[31]. A small number of htSNPs are generally sufficient to capture most of haplotype structure in high LD regions [29; 32]; consistent with this expectation, only three htSNPs were required to capture the haplotype block diversity in the Hmong population, whereas four htSNPs were necessary for Chinese Thais (THC), five for European American and Chinese American (USC), and six for Thais (THT). In the AA population, there were four haplotype blocks in the same region; seven SNPs were sufficient to capture most of the genetic information of the total 13 SNPs. As can be seen in Figure 2, rs9291283 (SNP M) showed very low LD with the other SNPs examined, falling outside the limits of the haplotype block. Thus, it was tagged as a htSNPs for all groups.
LD analysis based on HapMap data with a denser SNP map (Figure 3) shows that LD definitions in our sample are consistent with those based on well-characterized HapMap populations. The LD regions observed in this study; European American, African American, Chinese American (USC), are similar to those observed in CEU, YRI, and CHB from the HapMap project, respectively (Figure 3); whereas the LD pattern in our Thai populations, compared to HapMap CHB population, is slightly different in Thais (THT) and Chinese Thais (THC) and very different in the Hmong population. This suggests a degree of genetic differentiation among these populations. The Thai population may have unique genetic characteristics, especially the minority Hmong population (recruited in Thailand but present in other Asian countries, including China and Laos, as well).
Figure 3.
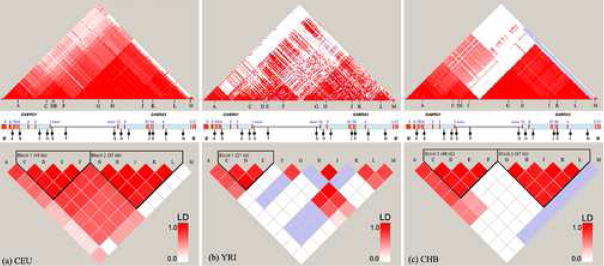
LD patterns computed based on genotype data from the HapMap CEU, YRI, and CHB populations, for 11 SNPs used in our study. Note that the two SNPs unavailable in HapMap, rs2350438 and rs529826, are not included.
Because each population has its own evolutionary history in which distinct allele frequencies, LD patterns, and haplotype structures can develop, a number of studies show that htSNPs must be defined within specific populations to identify optimal sets of marker for association studies [33; 34; 35]. Previously, GABRA2 haplotype structure was reported only in EA, AA, and Russian populations [15; 16; 19]; the present study documents LD patterns and haplotypes in three different Asian populations. As shown in European Americans by Covault et al.[15], seven markers spanning the GABRA2 gene defined an LD block associated with AD. Our study, which used six of those seven markers (we omitted rs279844), also shows a haplotype block defined by SNPs G (rs567926) to L (rs279837) that confirms the same region of strong LD in European Americans.
Haplotype frequencies in both LD blocks found in African Americans were uniquely different from those observed in other populations. In the Hmong population, we observed a small number of 13-SNP haplotype patterns indicative of low diversity, commonly found in an isolated population.
In the analysis of the 4-SNP (C-F) and 6-SNP (G-L) haplotypes, the two haplotype blocks observed in EAs differed from those in AAs. Specifically, the 6-SNP haplotype defined by SNPs G-L identified two complementary common haplotypes, A-G-T-G-T-A and G-A-C-T-C-G, as reported by Covault et al. [15], which together accounted for 92.8% of chromosomes (in the control sample), represented 96% of chromosomes in the European American, 90% in the Hmong, 84% in the Thai (THT) and Chinese American (USC), 83% in the Chinese Thai (THC), and interestingly, only 45% in the African American populations. The African American population showed a specific haplotype, A-A-C-T-T-A, which was not observed in the other populations. In the case of both the 4-SNP and 6-SNP haplotypes, only one recombination event is required to explain the presence of the third unique but common haplotype in the AA sample. The lack of these two common haplotypes in non-African populations may be explained by one of two most likely scenarios: (1) The recombination events took place in Africa after humans migrated out of Africa and subsequently rose to high frequency either from genetic drift or positive selection. (2) The recombination events predate migrations out of Africa, but due to a bottleneck effect, were not represented in founding populations in either Europe or Asia, or were present at such low frequencies that they were lost through genetic drift.
Only small differences were observed between haplotype frequencies in European American and the Asian populations. Further, no significant differences were found in haplotype frequencies between any two Asian groups except in comparisons involving the Hmong.
In conclusion, this study presents patterns of specific htSNPs and LD block structure in six different populations: European American, African American, Chinese American and three from Asia (i.e., Thai, Chinese Thai and Hmong). LD extended from most of the GABRA2 gene through the GABRG1 locus in the same GABAA cluster region on chromosome 4p, suggesting the possibility of association (and interaction) of both of these two genes with alcohol dependence. Differences in genetic architecture observed in these populations may help to define the physical and genetics regions of GABRG1 and GABRA2 that contains an as yet unidentified alcohol dependence-related functional change.
Materials and methods
Populations
A total of 450 unrelated subjects were included in this study, from Thailand and The United States. The study sample of Thai populations was recruited as adult blood donors aged 18 years and older from the Thai Red Cross. Only individuals who reported that all four grandparents were of either Thai (THT) or Chinese Thai(THC) ethnicity were included, resulting in panels of 56 THTs and 38 THCs. Forty-eight subjects of Hmong (HM) descent were recruited from a hill tribe population near Chiang Mai, Thailand. Related subjects were identified and excluded based on a ML-Relate analysis [36], as described elsewhere[31]. Samples from the US were from three different sources. Chinese (USC) DNA samples were obtained from a Han Chinese sample panel (Catalog # HD100CHI) available from Coriell Cell Repositories, Camden, NJ. This sample is comprised of 50 males and 50 females, all of whom reported that all four of their grandparents were born in Taiwan, China or Hong Kong. The 160 European American (EA) and 48 African American (AA) subjects were recruited at the University of Connecticut Health Center or at the VA Connecticut Healthcare System, West Haven Campus. All subjects enrolled in the study provided informed consent as approved by the institutional review board at the appropriate institution.
Selection of SNP markers
We selected 13 SNPs with minor allele frequency > 0.15, based on their use in previous studies, and/or map position. These SNPs span the 312.6 kb bp region including GABRA2 and GABRG1, and were genotyped in the six populations described above. Six SNPs that map to GABRA2 (rs567926, rs534459, rs529826, rs279869, rs279858, and rs279837) are a subset of the 10 SNPs reported previously by Covault et al.[15] and are designated here as SNPs G to L, respectively. The other seven SNPs include three intergenic SNPs and four that map to GABRG1, selected from the NCBI database based on LD and intermarker distance. No SNPs resulting in amino acid change are known to map in this region; only one known nonsynonymous SNP (rs279858) in the GABRA2 coding region was genotyped (Table 1). All of these SNPs were polymorphic in all populations.
Genotyping
The TaqMan method, a fluorogenic assay based on 5′-nuclease activity [37], was employed for genotyping. All 13 SNPs were identified in all subjects by using specific assays synthesized and designed by Applied Biosystems (Foster City, CA). All of these TaqMan probe primers are available as ABI “Assays-on-Demand.” Each PCR reaction was performed with a reaction volume of 2μl including 1X concentration of Taqman 2X Universal PCR Master Mix (Applied Biosystems), 1X concentration of 20X assay mix, distilled water, 1X concentration of 100X BSA, and 2 ng DNA. PCR amplification was accomplished using an ABI 9700 thermocycler at 95°C for 10 min, followed by 15 s at 92°C, then 60 s at 60°C for 40 cycles, before detection in the ABI PRISM 7900HT Sequence Detection System (SDS) and analysis using software available from the Applied Biosystems.
Statistical analysis
Allele frequencies for each SNP marker were calculated by using POWERMARKER[38]. The Hardy-Weinberg equilibrium (HWE) exact test was applied. The extent of LD was estimated using the confidence-interval method in HAPLOVIEW software version 3.32 (available at http://www.broad.mit.edu/mpg/haploview)[39], based upon pairwise |D′| calculation between markers. LD measures and haplotype block structure were obtained using the program Haploview. Minimum percentage of genotype was set to exclude markers in which less than 75% of individuals were genotyped. Most markers exceeded this ratio, except rs1391166, rs10938426 and rs 7654165 in the THC population, and markers rs1391166 and rs529826 in the AA population. Genotype data for SNPs in the same region ranging from chromosome 4 nucleotides 45,874,178 – 46,226,602, which span these two genes and cover all of the 13 SNPs, was downloaded from the HapMap project website (http://www.hapmap.org) and were analyzed by HAPLOVIEW to compare LD block structures between our populations and the three HapMap populations of comparable ethnicities (EA comparable to CEU; AA comparable to YRI; and Asian populations: USC, Thais (THT, THC) and HM, comparable to CHB from HapMap). Comparisons were made in two scales. The 11 SNPs presented in our study that were also genotyped in the HapMap population were selected for HAPLOVIEW analysis, but there were no available genotypes for SNPs B and I (rs2350438 and rs529826, respectively) in the HapMap dataset. LD patterns, including all informative SNPs (with minor allele frequency >0.15), were selected from HapMap for analysis. We also analyzed subsets of our dataset defined as haplotype tagging SNPs (htSNPs) selected from LD blocks using the Tagger function within Haploview. Analysis was performed using both “pairwise” and “aggressive tagger” Haploview functions. This function is an extension algorithm developed by Carlson et al [23] and based on de Bakker’s tagger [24]. To examine haplotype frequencies of the htSNPs, PHASE 2.0.2 software [40], based on Bayesian statistical methods, was employed to reconstruct and estimate haplotype frequencies.
Table 4.
Haplotype frequencies reconstructed by compared Block II (SNPs G-L) in European American to other populations
| Haplotype SNP G-H-I-J-K-L | THC | HM | THT | AA | USC | EA |
|---|---|---|---|---|---|---|
| A-G-T-G-T-A | 0.40 | 0.35 | 0.40 | 0.26 | 0.40 | 0.62 |
| G-A-C-T-C-G | 0.43 | 0.55 | 0.44 | 0.19 | 0.44 | 0.34 |
| A-G-T-G-T-G | 0.02 | 0.05 | 0.01 | 0.02 | 0.06 | 0.01 |
| G-G-T-G-T-A | 0.08 | 0.01 | 0.03 | 0.01 | ||
| A-G-T-T-C-G | 0.02 | 0.02 | 0.06 | 0.07 | ||
| A-A-C-T-T-A | 0.48 | |||||
|
| ||||||
| Total | 0.95 | 0.99 | 0.95 | 0.95 | 0.98 | 0.97 |
Acknowledgments
This work was supported in part by grants from the National Institutes of Health (D43 TW06166, R01 AA11330, R01 DA12690, K24 DA15105, K08 AA13732, P50 AA12870, K24 AA13736, R01 AA011321, P50 AA03510, K24 MH64122, P50 DA018197), and the US Department of Veterans Affairs [(VA Alcohol Research Center; VA Mental Illness Research, Education and Clinical Center (VA MIRECC)].
Footnotes
Publisher's Disclaimer: This is a PDF file of an unedited manuscript that has been accepted for publication. As a service to our customers we are providing this early version of the manuscript. The manuscript will undergo copyediting, typesetting, and review of the resulting proof before it is published in its final citable form. Please note that during the production process errors may be discovered which could affect the content, and all legal disclaimers that apply to the journal pertain.
References
- 1.McCormick DA, Bal T. Sleep and arousal: thalamocortical mechanisms. Annu Rev Neurosci. 1997;20:185–215. doi: 10.1146/annurev.neuro.20.1.185. [DOI] [PubMed] [Google Scholar]
- 2.Whittington MA, Traub RD, Jefferys JG. Synchronized oscillations in interneuron networks driven by metabotropic glutamate receptor activation. Nature. 1995;373:612–5. doi: 10.1038/373612a0. [DOI] [PubMed] [Google Scholar]
- 3.Tobler I, Kopp C, Deboer T, Rudolph U. Diazepam-induced changes in sleep: role of the alpha 1 GABA(A) receptor subtype. Proc Natl Acad Sci U S A. 2001;98:6464–9. doi: 10.1073/pnas.111055398. [DOI] [PMC free article] [PubMed] [Google Scholar]
- 4.Schofield PR, Darlison MG, Fujita N, Burt DR, Stephenson FA, Rodriguez H, Rhee LM, Ramachandran J, Reale V, Glencorse TA, et al. Sequence and functional expression of the GABA A receptor shows a ligand-gated receptor super-family. Nature. 1987;328:221–7. doi: 10.1038/328221a0. [DOI] [PubMed] [Google Scholar]
- 5.Olsen RW, Tobin AJ. Molecular biology of GABAA receptors. Faseb J. 1990;4:1469–80. doi: 10.1096/fasebj.4.5.2155149. [DOI] [PubMed] [Google Scholar]
- 6.Barnard EA, Skolnick P, Olsen RW, Mohler H, Sieghart W, Biggio G, Braestrup C, Bateson AN, Langer SZ. International Union of Pharmacology. XV. Subtypes of gamma-aminobutyric acidA receptors: classification on the basis of subunit structure and receptor function. Pharmacol Rev. 1998;50:291–313. [PubMed] [Google Scholar]
- 7.Twyman RE, MacDonald RL. Antiepileptic drug regulation of GABAA receptor channels. Wiley-Liss; New York: 1991. [Google Scholar]
- 8.DeLorey TM, Olsen RW. Gamma-aminobutyric acidA receptor structure and function. J Biol Chem. 1992;267:16747–50. [PubMed] [Google Scholar]
- 9.MacDonald RL, Twyman RE. Kinetic properties and regulation of GABAA receptor channels. Ion Channels. 1992;3:315–43. doi: 10.1007/978-1-4615-3328-3_10. [DOI] [PubMed] [Google Scholar]
- 10.Davies M. The role of GABAA receptors in mediating the effects of alcohol in the central nervous system. J Psychiatry Neurosci. 2003;28:263–74. [PMC free article] [PubMed] [Google Scholar]
- 11.Long JC, Knowler WC, Hanson RL, Robin RW, Urbanek M, Moore E, Bennett PH, Goldman D. Evidence for genetic linkage to alcohol dependence on chromosomes 4 and 11 from an autosome-wide scan in an American Indian population. Am J Med Genet. 1998;81:216–21. doi: 10.1002/(sici)1096-8628(19980508)81:3<216::aid-ajmg2>3.0.co;2-u. [DOI] [PubMed] [Google Scholar]
- 12.Reich T, Edenberg HJ, Goate A, Williams JT, Rice JP, Van Eerdewegh P, Foroud T, Hesselbrock V, Schuckit MA, Bucholz K, Porjesz B, Li TK, Conneally PM, Nurnberger JI, Jr, Tischfield JA, Crowe RR, Cloninger CR, Wu W, Shears S, Carr K, Crose C, Willig C, Begleiter H. Genome-wide search for genes affecting the risk for alcohol dependence. Am J Med Genet. 1998;81:207–15. [PubMed] [Google Scholar]
- 13.Zinn-Justin A, Abel L. Genome search for alcohol dependence using the weighted pairwise correlation linkage method: interesting findings on chromosome 4. Genet Epidemiol. 1999;17(Suppl 1):S421–6. doi: 10.1002/gepi.1370170771. [DOI] [PubMed] [Google Scholar]
- 14.Edenberg HJ, Dick DM, Xuei X, Tian H, Almasy L, Bauer LO, Crowe RR, Goate A, Hesselbrock V, Jones K, Kwon J, Li TK, Nurnberger JI, Jr, O’Connor SJ, Reich T, Rice J, Schuckit MA, Porjesz B, Foroud T, Begleiter H. Variations in GABRA2, encoding the alpha 2 subunit of the GABA(A) receptor, are associated with alcohol dependence and with brain oscillations. Am J Hum Genet. 2004;74:705–14. doi: 10.1086/383283. [DOI] [PMC free article] [PubMed] [Google Scholar]
- 15.Covault J, Gelernter J, Hesselbrock V, Nellissery M, Kranzler HR. Allelic and haplotypic association of GABRA2 with alcohol dependence. Am J Med Genet B Neuropsychiatr Genet. 2004;129:104–9. doi: 10.1002/ajmg.b.30091. [DOI] [PubMed] [Google Scholar]
- 16.Lappalainen J, Krupitsky E, Remizov M, Pchelina S, Taraskina A, Zvartau E, Somberg LK, Covault J, Kranzler HR, Krystal JH, Gelernter J. Association between alcoholism and gamma-amino butyric acid alpha2 receptor subtype in a Russian population. Alcohol Clin Exp Res. 2005;29:493–8. doi: 10.1097/01.alc.0000158938.97464.90. [DOI] [PubMed] [Google Scholar]
- 17.Fehr C, Sander T, Tadic A, Lenzen KP, Anghelescu I, Klawe C, Dahmen N, Schmidt LG, Szegedi A. Confirmation of association of the GABRA2 gene with alcohol dependence by subtype-specific analysis. Psychiatr Genet. 2006;16:9–17. doi: 10.1097/01.ypg.0000185027.89816.d9. [DOI] [PubMed] [Google Scholar]
- 18.Enoch MA, Schwartz L, Albaugh B, Virkkunen M, Goldman D. Dimensional anxiety mediates linkage of GABRA2 haplotypes with alcoholism. Am J Med Genet B Neuropsychiatr Genet. 2006;141:599–607. doi: 10.1002/ajmg.b.30336. [DOI] [PMC free article] [PubMed] [Google Scholar]
- 19.Drgon T, D’Addario C, Uhl GR. Linkage disequilibrium, haplotype and association studies of a chromosome 4 GABA receptor gene cluster: candidate gene variants for addictions. Am J Med Genet B Neuropsychiatr Genet. 2006;141:854–60. doi: 10.1002/ajmg.b.30349. [DOI] [PMC free article] [PubMed] [Google Scholar]
- 20.Tian H, Chen HJ, Cross TH, Edenberg HJ. Alternative splicing and promoter use in the human GABRA2 gene. Brain Res Mol Brain Res. 2005;137:174–83. doi: 10.1016/j.molbrainres.2005.03.001. [DOI] [PubMed] [Google Scholar]
- 21.Wilcox AS, Warrington JA, Gardiner K, Berger R, Whiting P, Altherr MR, Wasmuth JJ, Patterson D, Sikela JM. Human chromosomal localization of genes encoding the gamma 1 and gamma 2 subunits of the gamma-aminobutyric acid receptor indicates that members of this gene family are often clustered in the genome. Proc Natl Acad Sci U S A. 1992;89:5857–61. doi: 10.1073/pnas.89.13.5857. [DOI] [PMC free article] [PubMed] [Google Scholar]
- 22.Gabriel SB, Schaffner SF, Nguyen H, Moore JM, Roy J, Blumenstiel B, Higgins J, DeFelice M, Lochner A, Faggart M, Liu-Cordero SN, Rotimi C, Adeyemo A, Cooper R, Ward R, Lander ES, Daly MJ, Altshuler D. The structure of haplotype blocks in the human genome. Science. 2002;296:2225–9. doi: 10.1126/science.1069424. [DOI] [PubMed] [Google Scholar]
- 23.Carlson CS, Eberle MA, Rieder MJ, Yi Q, Kruglyak L, Nickerson DA. Selecting a maximally informative set of single-nucleotide polymorphisms for association analyses using linkage disequilibrium. Am J Hum Genet. 2004;74:106–20. doi: 10.1086/381000. [DOI] [PMC free article] [PubMed] [Google Scholar]
- 24.de Bakker PI, Yelensky R, Pe’er I, Gabriel SB, Daly MJ, Altshuler D. Efficiency and power in genetic association studies. Nat Genet. 2005;37:1217–23. doi: 10.1038/ng1669. [DOI] [PubMed] [Google Scholar]
- 25.Pritchard JK, Cox NJ. The allelic architecture of human disease genes: common disease-common variant...or not? Hum Mol Genet. 2002;11:2417–23. doi: 10.1093/hmg/11.20.2417. [DOI] [PubMed] [Google Scholar]
- 26.HapMap The International HapMap Project. Nature. 2003;426:789–96. doi: 10.1038/nature02168. [DOI] [PubMed] [Google Scholar]
- 27.Klein AP, Tsai YY, Duggal P, Gillanders EM, Barnhart M, Mathias RA, Dusenberry IP, Turiff A, Chines PS, Goldstein J, Wojciechowski R, Hening W, Pugh EW, Bailey-Wilson JE. Investigation of altering single-nucleotide polymorphism density on the power to detect trait loci and frequency of false positive in nonparametric linkage analyses of qualitative traits. BMC Genet. 2005;6(Suppl 1):S20. doi: 10.1186/1471-2156-6-S1-S20. [DOI] [PMC free article] [PubMed] [Google Scholar]
- 28.Goldstein DB. Islands of linkage disequilibrium. Nat Genet. 2001;29:109–11. doi: 10.1038/ng1001-109. [DOI] [PubMed] [Google Scholar]
- 29.Johnson GC, Esposito L, Barratt BJ, Smith AN, Heward J, Di Genova G, Ueda H, Cordell HJ, Eaves IA, Dudbridge F, Twells RC, Payne F, Hughes W, Nutland S, Stevens H, Carr P, Tuomilehto-Wolf E, Tuomilehto J, Gough SC, Clayton DG, Todd JA. Haplotype tagging for the identification of common disease genes. Nat Genet. 2001;29:233–7. doi: 10.1038/ng1001-233. [DOI] [PubMed] [Google Scholar]
- 30.Sabeti PC, Reich DE, Higgins JM, Levine HZ, Richter DJ, Schaffner SF, Gabriel SB, Platko JV, Patterson NJ, McDonald GJ, Ackerman HC, Campbell SJ, Altshuler D, Cooper R, Kwiatkowski D, Ward R, Lander ES. Detecting recent positive selection in the human genome from haplotype structure. Nature. 2002;419:832–7. doi: 10.1038/nature01140. [DOI] [PubMed] [Google Scholar]
- 31.Listman JB, Malison RT, Sughondhabirom A, Yang BZ, Raaum RL, Thavichachart N, Sanichwankul K, Kranzler HR, Tangwonchai S, Mutirangura A, Disotell TR, Gelernter J. Demographic changes and marker properties affect detection of human population differentiation. BMC Genet. 2007;8:21. doi: 10.1186/1471-2156-8-21. [DOI] [PMC free article] [PubMed] [Google Scholar]
- 32.Patil N, Berno AJ, Hinds DA, Barrett WA, Doshi JM, Hacker CR, Kautzer CR, Lee DH, Marjoribanks C, McDonough DP, Nguyen BT, Norris MC, Sheehan JB, Shen N, Stern D, Stokowski RP, Thomas DJ, Trulson MO, Vyas KR, Frazer KA, Fodor SP, Cox DR. Blocks of limited haplotype diversity revealed by high-resolution scanning of human chromosome 21. Science. 2001;294:1719–23. doi: 10.1126/science.1065573. [DOI] [PubMed] [Google Scholar]
- 33.Shifman S, Kuypers J, Kokoris M, Yakir B, Darvasi A. Linkage disequilibrium patterns of the human genome across populations. Hum Mol Genet. 2003;12:771–6. doi: 10.1093/hmg/ddg088. [DOI] [PubMed] [Google Scholar]
- 34.Beaty TH, Fallin MD, Hetmanski JB, McIntosh I, Chong SS, Ingersoll R, Sheng X, Chakraborty R, Scott AF. Haplotype diversity in 11 candidate genes across four populations. Genetics. 2005;171:259–67. doi: 10.1534/genetics.105.043075. [DOI] [PMC free article] [PubMed] [Google Scholar]
- 35.Sawyer SL, Mukherjee N, Pakstis AJ, Feuk L, Kidd JR, Brookes AJ, Kidd KK. Linkage disequilibrium patterns vary substantially among populations. Eur J Hum Genet. 2005;13:677–86. doi: 10.1038/sj.ejhg.5201368. [DOI] [PubMed] [Google Scholar]
- 36.Kalinowski ST, Wagner AP, Taper ML. ML-Relate: Software for estimating relatedness and relationship from multilocus genotypes. Mol Ecol Notes. 2006;6:576–579. [Google Scholar]
- 37.Shi MM, Myrand SP, Bleavins MR, de la Iglesia FA. High throughput genotyping for the detection of a single nucleotide polymorphism in NAD(P)H quinone oxidoreductase (DT diaphorase) using TaqMan probes. Mol Pathol. 1999;52:295–9. doi: 10.1136/mp.52.5.295. [DOI] [PMC free article] [PubMed] [Google Scholar]
- 38.Liu K, Muse SV. PowerMarker: an integrated analysis environment for genetic marker analysis. Bioinformatics. 2005;21:2128–9. doi: 10.1093/bioinformatics/bti282. [DOI] [PubMed] [Google Scholar]
- 39.Barrett JC, Fry B, Maller J, Daly MJ. Haploview: analysis and visualization of LD and haplotype maps. Bioinformatics. 2005;21:263–5. doi: 10.1093/bioinformatics/bth457. [DOI] [PubMed] [Google Scholar]
- 40.Stephens M, Donnelly P. A comparison of bayesian methods for haplotype reconstruction from population genotype data. Am J Hum Genet. 2003;73:1162–9. doi: 10.1086/379378. [DOI] [PMC free article] [PubMed] [Google Scholar]