Abstract
An effective mechanism for rapid and efficient microfluidic particle trapping and concentration is proposed without requiring any mechanically moving parts. When a voltage beyond the threshold atmospheric ionization value is applied on a sharp electrode tip mounted at an angle above a microfluidic liquid chamber, the bulk electrohydrodynamic air thrust that is generated results in interfacial shear and, hence, primary azimuthal liquid surface recirculation. This discharge driven vortex mechanism, in turn, causes a secondary bulk meridional liquid recirculation, which produces an inward radial force near the bottom of the chamber. Particles suspended in the liquid are then rapidly convected by the bulk recirculation toward the bottom, where the inward radial force causes them to spiral in a helical swirl-like fashion toward a stagnation point. In particular, we show that these flows, similar to Batchelor flows occurring in a cylindrical liquid column between a stationary and rotating disk, can be used for the separation of red blood cells from blood plasma in a miniaturized device.
INTRODUCTION
With the advent of microfluidic technology, miniaturized platforms for rapid point-of-care medical diagnostics are becoming increasingly realizable in replacing conventional clinical laboratory analysis. The small sample volumes employed in microscale assay techniques not only increases patient comfort, convenience, and compliance by minimizing the amount of blood required to be drawn, but also allows the analysis to be carried out precisely at a fraction of the cost and duration, the latter due to reduced residence times and elimination of complex and lengthy preparation steps. In addition, automated parallelization, portability, and the possibility of on-time repetitive sampling are other advantages of carrying out such procedures at the microscale.1
An essential step, which approximately takes up to a quarter of the time, cost, and effort in hematological clinical diagnostics and prognostics of diseases and inflammatory responses (e.g., tests for thyroid and liver function, blood chemistry, and blood lipids), is the extraction of blood cells and other cellular components from blood plasma, which carries a significant amount of substances pertinent to the body’s function such that a simple test on blood plasma can be used to evaluate the health of various internal organs. The quality of these diagnostic tests depends on the purity of the extracted plasma. Undesirable matrix effects resulting from inefficient separation of blood cells and other cellular components lead to nonuniformity and, hence, inaccurate and irreproducible results.2
However, efficient separation of bubbles, drops, bacteria, viruses, blood cells, or other bioparticulate matter from a sample is often difficult in microfluidic devices. Strong centrifugation, which is conventionally used at laboratory scale, is difficult to achieve at microscale dimensions. The microcentrifugation devices that have been developed for blood plasma separation are relatively large and cumbersome, involving the rotation of the entire microfluidic separation chamber.3, 4, 5 The use of membrane or other microfabricated filters,6, 7, 8 on the other hand, entails complex membranes or complicated fabrication techniques to achieve very small pore sizes. Moreover, large syringe pumps are required to drive the fluid through these membranes. The large shear produced by these pumps is counterproductive, since it results in the deformation and denaturing of the blood cells, which are susceptible to breakage as a result of shearing action.
Dielectrophoresis (DEP) has been proposed as a means of particulate concentration∕separation to overcome these limitations.9, 10 Nevertheless, DEP particle velocities scale quadratically with the particle size and is limited below 10 μm∕s. Moreover, the particle motion is often disrupted by the bulk electrokinetic flow, which can often act in opposing directions to the DEP force.11
More recently, a continuous flow plasma separation device12 has been proposed utilizing the so-called Zweifach-Fung effect13, 14, 15 in which blood cells, when approaching a bifurcated channel, are observed to preferentially migrate toward the channel with the higher flow rate due to the nonuniform distribution of the shear force on the blood cell, and, also since the side of the blood cell facing the channel branch with the higher flow rate experiences a lower pressure. Nevertheless, there are some situations in which batch operation is preferable to continuous flow operation, especially when the amount of blood sample is to be minimized, which is often desirable in portable blood diagnostic kits, where patient comfort and convenience is of vital importance.
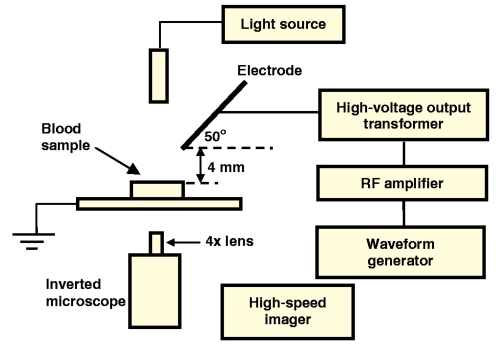
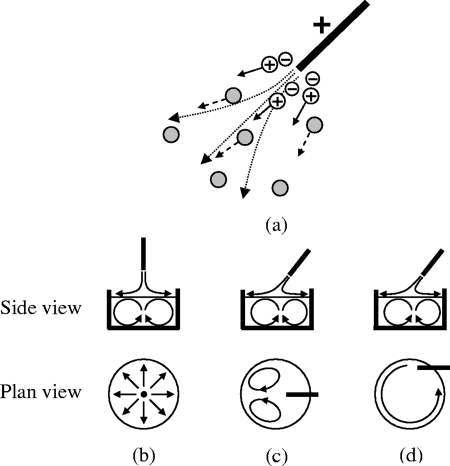
Here, we propose a blood plasma separation device based on a swirling liquid flow induced by directed bulk electrohydrodynamic gas phase propulsion above the liquid surface. The bulk electrohydrodynamic thrust, also known as corona or ionic wind, arises upon the application of a potential that exceeds a threshold ionization voltage for air across a sharp (corona) electrode tip mounted a small distance above the liquid surface and inclined such that the field is directed toward the surface, as shown in Fig. 1. This creates a nearly singular electric field near the electrode tip and gives rise to a corona discharge.16 Consequently, the counter-ions generated are propelled away from the electrode tip, colliding with electroneutral air molecules in the process. An air flow directed toward the liquid surface is thus generated due to the transfer of momentum from these collisions, as depicted in Fig. 2a.
Figure 1.
Schematic representation of the experimental apparatus used to generate the bulk electrohydrodynamic air thrust and, hence, liquid rotation.
Figure 2.
(a) Ionic wind mechanism. The grey circles indicate the electroneutral air molecules that the counter-ions collide with when they are repelled away from the corona electrode. (b)-(d) Side and plane views of the different surface and bulk liquid flow configurations in which the corona electrode is mounted in a (b) symmetrically centered vertical position (φ=90 °), (c) symmetrically centered inclined position (0<φ<90 °), and (d) lateral inclined position (0<φ<90 °).
The liquid flow that arises depends on the position and angle of inclination of the corona electrode. If the electrode is mounted vertically (φ=90°) and symmetrically centered above the liquid surface, as shown in Fig. 2b, then a radial outflow of the air results in interfacial shear at the liquid surface. Due to flow conservation, the radially outward flowing liquid must then recirculate, resulting in internal recirculation vortices in the bulk of the liquid.17 If the point force exerted by the air thrust on the liquid surface is sufficiently large, interfacial deformation in the form of a small depression also accompanies the secondary recirculating flow.18
If the corona electrode is inclined (0°<φ<90°), however, a different primary flow behavior arises. A pair of surface vortices were recently observed if the corona electrode is aligned symmetrically along the centerline, as illustrated in Fig. 2c. This discharge driven vortex (DDV) phenomenon was demonstrated as a potential technique for inducing rapid microfluidic mixing and microparticle concentration∕separation.19 On the other hand, if the corona electrode is inclined but placed laterally, as depicted in Fig. 2d, then only unidirectional recirculatory flow arises. These primary surface flows due to air-liquid interfacial shear are, however, accompanied by similar secondary flow recirculation patterns in the bulk of the liquid. This was first proposed by Einstein20 to explain the paradoxical observation of tea leaves aggregating in the center at the bottom of a tea cup as the cup is stirred instead of being expelled radially outwards due to centrifugal acceleration. The fluid-particle interaction exploited for the blood plasma separation, therefore, follows the very same principle!21
In this article, we provide experimental results that demonstrate the potential of the recirculatory flow associated with the nonsymmetric inclined electrode case shown in Fig. 2d to rapidly separate red blood cells (RBCs) from blood plasma and show that it can be exploited as an effective microfluidic particle trapping device. The device, however, is not limited to blood plasma separation and can be used as a general microparticle trapping or concentration mechanism for a wide range of microfluidic applications, such as bacteria traps in biosensors.
The advantages of the device over other microfluidic separators and concentrators are apparent. It contains no mechanically moving parts that are noisy and prone to reliability issues such as wear and tear. The absence of electrode and sample contact avoids the usual problems of electrolytic reactions in electrokinetic devices that lead to bubble and ion generation, which result in sample contamination. The lack of sample contact also reduces the possibility of nonspecific adsorption (contact and adherence of target molecules on electrodes), which are common in systems involving biological entities. Furthermore, by employing high frequency ac fields, Joule heating effects are eliminated and the low power associated with the minimal current through the gas phase capacitor stipulates that the device has significant potential to be miniaturized to dimensions commensurate with portability. Moreover, with the use of high frequency ac fields, the device is inherently safe, thus permitting its use in commercial diagnostic kits.
EXPERIMENTAL METHOD
A schematic depiction of the experimental setup is shown in Fig. 1. We mounted a 25-gauge 1 in. sharp tip hypodermic needle (Terumo) that acts as the corona electrode at an inclination angle of 50° to the horizontal and 4 mm above a liquid surface. The liquid itself is contained within a small cylindrical chamber with insulated sides, which consists of a small (radius a=4 mm) hole bored through a 4 mm thick piece of insulation material. In this case, we employ flexible silicone rubber and polydimethylsiloxane (PDMS) sheeting, the latter being considered a hemocompatible material that minimizes endotoxin contamination and leukocyte or complement activation.22, 23 To enable flow visualization from below using an inverted microscope (Olympus IX-71), the sheet is glued onto a microscope slide. The needle was connected to a signal generator (Hewlett-Packard 33120A), rf amplifier (Powertron 250 A, 10 Hz–1 MHz) and high voltage output transformer (Industrial Test Equipment 113459-1; 15–100 kHz, 250 W, primary voltage 0–22.5 Vrms, secondary voltage 0–2100 Vrms) in order to generate 20–95 kHz ac potentials of up to 1 kVrms. The signal from the amplifier was transmitted across the needle and chamber gap by connecting one side of the input to the needle; the base of the chamber is left grounded. The flow was imaged at 60 frames∕s using a high-speed video camera (Olympus iSpeed) connected directly to the inverted microscope with a 4× magnification lens focused at a plane coinciding with the bottom of the microfluidic chamber.
The working liquid consisted of whole sheep’s blood with adenine citrate dextrose as an anticoagulant (Institute of Medical and Veterinary Science, Australia). In order to facilitate visualization of the flow phenomenon, we restricted the RBC concentration (hematocrit) to 0.4% by volume; a higher hematocrit level overwhelmed the image with RBCs and hindered quantification of the transient concentration process via a pixel intensity analysis. Nevertheless, we have verified that the principle remains workable for whole blood (∼40% hematocrit). The required hematocrit was produced by diluting the whole blood with phosphate buffer saline (Sigma-Aldrich) with a pH of 7.3, which mimics the properties of blood plasma.
Before each run, a 200 μl liquid sample of the diluted blood was placed within the microfluidic chamber and vigorously stirred using a micropipette to suspend any RBCs that had sedimented due to the action of gravity. The flow is then initiated rapidly by turning on the electric field immediately after agitation. The pixel intensities of the images were acquired using Matlab® (The Mathworks, Inc.) and normalized against that of the first image at time t=0. Each experiment set was repeated three times and the results averaged over these datasets.
The hematocrit was measured by extracting the plasma effluent on the top layer and subsequently mixing with an equal volume of cold deionized water to lyse the remaining RBCs. The concentration of hemoglobin from the lysed RBCs was measured using a uv spectrometer (Hitachi 100–60) according to the following procedure:24 The hemoglobin solution was diluted ten times with deionized water, 1 ml of this solution was mixed with 50 μl of 20% potassium ferricyanide. After two minutes, 50 μl of 10% potassium cyanide was added. The absorbance A of the mixture was measured at 540 nm against a reference consisting of 1 ml water and 50 μl each of 20% potassium ferricyanide and 10% potassium cyanide. The hemoglobin concentration (Hb) in the solution (mM) was then calculated according to25, 26
| (1) |
Since the hemoglobin concentration within the RBCs is known, i.e., 150 mg∕ml, the hematocrit of the extracted plasma can thus be estimated.
RESULTS AND DISCUSSION
Physical mechanism
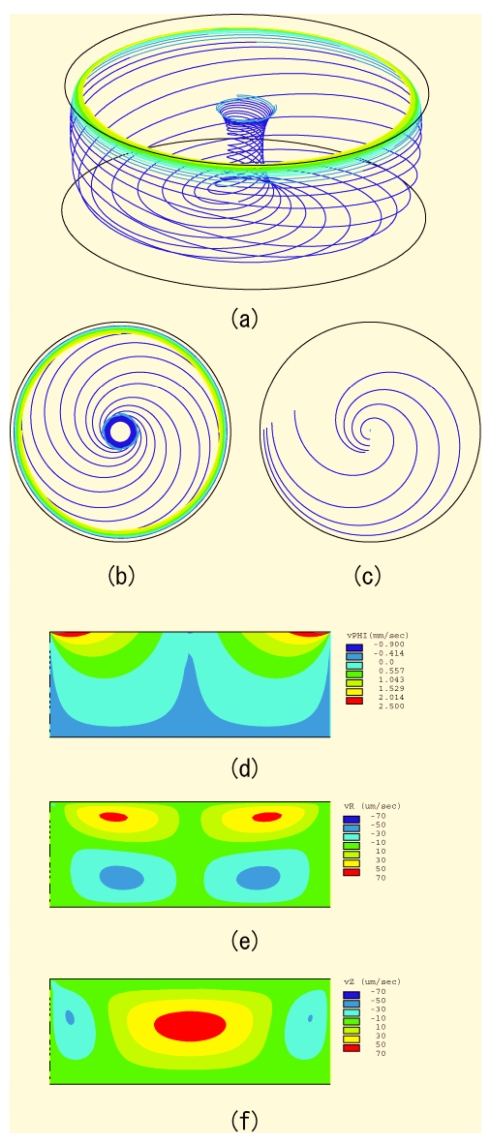
The physical mechanism associated with the liquid flow was briefly reported in a previous communication.21 The primary azimuthal∕circumferential surface rotation of the liquid generated by the interfacial air shear as a result of the directed electrohydrodynamic air thrust can be likened to a rotating disk above a short cylindrical liquid column resembling the microfluidic chamber. The base of the column does not move, and hence, resembles a stationary disk. The flow behavior is, therefore, similar to Batchelor flows arising in a column of fluid trapped between a rotating and stationary disk.27, 28 The dynamics of such a flow is shown in Fig. 3, which plots the numerical results obtained from the solution of the Navier-Stokes equation governing the incompressible liquid motion in a cylindrical geometry (r, θ, z), subject to the no-slip boundary condition
| (2) |
at the base (r⩽a, z=0) and side walls (r=a, 0⩽z⩽h), and an angular velocity
| (3) |
at the free liquid surface (r⩽a, z=h). In the above, u=(ur,uθ,uz) is the velocity vector and ω is the rotational speed. The numerical solution, with ω=0.72 rad∕s, and in which the fluid is assumed to be water with viscosity 1 cp and density 103 kg∕m3 such that the Reynolds number is typically of order 1–10, was obtained using a finite element analysis solver ANSYS (ANSYS, Inc.) with a three-dimensional mapped brick mesh containing 4400 elements.
Figure 3.
Numerical solution of the governing hydrodynamic equation of motion subject to an angular rotation ω at the top liquid surface and no slip conditions at the side and bottom walls of the microfluidic chamber. Panels (a), (b), and (c) are flow field traces that illustrate the helical swirl-like motion inwards toward a stagnation point at the bottom of the chamber and the subsequent rise of the liquid up a central column due to flow conservation. Panel (b) is a cross-sectional plan view of panel (a), whereas panel (c) shows the flow field a small distance (0.4 mm) above the base. Panels (d), (e), and (f) are the circumferential θ, radial r, and vertical z flow velocity profiles, respectively. The warm colors (red, orange, and yellow) indicate motion along the respective axis directions, whereas the cool colors (light and dark blue) indicate motion against the axis direction.
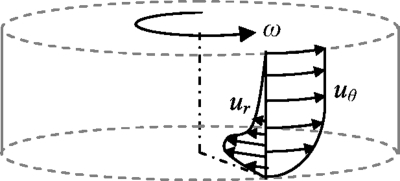
The flow field traces are shown in Figs. 3a, 3b, 3c and the velocity distributions in Figs. 3d, 3e, 3f. It can be seen from Figs. 3d, 3e that the primary azimuthal surface rotation generates a secondary bulk meriodional recirculation, as depicted in Fig. 2d, in which fluid flowing down along the side walls is reconvected upwards through a central column, as shown in Figs. 3a, 3b, 3c. Figure 3c, which is a cross section of the flow profile at a fixed height just above the base, also illustrates the spiral-like helical inward flow. This is due to an inward radial velocity in a thin boundary layer (known as the Ekman layer) just above the base, as shown in the schematic in Fig. 4 in which the azimuthal and radial flow velocity profiles are sketched. The centrifugal force, which varies as the square of the azimuthal velocity, within the Ekman boundary layer close to the bottom of the chamber is much lower than that in the rest of the fluid due to friction manifesting as the no-slip boundary condition at the base. On the other hand, the radial inward velocity is much higher close to the bottom, giving rise to an inward recirculation.
Figure 4.
Sketch of the azimuthal and radial velocity profiles depicting the mechanism by which a recirculating flow arises, attributed to the decrease in the azimuthal velocity and, hence, centrifugal force and the increase in the inward radial velocity at the fluid layer near the bottom of the chamber. The flow in the thin Bödewadt layer just below the free surface is omitted for simplicity.
The apparent particle velocity vector w can be decomposed into the liquid velocity and true particle velocity vectors, u and v, respectively. However, a balance between the gravitational body force acting on the particle, which scales as L3 (L being the characteristic dimension of the particle), and viscous drag, which scales as μUL (μ being the liquid viscosity and U being the characteristic convective velocity), stipulates that v scales as L2. For small particles, v is therefore typically much smaller than u, suggesting that liquid convection is required to speed up the trapping process.29 An example of such a convective flow is given by the helical swirling motion described above.
Particle trapping also requires the trajectory of the particle to converge to a single fixed point (an attractor or node) at which u=0. However, this is strictly not possible since the liquid obeys flow conservation and, therefore, recirculates back up the central spinal column shown in Fig. 3a. In other words, continuity (or a divergence-free condition), i.e., ∇⋅u=0, is required. Nevertheless, since u is small near its fixed points, u can be converted into an attractor if the particle suffers from a local particle force, and hence velocity v that acts in the opposite direction of u.27 It will be seen via the demonstration of RBC concentration at a stagnation point in the subsequent section that the gravitational force acting on the particle, although small, is sufficient to achieve this in the majority of cases. The converging stagnation flow induced by the combination of the primary and secondary electrohydrodynamically-induced liquid recirculation therefore provides one such particle trapping mechanism.
Experimental observations
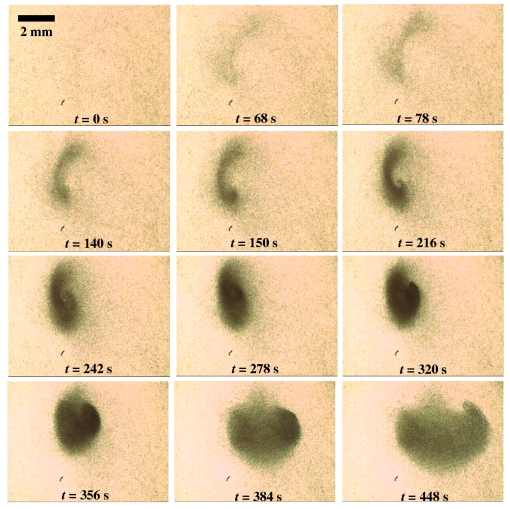
Figure 5 shows successive images acquired at 60 frames∕s demonstrating the concentration of RBCs in the microfluidic chamber with an applied electric field of 286 kV∕m and a frequency of 60 kHz. We observe that the RBCs, initially suspended in the blood plasma continuum matrix, are therefore swept up rapidly by these bulk recirculating vortices along the side walls of the cylindrical chamber toward the chamber bottom. Once the RBCs are at the sides of the chamber close to the bottom, the inward recirculation flow resulting from the strong inward radial velocity field near the bottom of the chamber then causes them to spiral in toward a central stagnation point, as can be seen from the inverted-comma-like shape of the particle ensemble at the bottom of the chamber, which resembles the flow field in the Ekman boundary layer depicted in Fig. 3c.
Figure 5.
Successive images obtained by high speed video microscopy at 60 frames∕s showing the spiral-like trajectory of the RBCs near the bottom of the microfluidic chamber toward a stagnation point. The applied field and frequency are 286 kV∕m and 60 kHz, respectively, and the initial hematocrit is 0.4%.
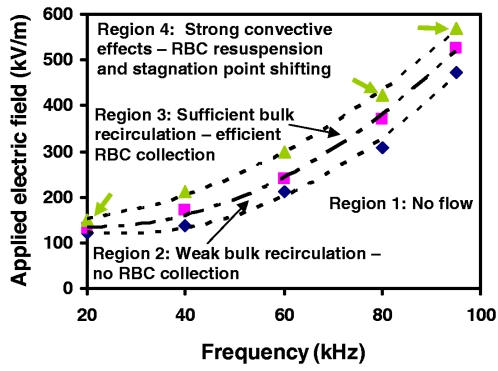
It should be noted, however, that there exists a voltage or electric field window within which particle trapping occurs; this window is shown in the electric field-frequency space in Fig. 6 and appears to increase with applied frequency. The lower boundary coincides with the threshold ionization potential for air, below which there is no bulk electrohydrodynamic thrust, and hence, corresponding liquid flow (region 1). The lower limit for RBC trapping, however, lies well above this threshold potential since the commencement of the primary liquid flow that consists of the primary azimuthal surface recirculation does not ensure the trapping of particles at the stagnation point (region 2). In fact, for particle trapping to occur at the bottom of the chamber, the secondary bulk meridional flow is required to exist that leads to the funneling of the particles toward the bottom of the chamber (region 3).
Figure 6.
Delineation of the operating regimes for RBC collection in the electric field-frequency space. In region 1, the applied potential is below the threshold ionization voltage. Thus, there is no bulk electrohydrodynamic air thrust and, hence, no liquid motion. Although the primary surface recirculation is present in region 2, it is too weak to generate the bulk meridional recirculation vortices for RBC trapping. Region 3 is the optimum operating zone, where RBC collection is most efficient. If the field is increased further, however, the strong convective flow associated with the bulk meridional recirculation overwhelms the gravitational force on the particle that pins it down to a stagnation point. As such, RBC resuspension back up the liquid recirculation path occurs in region 4. Close to the boundaries between regions 3 and 4, however, a moderately strong convection may not lead to complete resuspension but will cause shifting in the stagnation point to a new location. RBC collection can still take place, but is less efficient than in region 3.
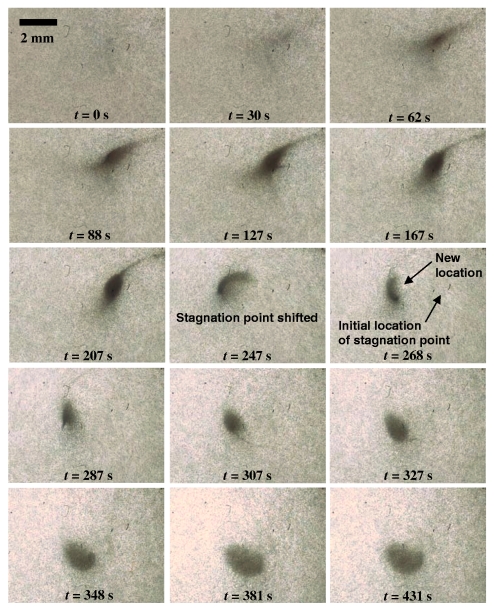
An upper boundary also exists, beyond which RBC trapping becomes inefficient (region 4). We attribute this to an increased local liquid velocity near the stagnation point as a result of the stronger bulk liquid convection. Consequently, the gravitational force acting on the RBCs is no longer sufficient in providing a local force that converts the fixed point into an attractor. The stagnation point becomes unstable due to the resuspension of the RBCs back up the central spinal column along the liquid recirculation pathway and the collected RBCs appear to disperse slightly, as shown in Fig. 7, thereby reducing the collection efficiency. Near the boundaries delineating regions 3 and 4, the convection may not be excessive to resuspend the concentrated RBCs, but may still be sufficiently strong to shift the entire stagnation point to a different location, as seen in Fig. 7. In this case, RBC collection still proceeds but is less efficient than in region 3. It is also possible that when high electric fields are employed and, hence, the induced primary surface recirculation velocity increases beyond a critical value, flow instabilities arise in the form of stationary axisymmetric and three-dimensional structures in the Bödewadt (thin fluid boundary layer adjacent to the top rotating surface) and Ekman layers.30, 31 This was observed in the initial experiments of Yeo et al.,19 which led to a breakdown of the large primary vortices into smaller vortices over a cascade of length scales. These flow instabilities, manifesting as turbulent mixing eddies, although useful for micromixing, result in unstable states that reduce RBC trapping efficiency.
Figure 7.
Image sequences acquired at 60 frames∕s showing the effects of a stronger local convective flow at 546 kV∕m and 80 kHz; the initial hematocrit is 0.4% The gravitational force acting on the RBCs is no longer sufficient to provide a downward force to pin the particle down to the stagnation point and, hence, partial resuspension of the particles together with the flow up the recirculation column occurs. The operating parameters in this case, however, are close to the boundaries between the stable operating zone of region 3 and the unstable operating zone of region 4. As such, the bulk convective effects are insufficient to cause complete RBC resuspension but adequately strong to cause shifting of the stagnation point to a new location.
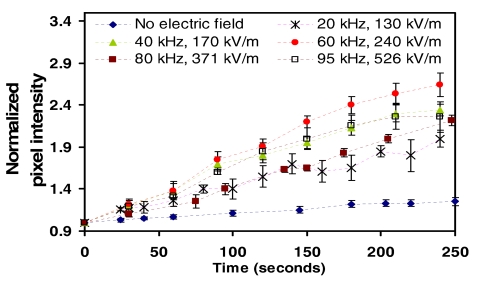
A pixel intensity analysis was employed to study the dynamics of RBC separation within the stable trapping region (region 3). As the particles are collected, it is obvious that the pixel intensity, normalized against the initial intensity in the first frame of the sequence at time t=0, will increase as more particles are collected at the bottom of the chamber coinciding with the focal plane of the microscope. Figure 8 shows the results of the analysis for values of the applied electric field that lie within the stable operating zone (region 3) at applied frequencies of 20, 40, 60, 80, and 95 kHz. The separation process is observed to be relatively quick, taking place over approximately 200 s at the optimum frequency of 60 kHz, as well as efficient, leaving the liquid above to consist of RBC-lean plasma with a hematocrit below 0.003%. By comparison, the normalized intensity increases slowly due to gravitational sedimentation effects alone when no electric field is applied in which the RBC separation required periods in excess of 20 min.
Figure 8.
RBC collection at the stagnation point as a function of time as measured by a pixel intensity analysis for various values of the applied electric field and frequency. The pixel intensities at different times, extracted from the relevant image frames, are normalized by the pixel intensity of the initial frame at time t=0. The data when the electric field is not present are also shown; in this case, the particles sink to the bottom of the chamber purely due to gravitational sedimentation effects alone.
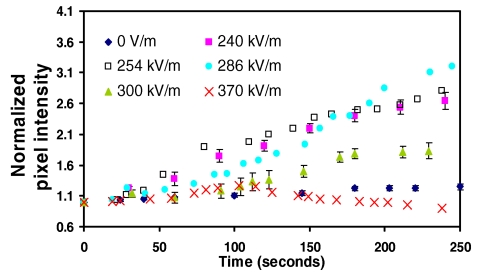
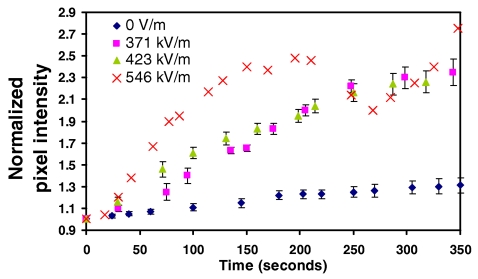
The effects of increasing the electric field when the applied frequency is fixed can be seen in Fig. 9 (60 kHz) and Fig. 10 (80 kHz). We observe the RBC separation time to increase with increasing applied fields until a critical value beyond which the strong bulk convective flow associated with region 4 occurs wherein the RBCs are resuspended, leading to a decrease in the normalized pixel intensity. For 60 kHz, this occurs between 290–300 kV∕m. While the slow transient increase in the pixel intensities for the high field (300 and 370 kV∕m) 60 kHz data in Fig. 9 is evidence of complete RBC resuspension, partial resuspension can also occur if the operating conditions are close to the boundary between regions 3 and 4. In this case, the bulk convective flow is not sufficiently strong to cause complete RBC suspension but adequate to cause partial resuspension and even shifting of the stagnation point. This can be seen more clearly in the 80 kHz data depicted in Fig. 10. Beyond an applied field of approximately 500 kV∕m, we observe a sharp decrease in the normalized pixel intensity before it increases again. This is associated with the shift in position of the stagnation point and the continuation of RBC trapping at this new location.
Figure 9.
Effect of increasing the electric field at a fixed applied frequency, i.e., 60 kHz, on the normalized pixel intensity as a function of time. Above 290–300 kV∕m, the strong convective effects associated with region 4 begin to cause RBC resuspension back into the bulk flow recirculation path.
Figure 10.
Effect of increasing the electric field at a fixed applied frequency, i.e., 80 kHz, on the normalized pixel intensity as a function of time. Above 500 kV∕m, the partial resuspension and shifting of the stagnation point occurs as indicated by the dip in the normalized pixel intensity at about 200 s. Once the shift occurs, RBC trapping resumes at the new location as indicated by the reincrease in the pixel intensity at approximately 260 s.
CONCLUSION
A rapid and efficient microfluidic particle trapping and concentration device based on a DDV mechanism19 without mechanically moving parts is proposed. We demonstrate the technology for the effective separation of RBCs from blood plasma in approximately 200 s. The RBCs are essentially convected in a helical swirl-like flow which arises due to a combination of the centrifugal and inward radial forces that are associated with the secondary bulk meridional flow recirculation toward a stagnation point at a central location at the bottom of the cylindrical microfluidic chamber. Further resuspension of the cells in the return upward trajectory of the flow recirculation is prevented below a critical applied field and hence local liquid velocity near the stagnation point by gravitational forces. This leaves behind a relatively pure residual plasma layer with a hematocrit of approximately 0.003%. The bulk meridional flow responsible for the particle trapping is due to an inward radial force arising as a result of the primary azimuthal liquid surface recirculation at the top of the microfluidic chamber, generated due to interfacial shear by an electrohydrodynamic air thrust directed toward the liquid surface known as ionic or corona wind, which is a consequence of the atmospheric breakdown of the air around the singular electrode tip when the applied voltage exceeds the atmospheric threshold ionization voltage. The particle trapping is analogous to Einstein’s explanation for the paradoxical observation of tea leaves accumulating centrally at the bottom of an agitated tea cup.
The flow behavior, which resembles the Batchelor flow of a cylindrical liquid column trapped between a stationary and rotating disk, exhibits rich features that warrant further study. Of particular interest is the onset of axisymmetric and three-dimensional flow stabilities in the thin boundary layers adjacent to the top free surface and the base of the chamber when the applied field and hence, surface rotational velocity is increased beyond a critical threshold. The onset of RBC resuspension and stagnation point shifting due to increased fields and, hence, local velocity around the stagnation point also merits further examination. Current work is aimed at employing a stronger local particle force as a substitute to the weak gravitational sedimentation force to prevent particle suspension and stagnation point translation due to convective flow effects. A separate article will also detail the use of ancillary electrodes to exploit the short range trapping effects of DEP to enhance particle trapping at these electrodes.32
References
- Toner M. and Irimia D., Annu. Rev. Biomed. Eng. 10.1146/annurev.bioeng.7.011205.135108 7, 77 (2005). [DOI] [PMC free article] [PubMed] [Google Scholar]
- Blattert C., Jurischka R., Tahhan I., Schoth A., Kerth P., and Menz W., in Proceedings of the 26th Annual International Conference of the IEEE Engineering in Medicine and Biology Society, San Francisco, CA, 2004 (IEEE, New York, 2004). [DOI] [PubMed]
- Guigan J., “Method and apparatus for obtaining and delivering a predetermined quantity of plasma from a blood sample for analysis purpose,” U.S. Patent No. 4,788,154 (1998).
- Pugia M. J., Profitt J. A., Schulman L. S., Blankenstein G. and Peters R.-P., “Method and apparatus for separation of particles in a microfluidic device,” W. O. Patent No. 2004/061413 (2004).
- Haeberle S., Brenner T., Zengerle R., and Ducree J., Lab Chip 10.1039/b604145k 6, 776 (2006). [DOI] [PubMed] [Google Scholar]
- Wilding P., Pfahler J., Bau H. H., Zemel J. N., and Kricka L. J., Clin. Chem. 40, 43 (1994). [PubMed] [Google Scholar]
- Brody J. P., Osborn T. D., Forster F. K., and Yager P., Sens. Act. A 54, 704 (1996). [Google Scholar]
- Yuen P. K., Kricka L. J., Fortina P., Panaro N. J., Sakazume T., and Wilding P., Genome Res. 10.1101/gr.155301 11, 405 (2001). [DOI] [PMC free article] [PubMed] [Google Scholar]
- Pohl H. A., Dielectrophoresis (Cambridge University Press, Cambridge, 1978). [Google Scholar]
- Gascoyne P. R. C. and Vykoukal J., Electrophoresis 23, 1973 (2002). [DOI] [PMC free article] [PubMed] [Google Scholar]
- Minerick A. R., Zhou R., Takhistov P., and Chang H.-C., Electrophoresis 10.1002/elps.200305644 24, 3703 (2003). [DOI] [PubMed] [Google Scholar]
- Yang S., Ündar A., and Zahn J. D., Lab Chip 6, 871 (2006). [DOI] [PubMed] [Google Scholar]
- Svanes K. and Zweifach B. W., Microvasc. Res. 1, 210 (1968). [Google Scholar]
- Fung Y.-C., Microvasc. Res. 5, 34 (1973). [DOI] [PubMed] [Google Scholar]
- Yen R. T. and Fung Y.-C., Am. J. Physiol. Heart Circ. Physiol. 235, H251 (1978). [Google Scholar]
- Loeb L. B., Electrical Corona (University of California, Berkeley, 1965). [Google Scholar]
- Ohyama R.-I., Kaneko K., and Chang J.-S., IEEE Trans. Dielectrics Elec. Ins. 10, 57 (2003). [Google Scholar]
- Kawamoto H. and Umezu S., J. Phys. D 10.1088/0022-3727/38/6/017 38, 887 (2005). [DOI] [Google Scholar]
- Yeo L. Y., Hou D., Maheshswari S., and Chang H.-C., Appl. Phys. Lett. 10.1063/1.2212275 88, 233512 (2006). [DOI] [Google Scholar]
- Einstein A., Naturwiss. 10.1007/BF01510300 14, 223 (1926). [DOI] [Google Scholar]
- Yeo L. Y., Friend J. R., and Arifin D. R., Appl. Phys. Lett. 10.1063/1.2345590 89, 103516 (2006). [DOI] [Google Scholar]
- Gorbet M. B., Yeo E. L., and Sefton M. V., J. Biomed. Mater. Res. 44, 289 (1999). [DOI] [PubMed] [Google Scholar]
- Yang S., Ündar A., and Zahn J. D., ASAIO J. 51, 585 (2005). [DOI] [PubMed] [Google Scholar]
- Arifin D. R. and Palmer A. F., Biotechnol. Prog. 9, 1798 (2003). [DOI] [PubMed] [Google Scholar]
- Zijlstra W. G. and van Kampen E., Clin. Chim. Acta 5, 719 (1960). [DOI] [PubMed] [Google Scholar]
- van Kampen E. and Zijlstra W. G., Clin. Chim. Acta 10.1016/0009-8981(61)90145-0 6, 538 (1961). [DOI] [PubMed] [Google Scholar]
- Batchelor G. K., Q. J. Mech. Appl. Maths 4, 29 (1951). [Google Scholar]
- Pau H.-P., Phys. Lett. 15, 4 (1972). [Google Scholar]
- Chang H.-C. and Yeo L. Y. (unpublished).
- Schouveiler L., Le Gal P., Chauve M. P., and Takeda Y., Exp. Fluids 10.1007/s003480050278 26, 179 (1999). [DOI] [Google Scholar]
- Serre E., Crespo del Arco E., and Bontoux P., J. Fluid Mech. 10.1017/S0022112001003494 434, 65 (2001). [DOI] [Google Scholar]
- Hou D., Maheshswari S., and Chang H.-C., Biomicrofluidics (submitted).


