

Abstract
Background and purpose
Women face a higher mortality after stroke and have different risk factors than men. Despite educational campaigns, women continue to underestimate their own risk for stroke. We present a theoretical model to understand risk perception in high-risk women.
Methods
805 women, ages 50 to 70, were selected from the University of Connecticut Cardiology Center with at least one risk factor for stroke. A five-part questionnaire addressed stroke knowledge, risk perception, risk factors, access to health care and demographics. 215 women responded by mail (28% response rate) and de-identified data was entered in SPSS. Descriptive, bivariate and multivariate techniques assessed the proposed model.
Results
The cohort was predominantly white (91.5%), higher income (33.1% of the population earned >$75,000) and well-educated (28.6% attended graduate or professional school). Only 7 of the 37 (18.9%) women with atrial fibrillation and 11 out of the 71 women with heart disease (15.5%) identified their health condition as a risk factor for stroke. Predictors of risk perception included: other women’s risk (B=.336, p<.001), worrying about stroke (B=.734, p<.001), having hypertension (B=.686, p=.037) and diabetes (B=.893, p=.004). Only 63.9% of women with atrial fibrillation (n=23) reported taking warfarin.
Conclusions
Women were often unable to identify their health condition as a risk factor for stroke. In addition, many women were not undertaking primary prevention behaviors. Risk perception was low, and high risk women perceived their risk of stroke to be the same as their peers. Educational strategies must advocate for and target high-risk women.
Keywords: Organized Stroke Care, Prevention, Psych & Behavior, Public Policy, Women & Minorities, Risk Perception
Stroke is the third leading cause of morbidity and mortality in both men and women, behind heart disease and cancer1. The incidence of stroke is approximately the same in men and women; however, after the age of 75, the incidence of stroke is much greater in women1–3. The lifetime risk of stroke is greater in women, which may be explained in part by women’s increased life expectancy4. The two-year recurrence rate for stroke was significantly higher in women in a high-risk population with symptomatic intracranial arterial stenosis5. Although there has been a decline in mortality rates for stroke in men, this advance is not as evident in women explaining the alarming statistic that over 67% of stroke deaths now occur in women1,2.
Disability and functional outcomes also appear worse in women as they more likely to require institutional care after a stroke compared to age-matched men3, adding significantly to the economic burden of stroke. In addition differences in the acute management of stroke patients have been documented, with women experiencing greater emergency department wait times and less diagnostic testing6. The risk profiles for men and women for stroke also differ, with men being much more likely to have the risk factors of heart disease and smoking, with women more likely to be hypertensive and have atrial fibrillation7. It is uncertain whether the varying risk factor profiles are more reflective of biological differences, or of lifestyle differences between the two groups.
Recently, investigators documented a midlife stroke surge in women ages 45 to 548, an age group traditionally at low risk for stroke. This difference was attributed to an increase in risk factors related to the metabolic syndrome such as increased in abdominal girth and diabetes. These results suggest that there is a need for targeted primary prevention in the peri-menopausal age group. The factors of estrogen and pregnancy are modulators of vasculature. Because of recent publicity about hormone replacement therapy and heart disease and stroke, this group may be particularly receptive to education initiatives.
The objective of the current study was to integrate theory from social science research to understand knowledge of stroke risk factors and warning signs as well as risk perception of stroke in middle-age women with at least one risk factor for stroke.
Methods
Research model
A model was developed to show predicted relationships between studied variables (Figure 1). The key independent variables were personal risk factors and knowledge or risk factors. Perception of risk was the major dependent variable.
Figure 1. Research model.
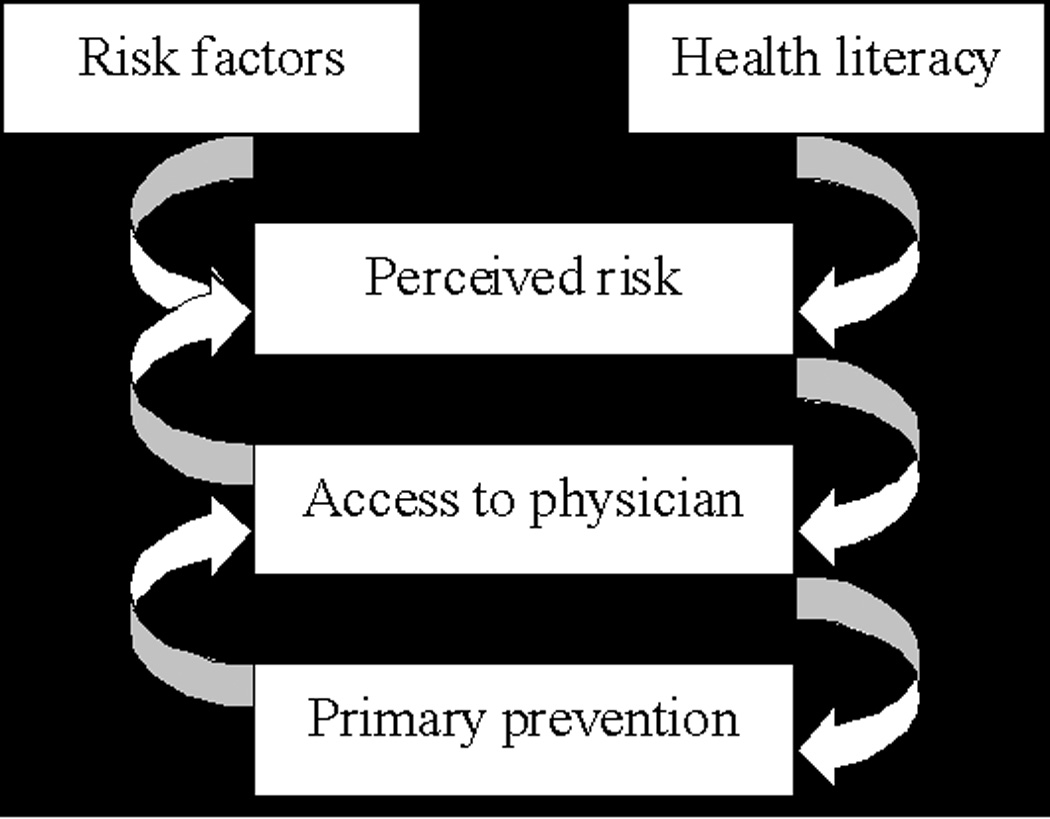
We hypothesized that a woman’s risk factors for stroke and risk perception, as well as her access to medical care, would mediate the success of primary prevention measures. We also predicted that health literacy measures, such as education and knowledge of stroke warning signs/risk factors would predict perceived risk.
Participants
The University of Connecticut and the Hartford Hospital Institutional Review Board approved the study. 805 female patients, ages 50 to 70, from the University of Connecticut Cardiology Center (ages 50 to 70) were selected from the following ICD-9 billing codes: 250.0; 272.4; 401.1; 401.9; 410.1; 410.4; 411.1; 413.9; 414.0; 414.9; 427.31; 436.0; 440.21 and 443.9. The women received the survey in two separate mailings, with 37 envelope returned for incorrect addresses. 129 women responded to the first mailing, and an additional 86 responded to the second mailing, for a total of 215 returned (28% response rate).
Questionnaire
A 36-item, five-part questionnaire was developed using elements from prior surveys about knowledge, warning signs9–11 and risk perception12–14. Section one asked about knowledge of warning signs and risk factors for stroke. Section two addressed risk perception and section three asked about personal risk factors. Section four addressed indicators for access to health care and section five inquired about socio-demographic factors.
Women were asked to list up to five warning signs for stroke, for which coded answers included: weakness or numbness, vision changes loss of balance or dizziness, headache, confusion and speech problems (Figure 2A). Women were asked to identify up to seven modifiable risk factors for stroke, of which there were eleven coded responses (Table 2B). Coded responses were determined after analyzing frequencies of responses and identifying reasonable groupings. Personal risk factors were identified, including: hypertension, high cholesterol, atrial fibrillation, heart disease, diabetes, stroke or transient ischemic event (TIA), carotid artery stenosis and smoking (current and former). Perception of risk was asked on a 10-point visual analogue scale. Subjects rated their perceived personal risk and that of other women. Women were asked how often they worried about stroke. In addition, subjects answered questions about personal health conditions and risk factors, access to medical care, and demographic information.
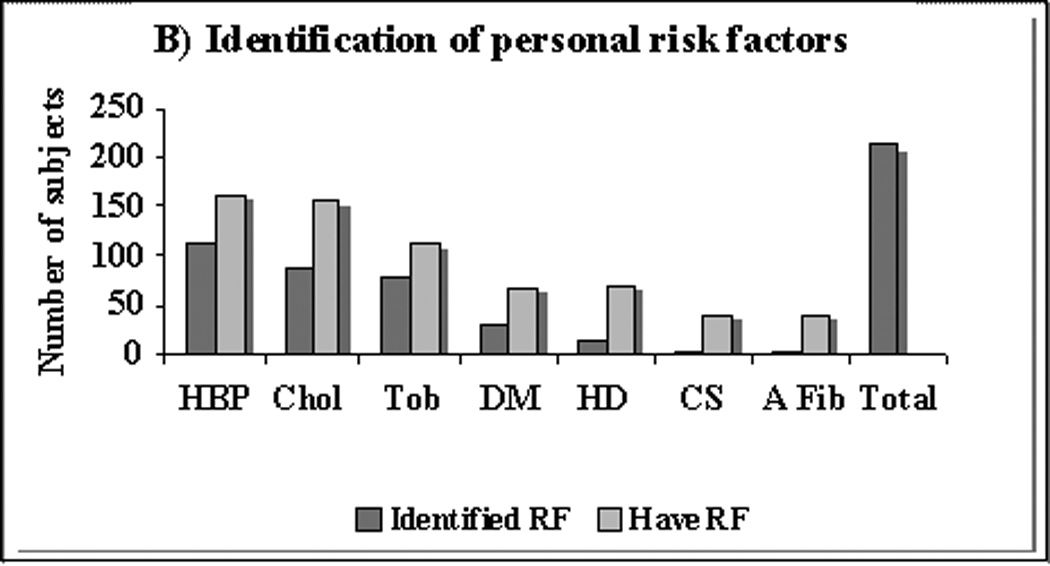
Figure 2. A) Warning signs of stroke and B) Identification of personal risk factors.
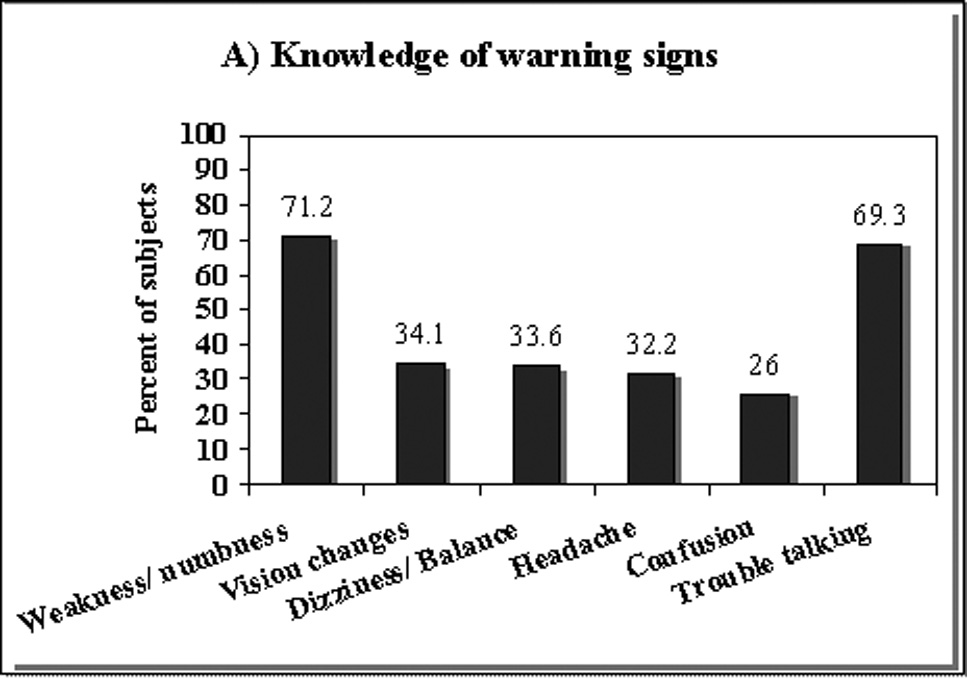
A) Shown is the percentage of women who identified a particular warning sign for stroke. Subjects were asked to list up to five warning signs. Only the above responses were coded.
B) RF=risk factor; HBP=high blood pressure; Chol=high cholesterol; Tob=lifetime tobacco use; DM=Diabetes Mellitus; HD/MI=heart disease or myocardial infarction; CS=carotid stenosis; A Fib =atrial fibrillation; Total= # women responding
The dark grey bar identifies the number of women who had the particular risk factor and identified it as a risk factor for stroke. The light grey bar is the number of women responding to the question. The difference between the two bars is the number of women with a particular risk factor who did not identify it as a risk factor for stroke.
Table 2.
A) Presence of risk factors and B) Identification of risk factors
| A) Have Risk Factor | N | % | B) Identified Risk Factor | N | % |
|---|---|---|---|---|---|
| Hypertension | 162 | 76.4 | Hypertension | 154 | 71.6 |
| High cholesterol | 157 | 77.3 | Smoking | 135 | 62.8 |
| Smoke ever | 111 | 52.4 | Overweight | 122 | 56.7 |
| Diabetes | 68 | 32.5 | High cholesterol | 116 | 54 |
| Angina/coronary artery disease | 55 | 27 | Lack of exercise | 102 | 47.4 |
| Atrial fibrillation | 37 | 17.8 | Diabetes | 78 | 36.3 |
| Carotid stenosis | 37 | 17.9 | Poor diet | 74 | 34.4 |
| Prior heart attack | 36 | 17.1 | Increased stress | 46 | 21.5 |
| Prior stroke/TIA | 23 | 11.1 | Heart disease/CAD | 35 | 16.3 |
| Smoke currently | 15 | 7.1 | Carotid stenosis/ atherosclerosis | 16 | 7.9 |
| Atrial fibrillation | 7 | 3.3 |
Surveys were returned in provided envelopes and did not contain any identifying personal information. De-identified data was entered in Statistical Program for the Social Sciences (SPSS). Warning signs and risk factors were coded as nominal responses, while risk perception remained a scale variable. Descriptives, such as frequencies and means, were examined to interpret results. Bivariate correlations were assessed with risk perception and length of time since a primary care office visit as dependent variables. Relationships that were significant at the p<. 05 level were included as independent variables in multivariate analysis. Linear regression was performed using the ENTER method; independent variables were added as a group to the model and analyzed using standard multiple regression. In this technique, a variable is assessed to determine what it adds to the prediction of the dependent variable that is different from the predictability afforded by other independent variables. This is in contrast to sequential (or hierarchical) and stepwise regression techniques, where the order of entry of variables is determined by the researcher and subject to interpretation. In standard multiple regression, it is possible for an independent variable to appear unimportant to the solution when it is actually highly correlated. For this reason, the full correlation and the semipartal correlation (Table 3B) were considered. In the semipartial correlation, the contribution of other independent variables is taken out of the independent variable of interest so that only this variable’s contribution is assessed. The semipartial correlation is related to the change in R2 when a variable is added to an equation, so that the higher the number, the more important the variable’s contribution is to the correlation coefficient.
Table 3.
A) Perception of risk and B) Multivariate analysis: Predictors of Risk Perception *ENTER method
Perception of risk was the dependent variable. Variables included in model but with B values not significant include: perceived health; prior stroke; prior TIA; carotid artery stenosis; smoking (100 lifetime); and HMO coverage. As can be seen, worrying about stroke was the most significant predictor of risk perception, followed by perceiving that other women are at risk for stroke. A woman having either hypertension or diabetes contributed moderately to the dependent variable. Notable omissions in the model include socio-demographic characteristics, stroke knowledge of warning signs and risk factors, which was not significant under bivariate correlations.
| A) | Mean +/− SD | N | % | ||
|---|---|---|---|---|---|
| Mean risk perception | 5.7 +/− 2.3 | ||||
| (scale 1 to 10) | |||||
| Perception of other women’s risk (scale 1 to 10) | 5.5+/−1.7 | ||||
| Worry about stroke | |||||
| Never/rarely | 147 | 71.0 | |||
| Sometimes/frequently | 60 | 29.0 | |||
| Perceived Health | |||||
| Poor/fair | 74 | 35.4 | |||
| Good/excellent | 135 | 64.6 | |||
| B) | B | p | Confidence Interval | Semipartial Correlation | |
| Other women’s risk of stroke | .336 | <.001 | .175 to .498 | .249 | |
| Worry about stroke | .734 | <.001 | .422 to 1.045 | .282 | |
| Have hypertension | .686 | .037 | .043 to 1.330 | .128 | |
| Have diabetes | .893 | .004 | .298 to 1.489 | .090 | |
The B value reflects the slope of the regression line, as determined by the contributions of each significant independent variable. A B value greater than zero represents a positive correlation, with a larger number indicating a more robust relationship. A B value less than zero indicates and inverse relationship, with a more negative number indicating a more robust relationship. The p value evaluates the unique variance that an independent variable adds to the regression coefficient, and thus an important independent variable that shares variance with another independent variable may be insignificant in the analysis. The 95% confidence intervals for the B value were also included (Table 3B) to show that the slope did not cross zero.
Results
Sample Characteristics (Table 1)
Table 1.
Sample characteristics
| Sample Characteristics | N | % |
|---|---|---|
| Mean age (years) | 63.0 +/− 7.2 | |
| Race | ||
| White | 194 | 91.5 |
| Black | 12 | 5.6 |
| Other | 6 | 2.9 |
| Marital Status | ||
| Married | 124 | 57.9 |
| Divorced/Separated | 44 | 21.5 |
| Widowed | 24 | 11.2 |
| Never Married | 22 | 10.3 |
| Income | ||
| <$25,000 | 42 | 21.6 |
| $25,000 to 34,999 | 22 | 11.3 |
| $35,000 to 49,999 | 22 | 11.3 |
| $50,000 to 74,999 | 44 | 22.7 |
| $75,000+ | 64 | 33.1 |
| Education | ||
| Some high school or less | 17 | 8 |
| High school diploma or GED | 43 | 20.2 |
| Some college or trade school | 47 | 22.1 |
| College degree | 45 | 21.1 |
| Graduate or professional school | 61 | 28.6 |
Women ranged in age from 50 to 73, with a mean age of 63.0 years (SD7.2). The majority of the sample was white (91.5%). 33.1% of the population earned more than $75,000 annually and 28.6% of the population had attended graduate or professional school.
Stroke Knowledge and Risk Factors
Women identified an average of 2.7 (SD 1.6) out of 6 possible warning signs (Figure 2A). While 71.2% of women identified weakness or numbness as a warning sign, approximately one third of respondents named vision changes (34.1%), dizziness or balance problems (33.6%), headache (32.2%) or confusion (26%) as a warning sign. 69.3% of women identified trouble speaking as a warning sign.
Patient’s risk factors for stroke are shown in Table 2A. Women also were asked to identify any risk factors for stroke (Table 2B). An average of 3.9 (SD 1.8) out of eleven coded modifiable risk factors were identified. Only 3.3% of women (n=7) identified atrial fibrillation as a risk factor for stroke. Heart disease was identified as a risk factor 16.3% of the time (n=35). Women often did not identify their own risk factors as placing them at risk for stroke (Figure 2B). For example, only 7 of the 37 (18.9%) women with atrial fibrillation and 11 out of the 71 women with heart disease (15.5%) identified their own health condition as a risk factor.
Stroke knowledge, measured by number of stroke warning signs and risk factors identified, did not correlate with worrying about stroke or risk perception in bivariate analysis.
Perception of risk
Mean perception of risk was 5.7 (SD 2.3, 10-point scale) and perception of other women’s risk was rated as 5.5 (SD 1.7, 10-point scale) (Table 3A). Women saw their risk to be similar to that of their peers. A majority of women worry about stroke rarely or never, while one-third of women worry about stroke sometimes or frequently. 64.6% of women perceived their health as good or excellent.
Predictors of risk perception in multivariate analysis included: other women’s risk of stroke (B=.336, p<.001), worrying about stroke (B=.734, p<.001) and having hypertension (B=.686, p=.037) and diabetes (B=.893, p=.004). Variables included in the model showed a significant correlation with bivariate analysis. The following variables were not significant in the model: perceived health; prior stroke; prior TIA; carotid artery stenosis; smoking (at least 100 lifetime cigarettes); and HMO coverage (Table 3B).
Access to Health Care
The majority of the sample had health insurance, prescription coverage and a primary care doctor. However, even in this population, 9.9% of women (n=21) reported being unable to attend a medical appointment because of cost, and 17.8% of women (n=37) reported being unable to take a medication because of cost. Women had seen their primary care physician an average of 7.5 months prior, with a range from 0 to 84 months. The average office co-pay was $16.97 (SD $31.90) and the average spent per month on prescriptions was $97.49 (SD $157.24).
In multivariate analysis, having prescription coverage (B=−41.803, p<.001) and a primary care provider (B=−10.391, p=.017) was inversely related to the length of time since an office visit. Statistically significant in bivariate correlations but not in the model were: having health insurance; being unable to see doctor of cost (in the past 12 months) and amount of office visit co-pay. Those who lack prescription coverage and a primary care provider are more likely to have increased time in between office visits. There was no significant relationship for number of health conditions and length of time since seeing a physician.
Primary Prevention
Several aspects of primary prevention were addressed in this survey. 86.6% (n=136) of hypertensive patients reported good control, with blood pressures less than 140/90. Over half of women (52.4%, n=111) had smoked over 100 cigarettes in their lifetime, but only 7.1% of women (n=15) still smoked. 62.1% (n=41) of diabetics reported having an A1C less than 6.5%. Only 63.9% of women with atrial fibrillation (n=23) reported taking warfarin. Cholesterol control was defined as an LDL of less than 100, and 68.3% (n=97) patients reported obtaining this goal. 62.6% (n=132) of subjects reported taking daily aspirin, while 22.2% (n=46) had a medical condition that made taking aspirin unsafe.
Discussion
This survey analysis found that a group of high-risk women have low perception of their personal risk for stroke and that they do not perceive their risk to be different from other women. In light of recent data that shows a stroke surge in women ages 45 to 548, this may be the group who most serves to gain from primary prevention efforts. The lack of knowledge and risk perception in this population is a strong call to action to make stroke education a priority for women of all racial/ethnic and socio-economic backgrounds.
Stroke Knowledge of warning signs and risk factors
Health literacy was measured in our model (Figure 1) by stroke knowledge of warning signs and risk factors as well as correctly identifying personal health conditions as stroke risk factors. Low knowledge of risk factors and warning signs for stroke has been documented in large-scale surveys9,15–18. People are generally able to name risk factors such as stress, high blood pressure, diet and smoking as a cause of stroke, but do not identify health conditions such as atrial fibrillation or diabetes. Our data supported these findings. Knowledge of warning signs is still lacking in many at risk populations, which may directly affect emergency room arrival times16.. Many women listed warning signs such as chest pain, or arm pain, suggesting that confusion remains about the difference between a stroke and a heart attack.
In one study, knowledge of a risk factor was shown to be superior in those affected by it19. Our results suggest that this is not the case in our population. Surprisingly persons with atrial fibrillation or carotid stenosis often did not identify these conditions as a risk factor for stroke, even though they are known to dramatically increase risk. Stroke knowledge has been shown to be poorest in groups at highest risk9,10 and these groups represent missed opportunities for primary prevention.
Perception of Risk
Risk perception, as is suggested by the Health Belief Model (HBM), is a key element in understanding how persons become motivated to change health behaviors20. Many factors such as: education, presence of disease specific symptoms, media campaigns, physician or peer recommendations, socio-economic variables or cultural beliefs can influence the likelihood of behavioral change. This model can be used to study the primary prevention of stroke, in that individual risk perception may modulate primary prevention measures such as blood pressure control, medication adherence or behavioral and lifestyle changes. In assessment of our model, stroke knowledge of risk factors or warning signs did not predict perception of risk. The number of risk factors also did not correlate with risk perception. This suggests that risk perception is a subjective measure, which is not entirely modulated by stroke knowledge or actual risk.
Breast cancer campaigns targeted at women, such as “Race for the Cure”21 and the pink ribbon campaign are an example of a successful education and outreach initiative that has increased risk perception. Women perceive breast cancer to be one of the largest health concerns they face today, despite the fact that six times more women die of stroke and heart disease1. Patient’s perception of high self-risk has been shown to be a reliable predictor of mammography screening rates22. Most women do not perceive stroke or heart disease to be a major health concern and report that they are not well informed about their risk15. The American Heart Association recent campaign “Go Red for heart disease” may serve as a vehicle to increase risk perception about heart disease and stroke.
Access to health care
The patient population studied had increased access, considering that they had received specialty care within the past year at a Cardiology practice. However, even in this select population, there were barriers to optimal care. A proportion of women reported being unable to see a physician for a scheduled appointment in the past year because of cost. Whether this was a primary care visit or specialty visit was not reported. An even greater percentage was unable to take a medication because of cost in the past year. Efforts in education and increasing risk perception are undermined if high-risk populations are unable to obtain the advice, or the medications that are essential to reducing their stroke risk factors. Surprisingly, perception of risk was not related to access to a physician, or length of time since follow-up. This suggests that specialty physicians, treating conditions such as hypertension, diabetes and heart disease, are not emphasizing patient’s stroke risk in clinical encounters.
Primary prevention
Primary prevention is the goal, and the final step in our model, which is intrinsically dependent on access to care and adherence to treatment. In women, it has been shown that a healthy lifestyle, consisting of low body mass index, abstinence from smoking, moderate consumption of alcohol and health diet and regular exercise were associated with a lower incidence of ischemic and total stroke1. This survey did not address health outcomes, but even in this patient population who seeks regular specialty care, there were still women smoking, not taking aspirin with no contraindication not to do so, and with poorly controlled hypertension and cholesterol. Most surprisingly, more than a third of our sample with atrial fibrillation reported not taking warfarin. This population may represent a mix of women with true contraindications to warfarin use as well as reflect patients for whom physicians are averse to prescribing anticoagulation therapy. This is despite evidence that patients with a stroke and a history of atrial fibrillation, the majority are sub-therapeutic or not taking warfarin at the time of their event23. In addition, women with atrial fibrillation have higher rates of off-warfarin thromboembolic risk compared to men24, placing them at higher risk.
There are several limitations of this study. As in all survey studies, there was a selection bias for women that returned the survey. Women were predominately white, and living in a suburban area and whether these results can be extended to a more urban, ethnically diverse population is unknown. It would be expected that barriers to primary prevention would be greater in such populations. In addition, all women were asked to identify warning signs and risk factors without any prompting, which would tend to underreport what women actually know. The benefit of this method is that there is a sense of relationships that women have between health and behavior, without cues. It is also possible that women do not identify medical terms such as “atrial fibrillation” unless they themselves have the condition.
Public Health Significance
Peri-menopausal women have an increasing level of risk factors related to the metabolic syndrome and increased stroke rates, compared to men8. To reduce stroke risk, this population must be motivated to produce behavioral change. Risk perception is a parameter that is separate from stroke knowledge and presence of personal risk factors. This parameter may predict the likelihood of behavioral change for primary prevention efforts for reducing stroke risk, such as obtaining blood pressure goals, maintaining A1C below an acceptable level, quitting smoking, or increasing exercise. Our study shows that risk perception for stroke is generally low, and that women often do not identify their personal health conditions placing them at increased risk. Future education campaigns should target risk perception as an outcome measure to move toward reducing the burden that stroke places on all communities.
Acknowledgements and Funding
This project has been funded by the Northeast Cerebrovascular Consortium (NECC) and the NIH RO1 NS050505 and NS055215. The authors would like to acknowledge the contributions of William White, MD who facilitated the use of the patient population and Nancy Petry, PhD who provided consultation on methodology and research methods. Ilene Staff, PhD, Senior Scientist, Research Program at Hartford Hospital provided consultation on statistical methods.
References
- 1.Rosamond W, Flegal K, Furie K, Go A, Greenlund K, Haase N, Hailpern SM, Ho M, Howard V, Kissela B, Kittner S, Lloyd-Jones D, McDermott M, Meigs J, Moy C, Nichol G, O'Donnell C, Roger V, Sorlie P, Steinberger J, Thom T, Wilson M, Hong Y. American Heart Association Statistics Committee and Stroke Statistics Subcommittee. Heart disease and stroke statistics--2008 update: a report from the American Heart Association Statistics Committee and Stroke Statistics Subcommittee. Circulation. 2008;117(4):e25–e146. doi: 10.1161/CIRCULATIONAHA.107.187998. [DOI] [PubMed] [Google Scholar]
- 2.Reeves MJ, Bushnell CD, Howard G, Gargano JW, Duncan PW, Lynch G, Khatiwoda A, Lisabeth L. Sex differences in stroke: epidemiology, clinical presentation, medical care, and outcomes. Lancet Neurol. 2008;7(10):915–926. doi: 10.1016/S1474-4422(08)70193-5. [DOI] [PMC free article] [PubMed] [Google Scholar]
- 3.Turtzo LC, McCullough LD. Sex differences in stroke. Cerebrovasc Dis. 2008;26(5):462–474. doi: 10.1159/000155983. [DOI] [PMC free article] [PubMed] [Google Scholar]
- 4.Seshadri S, Beiser A, Kelly-Hayes M, Kase CS, Au R, Kannel WB, Wolf PA. The lifetime risk of stroke: estimates from the Framingham Study. Stroke. 2006;37(2):345–350. doi: 10.1161/01.STR.0000199613.38911.b2. [DOI] [PubMed] [Google Scholar]
- 5.Williams JE, Chimowitz MI, Cotsonis GA, Lynn MJ, Waddy SP WASID Investigators. Gender differences in outcomes among patients with symptomatic intracranial arterial stenosis. Stroke. 2007;38(7):2055–2062. doi: 10.1161/STROKEAHA.107.482240. [DOI] [PubMed] [Google Scholar]
- 6.Smith MA, Lisabeth LD, Brown DL, Morgenstern LB. Gender comparisons of diagnostic evaluation for ischemic stroke patients. Neurology. 2005;65(6):855–858. doi: 10.1212/01.wnl.0000176054.72325.0f. [DOI] [PubMed] [Google Scholar]
- 7.Bushnell CD. Stroke and the female brain. Nat Clin Pract Neurol. 2008;4(1):22–33. doi: 10.1038/ncpneuro0686. [DOI] [PubMed] [Google Scholar]
- 8.Towfighi A, Saver JL, Engelhardt R, Ovbiagele B. A midlife stroke surge among women in the United States. Neurology. 2007;69(20):1898–1904. doi: 10.1212/01.wnl.0000268491.89956.c2. [DOI] [PubMed] [Google Scholar]
- 9.Pancioli AM, Broderick J, Kothari R, Brott T, Tuchfarber A, Miller R, Khoury J, Jauch E. Public perception of stroke warning signs and knowledge of potential risk factors. JAMA. 1998;279(16):1288–1292. doi: 10.1001/jama.279.16.1288. [DOI] [PubMed] [Google Scholar]
- 10.Reeves MJ, Hogan JG, Rafferty AP. Knowledge of stroke risk factors and warning signs among Michigan adults. Neurology. 2002;59(10):1547–1552. doi: 10.1212/01.wnl.0000031796.52748.a5. [DOI] [PubMed] [Google Scholar]
- 11.Behavioral Risk Factor Surveillance Survey. [Accessed on 11/14/2008];Centers for Disease Control. 2007 < http://www.cdc.gov/brfss/questionnaires/english.htm>.
- 12.Woloshin S, Schwartz LM, Black WC, Welch HG. Women's perceptions of breast cancer risk: how you ask matters. Med Decis Making. 1999;19(3):221–229. doi: 10.1177/0272989X9901900301. [DOI] [PubMed] [Google Scholar]
- 13.Taylor KL, Shelby RA, Schwartz MD, Ackerman J, LaSalle VH, Gelmann EP, McGuire C. The impact of item order on ratings of cancer risk perception. Cancer Epidemiol Biomarkers Prev. 2002;11(7):654–659. [PubMed] [Google Scholar]
- 14.Gurmankin Levy A, Shea J, Williams SV, Quistberg A, Armstrong K. Measuring perceptions of breast cancer risk. Cancer Epidemiol Biomarkers Prev. 2006;15(10):1893–1898. doi: 10.1158/1055-9965.EPI-05-0482. [DOI] [PubMed] [Google Scholar]
- 15.Mosca L, Jones WK, King KB, Ouyang P, Redberg RF, Hill MN American Heart Association Women's Heart Disease and Stroke Campaign Task Force. Awareness, perception, and knowledge of heart disease risk and prevention among women in the United States. Arch Fam Med. 2000;9(6):506–515. doi: 10.1001/archfami.9.6.506. [DOI] [PubMed] [Google Scholar]
- 16.Sug Yoon S, Heller RF, Levi C, Wiggers J, Fitzgerald PE. Knowledge of stroke risk factors, warning symptoms, and treatment among an Australian urban population. Stroke. 2001;32(8):1926–1930. doi: 10.1161/01.str.32.8.1926. [DOI] [PubMed] [Google Scholar]
- 17.Schneider AT, Pancioli AM, Khoury JC, Rademacher E, Tuchfarber A, Miller R, Woo D, Kissela B, Broderick JP. Trends in community knowledge of the warning signs and risk factors for stroke. JAMA. 2003;289(3):343–346. doi: 10.1001/jama.289.3.343. [DOI] [PubMed] [Google Scholar]
- 18.Al Shafaee MA, Ganguly SS, Al Asmi AR. Perception of stroke and knowledge of potential risk factors among Omani patients at increased risk for stroke. BMC Neurol. 2006;6:38. doi: 10.1186/1471-2377-6-38. [DOI] [PMC free article] [PubMed] [Google Scholar]
- 19.Kraywinkel K, Heidrich J, Heuschmann PU, Wagner M, Berger K. Stroke risk perception among participants of a stroke awareness campaign. BMC Public Health. 2007;7:39. doi: 10.1186/1471-2458-7-39. [DOI] [PMC free article] [PubMed] [Google Scholar]
- 20.Glanz K, Rimer BK, Viswanath K, editors. Health Behavior and Health Education: Theory, Research, and Practice. Fourth Edition. San Francisco: Jossey-Bass, Inc.; 2008. [Google Scholar]
- 21.Susan G. [Accessed on 11/14/2008];Komen Breast Cancer Foundation. < http://www.nationalraceforthecure.org/>.
- 22.Klein WM, Stefanek ME. Cancer risk elicitation and communication: lessons from the psychology of risk perception. CA Cancer J Clin. 2007;57(3):147–167. doi: 10.3322/canjclin.57.3.147. [DOI] [PubMed] [Google Scholar]
- 23.Gladstone DJ, Bui E, Fang J, Laupacis A, Lindsay MP, Tu JV, Silver FL, Kapral MK. Potentially Preventable Strokes in High-Risk Patients With Atrial Fibrillation Who Are Not Adequately Anticoagulated. Stroke. 2008 doi: 10.1161/STROKEAHA.108.516344. [DOI] [PubMed] [Google Scholar]
- 24.Fang MC, Singer DE, Chang Y, et al. The Anticoagulation and Risk Factors in Atrial Fibrillation (ATRIA) study. Gender differences in the risk of ischemic stroke and peripheral embolism in atrial fibrillation. Circulation. 2005;112:1687–1691. doi: 10.1161/CIRCULATIONAHA.105.553438. [DOI] [PMC free article] [PubMed] [Google Scholar]