

Abstract
The Ca2+ channel α1S subunit (CaV1.1) is the voltage sensor in skeletal muscle excitation-contraction (EC) coupling. Upon membrane depolarization, this sensor rapidly triggers Ca2+ release from internal stores and conducts a slowly activating Ca2+ current. However, this Ca2+ current is not essential for skeletal muscle EC coupling. Here, we identified a CaV1.1 splice variant with greatly distinct current properties. The variant of the CACNA1S gene lacking exon 29 was expressed at low levels in differentiated human and mouse muscle, and up to 80% in myotubes. To test its biophysical properties, we deleted exon 29 in a green fluorescent protein (GFP)-tagged α1S subunit and expressed it in dysgenic (α1S-null) myotubes. GFP-α1SΔ29 was correctly targeted into triads and supported skeletal muscle EC coupling. However, the Ca2+ currents through GFP-α1SΔ29 showed a 30-mV left-shifted voltage dependence of activation and a substantially increased open probability, giving rise to an eightfold increased current density. This robust Ca2+ influx contributed substantially to the depolarization-induced Ca2+ transient that triggers contraction. Moreover, deletion of exon 29 accelerated current kinetics independent of the auxiliary α2δ-1 subunit. Thus, characterizing the CaV1.1Δ29 splice variant revealed the structural bases underlying the specific gating properties of skeletal muscle Ca2+ channels, and it suggests the existence of a distinct mode of EC coupling in developing muscle.
Introduction
The voltage-gated Ca2+ channel CaV1.1 functions as a voltage sensor in skeletal muscle excitation-contraction (EC) coupling. It is located in triad junctions in close apposition to the Ca2+ release channel (type 1 ryanodine receptor (RyR1)) in the sarcoplasmic reticulum (SR). On depolarization of the surface membrane, CaV1.1 undergoes a conformational change that rapidly activates the Ca2+ release channel, presumably via protein-protein interactions. Ca2+ influx through the voltage-gated Ca2+ channel is not required for activation of skeletal muscle EC coupling. As a matter of fact, L-type Ca2+ currents through CaV1.1 activate very slowly and at more positive membrane potentials than EC coupling (for review, see Melzer et al. (1)). Therefore, it is unlikely that during a short skeletal muscle action potential Ca2+ channels contribute significant amounts of Ca2+ to the transients that trigger contraction.
Multiple splice variants greatly enrich the functional diversity of the CACNA1 gene family and the splicing patterns are conserved across different members of this gene family and across various species (2). Splicing has been extensively studied for the cardiac CaV1.2 encoded by CACNA1C (3–8) and for the neuronal CaV2.1 (CACNA1A) and CaV2.2 (CACNA1B) (9–11). In contrast, only one CaV1.1 splice variant has so far been described in rabbit skeletal muscle. Skipping of exon 29 (5) shortens the extracellular loop connecting transmembrane domains IVS3 and IVS4. This loop is a conserved splicing site of CaV1 α1 subunits that has been shown to generate differentially distributed and functionally distinct channel variants. For example, the CaV1.3 and CaV2.2 IVS3–IVS4 splice variants are expressed in different regions of the cardiovascular system and the nervous system, respectively (11,12), and skipping of the corresponding exon in the smooth muscle variant of CaV1.2 resulted in a channel with increased voltage and drug sensitivity (13). For the skeletal muscle CaV1.1, the functional consequence of exon skipping in IVS3–IVS4 or the specific expression patterns of this splice variant have hitherto not been analyzed.
In this study, we describe CaV1.1 splice variants transcribed in human adult muscle and in muscle cell cultures. Because the variant lacking exon 29 (CaV1.1Δ29) was predicted to code for a functional channel and was abundantly expressed in myotubes, we performed a thorough analysis of its biophysical properties. Reconstitution of dysgenic (CaV1.1-null) myotubes with CaV1.1Δ29 fully restored skeletal muscle EC coupling, however, with Ca2+ currents eight times larger and activating at 30 mV less depolarizing potentials than CaV1.1 with exon 29. Thus, the analysis of the CaV1.1Δ29 splice variant identified the IVS3–IVS4 loop as the structural basis of the weak voltage sensitivity of the full-length skeletal muscle Ca2+ channels. Furthermore, our results indicate that in muscle cells expressing this newly characterized channel variant, Ca2+ influx contributes significantly to the cytoplasmic Ca2+ signal that triggers skeletal muscle contraction.
Materials and Methods
Detection of splice variants
Muscle biopsies (Vastus lateralis of five control subjects with their informed consent) were shredded and trypsinized for 30 min at 37°C. Satellite cells were isolated by filtration (nylon filter, 0.22 μm) and cultured in skeletal muscle growth medium (PromoCell, Heidelberg, Germany). After 10–14 days, the medium was changed to a differentiation medium (PromoCell). Mature myotubes (those with more than five nuclei) were obtained after an additional 1–2 weeks. Total RNA was extracted from homogenized mouse muscle tissues and cultured myotubes using TRIzol reagent (Gibco BRL, Gaithersburg, MD) according to the manufacturer's protocol. Reverse transcription polymerase chain reaction (RT-PCR) amplification was carried out with a one-step RT-PCR kit (Qiagen, Hilden, Germany) and overlapping primer pairs (see Table S3 in Supplementary Material). DNA fragments of splice variants were separated by 2% agarose gel electrophoresis and stained with ethidium bromide (0.7 mg/ml). Size and intensity of PCR bands were quantified using Scion Image 4.0.3.2 (Scion, Frederick, MD). DNA sequences of splice variants were confirmed sequencing (BIG Dye Terminator Cycle Sequencing Kits, Applied Biosystems, Foster City, CA).
Quantitative TaqMan PCR
Total RNA was isolated from differentiated myotubes from a skeletal muscle cell line derived from H2-KB-TSA58 mice (Immortomice (14,15)) using the RNeasy Mini kit (Qiagen) and reverse-transcribed (SuperScriptII, Invitrogen, Carlsbad, CA). The relative abundance of CaV1.1 and CaV1.1Δ29 mRNAs was assessed by TaqMan quantitative PCR (50 cycles) using a standard curve method based on PCR products of known concentrations (16). TaqMan gene expression assays, designed to span exon-exon boundaries (Table S3), were purchased from Applied Biosystems. cDNA concentrations of the three individual experiments were comparable, as revealed by the expression of seven different reference genes (β-actin, B2M, GAPDH, HPRT1, Tbp, Tfrc, and SDHA). Analyses were performed using the 7500 Fast System (Applied Biosystems).
Expression plasmids
Bases 3609–3666, corresponding to exon 29, were deleted from GFP-α1S (17) by PCR splicing using a primer pair encompassing restriction sites upstream (XhoI) and downstream (BglII) of exon 29 (P1 and P2 (Table S3)), and two complementary primers each consisting of the end sequence of exon 28 joined to the start sequence of exon 30 (P3 and P4 (Table S3)). α2δ-1 shRNA expression plasmid has been previously published (18).
Cell culture and transfections
Myotubes of the homozygous dysgenic (mdg/mdg) cell line GLT were cultured and transfected as previously described (19). Myotubes were analyzed 3–5 days after transfection.
Immunofluorescence and antibodies
Immunofluorescence analysis was performed as described (20), using the following antibodies: rabbit polyclonal anti-GFP (1:4000, Molecular Probes, Eugene, OR); mouse monoclonal anti-RyR (34-C, 1:1000, Alexis Biochememicals, Lausen, Switzerland); secondary goat-anti-mouse Alexa-594 and goat-anti-rabbit Alexa-488 (1:4000, Molecular Probes). Images were captured on a Zeiss Axiophot microscope with a cooled CCD camera and METAVUE image-processing software (Universal Imaging, West Chester, PA).
Electrophysiology and fluorescent Ca2+ measurements
Ca2+ currents were recorded with the ruptured whole-cell patch-clamp technique in voltage-clamp mode. The patch pipettes (borosilicate glass, Harvard Apparatus, Holliston, MA) had resistance of 1.5–3 MΩ when filled with (mM) 145 Cs-aspartate, 2 MgCl2, 10 HEPES, 0.1 Cs-EGTA, 2 Mg-ATP, and 0.2 Fluo-4, with pentapotassium salt to record Ca2+ transients (pH 7.4 with CsOH). The extracellular bath solution contained (mM) 10 CaCl2, 145 tetraethylammoniumchloride, 10 HEPES (pH 7.4 with tetra-ethylammoniumhydroxide). Recording of gating charge movement was performed in the presence of 0.5 mM Cd2+ and 0.2 mM La3+ (Cd2+/La3+) to block the inward Ca2+ currents. All recordings were made with an Axopatch 200A amplifier (Axon Instruments, Foster City, CA). Data acquisition and command potentials were controlled by pClamp software (version 8.0, Axon Instruments).
The current-voltage dependence was fitted according to
| (1) |
where Gmax is the maximum conductance of the L-type Ca2+ channels, Vrev is the extrapolated reversal potential of the Ca2+ current, V1/2 is the potential for half-maximal conductance, and k is the slope.
The voltage dependence of the Ca2+ conductance, “On” gating charge movement, and Ca2+ transients were fitted according to a Boltzmann distribution:
| (2) |
The kinetic properties of the Ca2+ current activation were determined by fitting the rising phase of the maximum sweep (+40 or +50 mV for GFP-α1S and +10 or +20 mV for GFP-α1SΔ29 and GFP-α1SΔ29 + α2δ-1 siRNA) with a single- or double-exponential function:
| (3) |
where I is the current; Afast, Aslow, and Amono are the individual current amplitudes; and τfast, τslow, and τmono are the specific time constants of the current amplitudes.
Results
Human and mouse skeletal muscles express transcripts of multiple CaV1.1 splice variants
To determine the genetic variability of the skeletal muscle voltage-gated Ca2+ channel, we performed an RT-PCR screen for CaV1.1 splice variants on RNA from human and mouse muscle and cultured myotubes. We identified nine rare variants coding for nonsense proteins, each of which made up <3% of transcripts in myotubes and muscle (Table S1 and Fig. S1). Eight of these produced frame shifts resulting in premature stops, precluding formation of functional channels. The ninth, a deletion of exon 19, lacks almost an entire transmembrane segment and would thus invert the transmembrane orientation of the channel distal to IIIS1. Most likely, all of these transcripts are subject to nonsense-mediated decay, a process that affects transcripts with premature termination codons (21).
Further, we identified three C-terminal CaV1.1 variants, all of which code for truncated but putatively functional proteins (Table S2). Deletion of exons 39–40 results in a premature stop after only three residues. Alternative 5′ splicing of exon 40 results in the in-frame deletion of 26 residues in positions 1599–1625. The insertion of intron 43 generates a protein with 61 residues at the C-terminus. Because the distal end of the channel has previously been shown to exert an autoinhibitory effect on gating charge movements and Ca2+ currents (22), all three C-terminal variants are expected to result in a gain of function similar to an artificial truncation at position 1698. Transcripts of all three C-terminal variants were expressed in low abundance.
Finally, the RT-PCR screen revealed an in-frame deletion of exon 29 (Δ29) (Fig. 1 A) that encodes a 1854-amino-acid protein lacking 19 residues in the extracellular loop between transmembrane segments IVS3 and IVS4 (Fig. 1 B). This CaV1.1 variant had previously been identified in mouse ovaries, in the BC3H1 cell line (5), and in rat osteosarcoma cells (23). Quantifying the RT-PCR bands of the full-length and splice-variant Ca2+ channels showed that CaV1.1Δ29 was expressed at low levels in differentiated muscles from man and mouse (2–10% of transcripts), but was abundant in primary human myotubes and in the C2C12 mouse muscle cell line (60–80% of transcripts (Fig. 1 C)). Taqman RT-PCR, using assays spanning the borders between exons 28–29 and exons 28–30 (Table S3), confirmed the high expression levels of CaV1.1Δ29 in an additional skeletal muscle cell line. Of the CaV1 transcripts in RNA from myotubes derived from the Immortomouse, 77 ± 3% lacked exon 29 (Fig. 1 D). Together, these data show that CaV1.1Δ29 is the predominant CaV1.1 isoform in skeletal myotubes. Analogous splice variants in other L-type Ca2+ channel α1 subunits code for functional channels. Thus, it is likely also that CaV1.1Δ29 is functional and thus may be of physiological relevance.
Figure 1.
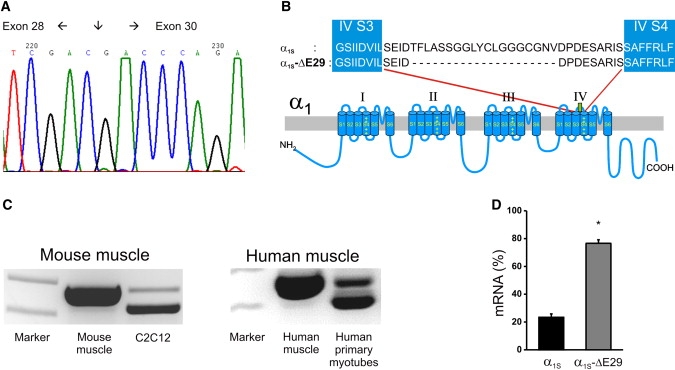
Detection of GFP-α1SΔ29 in human and mouse myotubes. (A) Sequence of the boundary between exons 28 and 30. (B) Location of exon 29 in a domain model of CaV1.1. (C) Full-length (upper band) and CaV1.1Δ29 (lower band) detected by RT-PCR amplification of exons 26–30 in RNA prepared from mouse muscle, C2C12 myotubes, human muscle, and human primary myotubes. (D) The fraction of CaV1.1 transcripts with and without exon 29 measured with quantitative RT-PCR in mRNA from mouse myotubes. Error bars represent the mean ± SE, p << 0.001.
CaV1.1Δ29 is localized in the EC-coupling apparatus
To analyze the physiological properties of CaV1.1Δ29, we deleted the sequence corresponding to amino acids 1203–1222 in the GFP-tagged CaV1.1 α1S subunit (17) and expressed the resulting construct, GFP-α1SΔ29, in dysgenic (α1S-null) myotubes. Reconstitution of dysgenic myotubes with GFP-α1S restores normal triad targeting of the GFP-α1S subunit (Fig. 2, left column) as well as skeletal muscle EC coupling (20). Double-immunofluorescence analysis of GFP-α1SΔ29-transfected myotubes showed that, like the wild-type GFP-α1S, GFP-α1SΔ29 was localized in a clustered pattern that was colocalized with clusters of RyR1 (Fig. 2, right column). This labeling pattern is typical for triad proteins and indicates that GFP-α1SΔ29 is correctly targeted into junctions between the SR and t-tubules or the plasma membrane, and thus can function in EC coupling (20).
Figure 2.
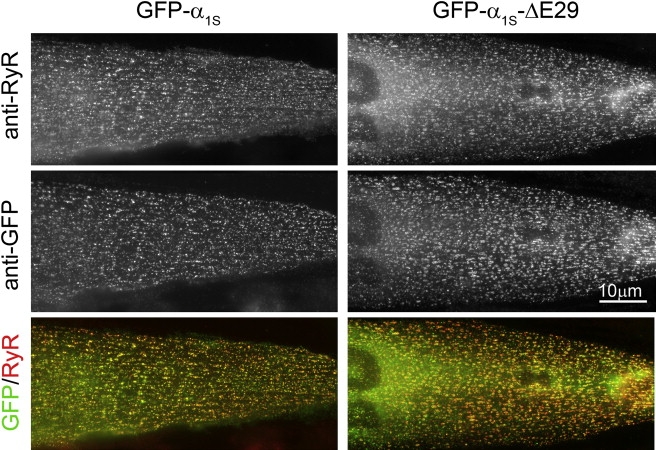
GFP-α1SΔ29 is targeted into junctions between the SR and t-tubules or the plasma membrane. Dysgenic myotubes expressing full-length GFP-α1S (left) or the GFP-α1SΔ29 splice variant (right) were double-immunolabeled with anti-RyR (upper) and anti-GFP (middle). Clusters of GFP-α1S and GFP-α1SΔ29 colocalized with the RyR1 (lower, yellow clusters in color overlay) indicate the correct targeting of both Ca2+ channel variants into t-tubule/SR or plasma membrane/SR junctions. Scale bar, 10 μm.
CaV1.1Δ29 has distinct current properties
Whole-cell patch-clamp recordings in dysgenic myotubes reconstituted with GFP-α1SΔ29 revealed greatly augmented Ca2+ currents (Fig. 3 A). Mean peak current density was increased eightfold from 1.9 ± 0.2 pA/pF in GFP-α1S-expressing myotubes to 14.8 ± 1.2 pA/pF in myotubes expressing GFP-α1SΔ29 (Fig. 3 B and Table 1). Moreover, the current-voltage curves showed a greatly increased voltage sensitivity. The half-maximal activation was shifted from 39.1 ± 1.3 mV for the wild-type to 9.3 ± 1.0 mV for the GFP-α1SΔ29 channel (Fig. 3 C). Because at less positive voltages the driving force for Ca2+ currents is larger, the left-shifted voltage dependence of activation accounted in part for the observed increase in current density.
Figure 3.
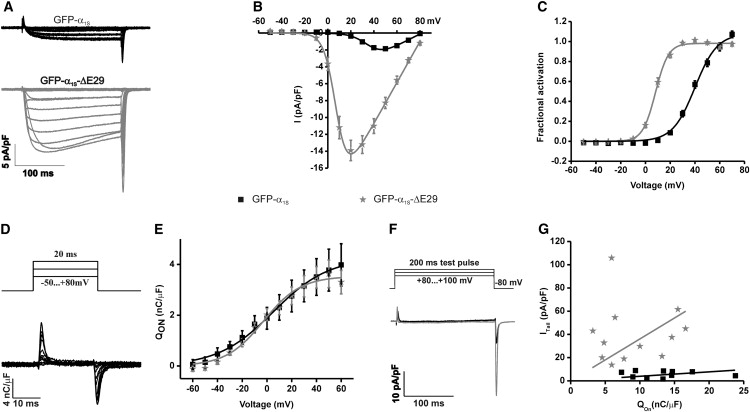
GFP-α1SΔ29 has increased current density, voltage sensitivity of activation, and open probability (Po). (A) Representative whole-cell currents from myotubes expressing either GFP-α1S or GFP-α1SΔ29. (B) I/V curves show that the peak current density of GFP-α1SΔ29 is increased. (C) Voltage dependence of activation is shifted toward more negative potentials for GFP-α1SΔ29 compared to full-length GFP-α1S. (D and E) Analysis of the “On” gating charges (Qon) while currents are blocked with Cd2+/ La3+ shows that deletion of exon 29 did not alter the expression of functional channels in the membrane. (F and G) The amplitudes of the tail currents, recorded at the reversal potential were plotted against Qon. The increased slope of the linear regression indicates that the channel Po is considerably increased in GFP-α1SΔ29 compared to GFP-α1S. Error bars indicate the SE.
Table 1.
Properties of Ca2+ currents from α1S and α1S-ΔE29
| Parameters | α1S | α1S-ΔE29 | Significance (p-value) | |
|---|---|---|---|---|
| Current properties | Ipeak (pA/pF) | −1.9 ± 0.2 | −14.8 ± 1.2 | <<0.001 |
| Gmax (nS/nF) | 79.1 ± 8.4 | 255.1 ± 17.8 | <<0.001 | |
| V1/2 (mv) | 39.1 ± 1.3 | 9.3 ± 1.0 | <<0.001 | |
| kact (mv) | 7.2 ± 0.4 | 4.8 ± 0.3 | <<0.001 | |
| Vrev (mv) | 82.7 ± 2.1 | 83.1 ± 0.8 | 0.81 | |
| n | 26 | 33 | — | |
| Kinetics | Time to peak (ms) | 84.7 ± 6.3 | 39.8 ± 4.5 | <<0.001 |
| % Inactivation | 4.7 ± 1.2 | 23.8 ± 2.0 | <<0.001 | |
| n | 26 | 33 | — | |
| Aslow contribution | 62% | 65% | 0.24 | |
| Afast contribution | 38% | 35% | 0.24 | |
| Aslow (pA/pF) | 1.4 ± 0.3 | 7.9 ± 1.3 | <<0.001 | |
| Afast (pA/pF) | 0.9 ± 0.1 | 3.9 ± 0.9 | 0.001 | |
| τslow (ms) | 28.7 ± 3.3 | 14.1 ± 2.5 | 0.003 | |
| τfast (ms) | 5 ± 0.5 | 3.9 ± 0.6 | 0.15 | |
| n | 21 | 18 | — | |
| Amono (pA/pF) | — | 20.1 ± 3.2 | — | |
| τmono (ms) | — | 4.3 ± 0.2 | — | |
| n | — | 15 | — | |
| Charge movement | QON(nC/μF) | 4.1 ± 0.9 | 3.9 ± 0.5 | 0.90 |
| Slope | 19.8 ± 2.2 | 15.5 ± 0.9 | 0.07 | |
| V1/2 (mv) | 14.3 ± 5.6 | 7.8 ± 2.6 | 0.28 | |
| n | 8 | 10 | — | |
| QON vs. ITail | ITail (pA/pF) | −5.7 ± 0.8 | −40.3 ± 7.3 | <0.001 |
| Slope | 0.38 ± 0.07 | 3.59 ± 0.89 | — | |
| n | 10 | 12 |
All data are presented as mean ± SE.
To determine whether enhanced membrane expression of Ca2+ channels also contributed to the increase in current density, we analyzed the charge movements upon channel activation in the presence of Cd2+/La3+ to block the Ca2+ conductance (Fig. 3 D). The integral of the immobilization-resistant “On” gating charge movement (Qon) is a measure of functional Ca2+ channels in the membrane (24). In myotubes expressing GFP-α1S or GFP-α1SΔ29, Qon was not significantly different at any voltage (Fig. 3 E), indicating that membrane expression of functional Ca2+ channels was not changed in the variant lacking exon 29. Alternatively, altered single-channel conductance could be responsible for the increased current density. Therefore, we analyzed the tail currents at the end of 200-ms test pulses to near the reversal potential, where a maximal number of channels should be activated (Fig. 3 F), and we plotted the peak current density of the tail currents against the integral of Qon (25). The slope of the linear regression was increased from 0.38 ± 0.07 (GFP-α1S) to 3.59 ± 0.89 (GFP-α1SΔ29) (Fig. 3 G). This indicated that deletion of exon 29 caused a significant increase in the relative open probability (Po) (Table 1). Together, electrophysiological analyses demonstrated that compared to the full-length isoform, the CaV1.1Δ29 splice variant has a greatly increased voltage sensitivity and open probability, resulting in an eightfold increase of the whole-cell Ca2+ currents.
CaV1.1Δ29 has accelerated current kinetics
Another property of the Ca2+ current that was altered by the deletion of exon 29 was the speed of activation and inactivation. This is evident in the representative current traces shown in Fig. 3 A. The average time to peak measured in the maximum current traces was significantly reduced from 84.7 ± 6.3 ms (GFP-α1S) to 39.8 ± 4.5 ms (GFP-α1SΔ29) (Fig. 4 A). In a similar way, the fractional inactivation at the end of the 200-ms test pulse increased from 4.7 ± 1.2% to 23.82 ± 2.0% (Fig. 4 B).
Figure 4.
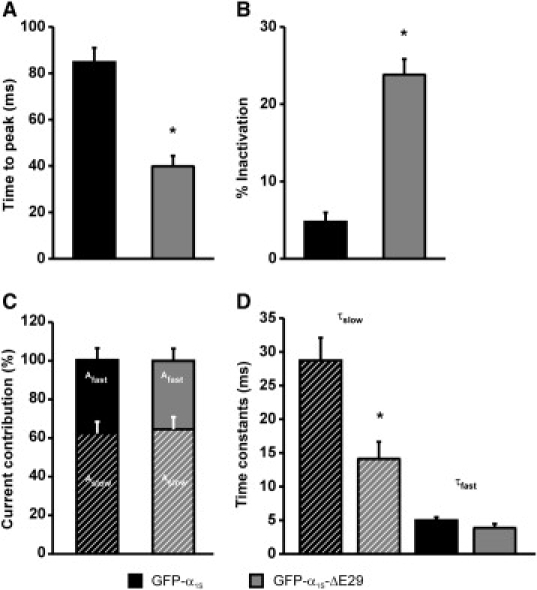
Deletion of exon 29 accelerates Ca2+ current kinetics. (A and B) Currents recorded from myotubes expressing GFP-α1SΔ29 exhibit a significantly shorter time to peak (A) and an increased fractional inactivation during a 200-ms pulse (B). The rising phase of Ca2+ currents was fitted by a double-exponential function and the amplitudes and time constants of the two components were calculated. Neither the ratio between fast and slow components (C) nor the time constant of the fast component (D, solid bars) was affected by the deletion of exon 29. The time constant of the slow component was significantly faster in GFP-α1SΔ29 compared to GFP-α1S (D, hatched bars). Error bars represent the mean ± SE.
To elucidate the mechanism of Ca2+-current acceleration we further analyzed the activation phase by fitting the maximum current traces. Kinetic analysis of GFP-α1SΔ29-expressing myotubes using a double-exponential function (26) showed that the majority of the currents consisted of a fast- and a slow-activating component. Whereas the relative abundance of both components (Fig. 4 C), and the time constant of the fast component, were equal for GFP-α1S and GFP-α1SΔ29, the time constant of the slow component was significantly faster (14.1 ± 2.5 ms) compared to that of GFP-α1S (28.7 ± 3.3 ms) (n = 18) (Fig. 4 D and Table 1). In addition, activation kinetics of 15 out of 33 currents were best described by a single-exponential function with a time constant equal to that of τfast in the currents with two activation components (Table 1). Whether this resulted from an even greater acceleration of the slow component or from an almost complete loss of its contribution to the whole-cell current cannot be discerned.
CaV1.1Δ29 interacts with the α2δ-1 subunit
Previously, we reported that depletion of the Ca2+ channel α2δ-1 subunit with siRNA also accelerated Ca2+ current kinetics (18). Therefore, we examined whether GFP-α1SΔ29 currents were affected by depletion of α2δ-1. Fig. 5 A shows that coexpressing dysgenic myotubes with GFP-α1SΔ29 and a plasmid coding for α2δ-1 shRNA further accelerated activation and inactivation of Ca2+ currents compared to those expressing GFP-α1SΔ29 alone. Knock-down of α2δ-1 showed a 42% decrease in time to peak to 22.9 ± 0.1 ms (Fig. 5 B and Table 2), and a 22% increase in the fractional inactivation to 30.6 ± 0.2% (Fig. 5 C). Moreover, as previously shown for GFP-α1S, it is also the case with GFP-α1SΔ29 that the rising phase of all currents in α2δ-1-depleted myotubes was best fitted by a single-exponential function (Fig. 5 D). This indicates that GFP-α1SΔ29 still interacted with the α2δ-1 subunit in skeletal myotubes. Furthermore, immunocytochemical analysis demonstrated that the deletion of exon 29 did not affect triad targeting of the α2δ-1 subunit (Fig. S2). Thus, the mechanisms by which the IVS3–IVS4 loop and the α2δ-1 subunit regulate activation kinetics are independent of each other.
Figure 5.

Deletion of exon 29 does not affect the interaction of α1 with the α2δ-1 subunit. The α2δ-1 subunit was depleted with shRNA in myotubes expressing GFP-α1SΔ29. This resulted in a further acceleration of activation and inactivation kinetics as seen in the sample recordings (A). The time to peak was further reduced (B), and the percentage of inactivation was increased (C). Kinetic analysis of the activation phase revealed only one component of activation (D, white bar) with a time constant equal to τfast in GFP-α1SΔ29 controls (E, gray bars), indicating the loss of the slow-activating component. Error bars represent the mean ± SE.
Table 2.
Properties of Ca2+ currents from α1S-ΔE29 and α1S-ΔE29 + α2δ-1 siRNA
| Parameters | α1S-ΔE29 | α1S-ΔE29 + α2δ-1 siRNA | Significance (p-value) | |
|---|---|---|---|---|
| Current properties | Ipeak (pA/pF) | −14.8 ± 1.2 | −14.3 ± 2.1 | 0.84 |
| Gmax (nS/nF) | 255.1 ± 17.8 | 249.5 ± 28.8 | 0.89 | |
| V1/2 (mv) | 9.3 ± 1.0 | 8.9 ± 1.3 | 0.88 | |
| kact (mv) | 4.8 ± 0.3 | 4.5 ± 0.3 | 0.70 | |
| Vrev (mv) | 83.1 ± 0.8 | 79.7 ± 1.7 | 0.05 | |
| n | 33 | 6 | — | |
| Kinetics | Time to peak (ms) | 39.8 ± 4.5 | 22.87 ± 2.1 | 0.12 |
| % Inactivation | 23.8 ± 2.0 | 30.6 ± 2.0 | 0.17 | |
| n | 33 | 6 | — | |
| Aslow contribution | 65% | 0% | — | |
| Afast contribution | 35% | 100% | — | |
| Aslow (pA/pF) | 7.9 ± 1.3 | — | — | |
| Afast (pA/pF) | 3.9 ± 0.9 | — | — | |
| τslow (ms) | 14.1 ± 2.5 | — | — | |
| τfast (ms) | 3.9 ± 0.6 | — | — | |
| n | 18 | 6 | ||
| Amono (pA/pF) | 20.1 ± 3.2 | 14.1 ± 2.38 | 0.28 | |
| τmono (ms) | 4.3 ± 0.2 | 5.3 ± 0.42 | 0.07 | |
| n | 15 | 6 | — |
All data are presented as mean ± SE.
CaV1.1Δ29 supports skeletal muscle EC coupling with a substantial component of Ca2+ influx
CaV1.1 Ca2+ currents activate slowly and at much higher membrane potentials than depolarization-induced Ca2+ release from the SR. As a consequence, Ca2+ influx through the CaV1.1 Ca2+ channel does not essentially contribute to skeletal muscle EC coupling (1). However, the current properties of GFP-α1SΔ29 described above resemble much more those of the cardiac CaV1.2, which activates EC coupling by Ca2+-induced Ca2+ release (27). Therefore, it was important to determine whether GFP-α1SΔ29 can trigger EC coupling in skeletal myotubes, and if so, by which mechanism. To this end, we measured Ca2+ transients during patch-clamp experiments using the fluorescent Ca2+ indicator Fluo-4. Fig. 6 A shows that during a depolarizing pulse, GFP-α1SΔ29-expressing myotubes give rise to Ca2+ transients, indicating that GFP-α1SΔ29 can activate EC coupling. Because of its independence of Ca2+ influx, skeletal muscle EC coupling remains fully activated at test pulses to near the reversal potential. Therefore, in myotubes expressing GFP-α1S, the voltage-dependence curve of Ca2+ transients has the characteristic sigmoidal shape (Fig. 6 B, squares). The voltage-dependence curve of transients in GFP-α1SΔ29 expressing myotubes peaks earlier and at a higher level than that of GFP-α1S before it declines to the same level as that of GFP-α1S (Fig. 6 B (gray stars) and Table 3). The fact that at the reversal potential GFP-α1SΔ29 still activates solid Ca2+ transients demonstrates that it supports the skeletal muscle EC coupling mechanism. The early-activating additional component is likely caused by Ca2+ entering the myotubes from the outside through the CaV1.1Δ29 channel. Indeed, blocking Ca2+ currents with Cd2+/La3+ abolished the early peak of the voltage-dependence curve so that it exactly matched that of the full-length GFP-α1S isoform (Fig. 6 B, open stars).
Figure 6.
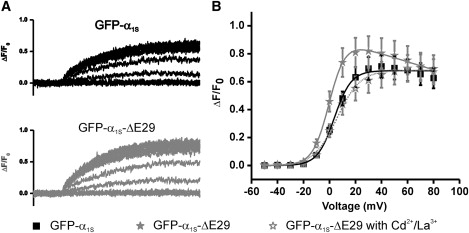
GFP-α1SΔ29 supports skeletal muscle type EC coupling with an additional component of Ca2+ influx. Depolarization-induced Ca2+ transients were recorded in dysgenic myotubes reconstituted with GFP-α1S (A, upper) or GFP-α1SΔ29 (A, lower). The voltage dependence of activation was not altered by the deletion of exon 29, but Ca2+ transients were augmented by a component that declined at voltages near the reversal potential and could be inhibited by blocking Ca2+ currents with Cd2+/La3+ (B). Error bars represent the mean ± SE.
Table 3.
Properties of Ca2+ transients
| Parameters | α1S-WT | α1S-ΔE29 | Significance (p-value) | |
|---|---|---|---|---|
| Transients before Cd2+/La3+ | ΔF/F | 0.63 ± 0.07 | 0.81 ± 0.10 | 0.44 |
| V1/2 (mv) | 4.8 ± 1.1 | 1.0 ± 1.0 | 0.02 | |
| kact (mv) | 7.1 ± 0.16 | 6.2 ± 0.25 | 0.005 | |
| n | 15 | 16 | — | |
| Transients after Cd2+/La3+ | ΔF/F | 0.64 ±0.06 | 0.55 ± 0.08 | 0.33 |
| V1/2 (mv) | 6.8 ± 1.4 | 8.1 ± 1.7 | 0.55 | |
| kact (mv) | 8.4 ± 0.3 | 9.4 ± 0.9 | 0.27 | |
| n | 15 | 13 | — |
All data are presented as mean ± SE.
Discussion
Here, we report the first functional characterization of a splice variant of the skeletal muscle voltage-gated Ca2+ channel, and the extent to which the channel properties of CaV1.1Δ29 differ from those of the classical full-length CaV1.1 is amazing. CaV1.1Δ29 is normally targeted into the triads and supports skeletal muscle type EC coupling, but the lack of exon 29 causes drastically increased voltage sensitivity and open probability of the channel. Alternative splicing of the extracellular loop between transmembrane segments 3 and 4 in the fourth homologous repeat has also been described in other L-type and non-L-type Ca2+ channels (5,7,9–11,13,23). It is interesting to note that in all these cases, changes in the length of the IVS3–IVS4 linker were accompanied by changes in the voltage dependence of activation. In CaV1.2, 12 possible splicing combinations exist in this domain, four of which have been functionally characterized. The IVS3–IVS4 loop of variant A was shortened by 13 amino acids and the potential of half-maximal activation (V1/2) was left-shifted by −9.5 mV; that of variant B was 6 residues shorter, with V1/2 shifted by −4.9 mV; and that of variant C was 11 residues shorter, with V1/2 shifted by −6.8 mV. In variant D, a 12-amino-acid sequence was exchanged without changing the total length of the IVS3–IVS4 loop, and the voltage sensitivity remained unaltered (7). Here, we demonstrate that the lack of exon 29 in CaV1.1Δ29, which shortens the IVS3–IVS4 loop by 19 amino acids, leads to a −29.8 mV shift of the voltage dependence of activation. Together, these observations suggest an inverse correlation of the length of the IVS3–IVS4 loop and the voltage sensitivity of Ca2+-channel splice variants. From a mechanistic perspective, it is conceivable that a shorter IVS3–IVS4 loop pulls the positively charged voltage sensor IVS4 toward the extracellular side of the membrane and thus facilitates its transition into the activated state upon depolarization. This would result in an increased voltage sensitivity and an increased dwell time in the open state.
The distinguishing characteristics of the skeletal muscle Ca2+ current are its extremely slow activation kinetics and activation at very positive potentials. Using skeletal/cardiac muscle CaV1 chimeras, a sequence including transmembrane domain S3 and the S3–S4 loop of the first repeat was shown to determine the slow gating mode (28). The results of this study demonstrate the importance of a separate domain, the IVS3–IVS4 loop, for the characteristic voltage dependence of activation of CaV1.1. Indeed, Nakai et al. (28) reported that in their chimeras, the slow and fast kinetics did not correlate with low and high voltage sensitivity, respectively. Our study provides independent evidence that voltage sensitivity and activation kinetics are determined by separate mechanisms. We have shown previously that the auxiliary α2δ-1 subunit is an important determinant of the slow activation of CaV1.1, and that shRNA depletion of α2δ-1 accelerated current activation by increasing the population of fast-activating channels at the expense of slow-activating channels (18). The voltage sensitivity of activation was not altered by α2δ-1 siRNA treatment. Although the removal of exon 29 also accelerated activation kinetics, this resulted from a reduced time constant of the slow-activating component. Moreover, CaV1.1Δ29 channels were still sensitive to depletion of α2δ-1, which caused an additional increase in activation kinetics. Thus, two separate sequences in the corresponding domains of the first and fourth repeats of CaV1.1 are responsible for the characteristic kinetics and voltage dependence of activation, respectively. Whereas IS3 and the IS3–IS4 loop appear to cooperate with the α2δ-1 subunit in determining the activation kinetics, the length of the IVS3–IVS4 loop determines the voltage sensitivity of CaV1.1.
It is interesting that the deletion of exon 29 only affected the voltage sensitivity of the Ca2+ current, but not that of the “On” gating charges and Ca2+ transients, which activate at similarly low potentials in CaV1.1 and CaV1.1Δ29. Thus, the long IVS3–IVS4 loop, and with it the voltage sensor of repeat 4, is rate-limiting for activation of the Ca2+ current but not for activation of SR Ca2+ release. Removing exon 29 was sufficient to render the voltage sensor in the fourth repeat as sensitive to depolarization as those responsible for EC coupling. Based on elegant electrophysiological experiments in frog muscle fibers, Feldmeyer et al. (29) (reviewed in Melzer et al. (1)) proposed a model according to which CaV1.1 possesses three fast- and one slow-activating voltage sensors, which are responsible for the activation of EC coupling and Ca2+ currents, respectively. A similar model would readily explain the differential voltage sensitivity of EC coupling and the Ca2+ currents. If the rapid gating of two or three voltage sensors is sufficient for activating SR Ca2+ release, but the gating of all four voltage sensors is necessary for activation of the Ca2+ current, a single less responsive voltage sensor would be enough to delay current activation. However, since the voltage sensors of repeats I and IV appear to be involved in controlling the kinetics and voltage sensitivity of the current, respectively, the two other voltage sensors, those of repeats II and III, which flank the cytoplasmic loop that interacts with the RyR1, may be sufficient for the rapid activation of EC coupling. If, however, the short IVS3–IVS4 loop would hold the voltage sensor of repeat IV in a constitutively activated position, a reduction of Qon by one-fourth would have been expected in CaV1.1Δ29. This was not observed. Therefore, the shorter IVS3–IVS4 loop appears to enhance the coupling between the voltage-dependent step and the final voltage-independent step of channel gating.
We further demonstrate that transcripts of the CaV1.1 splice variant lacking exon 29 (CaV1.1Δ29) are expressed in human and mouse muscles and that CaV1.1Δ29 is the predominant isoform in human and mouse cultured myotubes. If this is so, Ca2+ currents in normal myotubes like the C2C12 cell line, which express a mix of CaV1.1 and CaV1.1Δ29, should have an intermediate voltage sensitivity compared to dysgenic myotubes expressing either GFP-α1S or GFP-α1SΔ29. Indeed, this was observed in two previous studies by Schuhmeier et al. (30,31), who determined the voltage sensitivity of Ca2+ currents and Ca2+ transients in reconstituted dysgenic myotubes and in C2C12 myotubes. Consistent with the data presented here, in dysgenic myotubes transfected with GFP-α1S, half-maximal activation of Ca2+ currents occurred at ∼30 mV higher potentials than activation of Ca2+ transients. In contrast, this difference was only ∼15 mV in C2C12 cells. Thus, the current properties of cultured myotubes most likely reflect the properties of a mixed population of CaV1.1 splice variants.
Finally, CaV1.1Δ29 was correctly incorporated into triad junctions and supported skeletal muscle type EC coupling, although the highly increased voltage sensitivity and amplitude of Ca2+ currents altered the EC coupling properties. Dysgenic myotubes exclusively expressing the GFP-α1SΔ29 isoform showed depolarization-dependent Ca2+ transients, which did not require Ca2+ influx through the channel. In addition, the rapidly activating Ca2+ current contributed significant amounts of Ca2+ to the cytoplasmic Ca2+ transients. Under physiological conditions, this component will be diminished by the presence of the full-length CaV1.1. Nevertheless, the additional Ca2+ influx is expected to increase the force of contraction and it creates the need for increased export of Ca2+ from the cell to maintain equilibrium. The observation that CaV1.1Δ29 transcripts were highly expressed in cultured myotubes from humans and mice suggests a physiological role of this splice variant in developing and regenerating muscle. It is plausible that myotubes with an incompletely differentiated SR Ca2+ storage and release apparatus require more Ca2+ influx and rely part on a cardiac-like EC coupling mechanism. Moreover, given the great variety of muscle types in our body it is intriguing to consider the possibility that CaV1.1Δ29 may also play a role in some type of differentiated muscle. Finally, CaV1.1 mutants affecting Ca2+ current properties have been linked to human disease, but the effects of these disease mutants on EC coupling were small (32,33). In light of the existence of a splice variant with dramatically different current properties and its possible function during development, the effects of these disease mutations on this splice variant, as well as the possible pathological consequences, need to be investigated.
Supplementary Material
Three tables and two figures are available at www.biophys.org/biophysj/supplemental/S0006-3495(08)00036-2.
Supplementary Material
Acknowledgments
We thank F. Lehmann-Horn for fruitful discussion, M. Grabner for the GFP-α1S plasmid, and N.-H. Mao, S. Schatlowski, and S. Baumgartner for excellent technical help.
This work was supported by grants from the German Research Foundation (Deutsche Forschungsgemeinschaft, JU 470/1) and from the Austrian Science Fund (Förderung der wissenschaftlichen Forschung (P17806-B05, P20059-B05, and P17807-B05)).
References
- 1.Melzer W., Herrmann-Frank A., Luttgau H.C. The role of Ca2+ ions in excitation-contraction coupling of skeletal muscle fibres. Biochim. Biophys. Acta. 1995;1241:59–116. doi: 10.1016/0304-4157(94)00014-5. [DOI] [PubMed] [Google Scholar]
- 2.Jurkat-Rott K., Lehmann-Horn F. The impact of splice isoforms on voltage-gated calcium channel α1 subunits. J. Physiol. 2004;554:609–619. doi: 10.1113/jphysiol.2003.052712. [DOI] [PMC free article] [PubMed] [Google Scholar]
- 3.Abernethy D.R., Soldatov N.M. Structure-functional diversity of human L-type Ca2+ channel: perspectives for new pharmacological targets. J. Pharmacol. Exp. Ther. 2002;300:724–728. doi: 10.1124/jpet.300.3.724. [DOI] [PubMed] [Google Scholar]
- 4.Diebold R.J., Koch W.J., Ellinor P.T., Wang J.J., Muthuchamy M. Mutually exclusive exon splicing of the cardiac calcium channel α1 subunit gene generates developmentally regulated isoforms in the rat heart. Proc. Natl. Acad. Sci. USA. 1992;89:1497–1501. doi: 10.1073/pnas.89.4.1497. [DOI] [PMC free article] [PubMed] [Google Scholar]
- 5.Perez-Reyes E., Wei X.Y., Castellano A., Birnbaumer L. Molecular diversity of L-type calcium channels. Evidence for alternative splicing of the transcripts of three non-allelic genes. J. Biol. Chem. 1990;265:20430–20436. [PubMed] [Google Scholar]
- 6.Snutch T.P., Tomlinson W.J., Leonard J.P., Gilbert M.M. Distinct calcium channels are generated by alternative splicing and are differentially expressed in the mammalian CNS. Neuron. 1991;7:45–57. doi: 10.1016/0896-6273(91)90073-9. [DOI] [PubMed] [Google Scholar]
- 7.Tang Z.Z., Liang M.C., Lu S., Yu D., Yu C.Y. Transcript scanning reveals novel and extensive splice variations in human l-type voltage-gated calcium channel, Cav1.2. α1 subunit. J. Biol. Chem. 2004;279:44335–44343. doi: 10.1074/jbc.M407023200. [DOI] [PubMed] [Google Scholar]
- 8.Yu A.S., Hebert S.C., Brenner B.M., Lytton J. Molecular characterization and nephron distribution of a family of transcripts encoding the pore-forming subunit of Ca2+ channels in the kidney. Proc. Natl. Acad. Sci. USA. 1992;89:10494–10498. doi: 10.1073/pnas.89.21.10494. [DOI] [PMC free article] [PubMed] [Google Scholar]
- 9.Bourinet E., Soong T.W., Sutton K., Slaymaker S., Mathews E. Splicing of α1A subunit gene generates phenotypic variants of P- and Q-type calcium channels. Nat. Neurosci. 1999;2:407–415. doi: 10.1038/8070. [DOI] [PubMed] [Google Scholar]
- 10.Lin Z., Haus S., Edgerton J., Lipscombe D. Identification of functionally distinct isoforms of the N-type Ca2+ channel in rat sympathetic ganglia and brain. Neuron. 1997;18:153–166. doi: 10.1016/s0896-6273(01)80054-4. [DOI] [PubMed] [Google Scholar]
- 11.Lin Z., Lin Y., Schorge S., Pan J.Q., Beierlein M. Alternative splicing of a short cassette exon in alpha1B generates functionally distinct N-type calcium channels in central and peripheral neurons. J. Neurosci. 1999;19:5322–5331. doi: 10.1523/JNEUROSCI.19-13-05322.1999. [DOI] [PMC free article] [PubMed] [Google Scholar]
- 12.Takimoto K., Li D., Nerbonne J.M., Levitan E.S. Distribution, splicing and glucocorticoid-induced expression of cardiac α1C and α 1D voltage-gated Ca2+ channel mRNAs. J. Mol. Cell. Cardiol. 1997;29:3035–3042. doi: 10.1006/jmcc.1997.0532. [DOI] [PubMed] [Google Scholar]
- 13.Liao P., Yu D., Li G., Yong T.F., Soon J.L. A smooth muscle Cav1.2 calcium channel splice variant underlies hyperpolarized window current and enhanced state-dependent inhibition by nifedipine. J. Biol. Chem. 2007;282:35133–35142. doi: 10.1074/jbc.M705478200. [DOI] [PubMed] [Google Scholar]
- 14.Jat P.S., Noble M.D., Ataliotis P., Tanaka Y., Yannoutsos N. Direct derivation of conditionally immortal cell lines from an H-2Kb-tsA58 transgenic mouse. Proc. Natl. Acad. Sci. USA. 1991;88:5096–5100. doi: 10.1073/pnas.88.12.5096. [DOI] [PMC free article] [PubMed] [Google Scholar]
- 15.Kern G., Flucher B.E. Localization of transgenes and genotyping of H-2kb-tsA58 transgenic mice. Biotechniques. 2005;38:38–42. doi: 10.2144/05381BM03. [DOI] [PubMed] [Google Scholar]
- 16.Koschak A., Obermair G.J., Pivotto F., Sinnegger-Brauns M.J., Striessnig J. Molecular nature of anomalous L-type calcium channels in mouse cerebellar granule cells. J. Neurosci. 2007;27:3855–3863. doi: 10.1523/JNEUROSCI.4028-06.2007. [DOI] [PMC free article] [PubMed] [Google Scholar]
- 17.Grabner M., Dirksen R.T., Beam K.G. Tagging with green fluorescent protein reveals a distinct subcellular distribution of L-type and non-L-type Ca2+ channels expressed in dysgenic myotubes. Proc. Natl. Acad. Sci. USA. 1998;95:1903–1908. doi: 10.1073/pnas.95.4.1903. [DOI] [PMC free article] [PubMed] [Google Scholar]
- 18.Obermair G.J., Kugler G., Baumgartner S., Tuluc P., Grabner M. The Ca2+ channel α2δ-1 subunit determines Ca2+ current kinetics in skeletal muscle but not targeting of α1S or excitation-contraction coupling. J. Biol. Chem. 2005;280:2229–2237. doi: 10.1074/jbc.M411501200. [DOI] [PubMed] [Google Scholar]
- 19.Powell J.A., Petherbridge L., Flucher B.E. Formation of triads without the dihydropyridine receptor α-subunits in cell lines from dysgenic skeletal muscle. J. Cell Biol. 1996;134:375–387. doi: 10.1083/jcb.134.2.375. [DOI] [PMC free article] [PubMed] [Google Scholar]
- 20.Flucher B.E., Kasielke N., Grabner M. The triad targeting signal of the skeletal muscle calcium channel is localized in the COOH terminus of the α(1S) subunit. J. Cell Biol. 2000;151:467–478. doi: 10.1083/jcb.151.2.467. [DOI] [PMC free article] [PubMed] [Google Scholar]
- 21.Lewis B.P., Green R.E., Brenner S.E. Evidence for the widespread coupling of alternative splicing and nonsense-mediated mRNA decay in humans. Proc. Natl. Acad. Sci. USA. 2003;100:189–192. doi: 10.1073/pnas.0136770100. [DOI] [PMC free article] [PubMed] [Google Scholar]
- 22.Morrill J.A., Cannon S.C. COOH-terminal truncated α(1S) subunits conduct current better than full-length dihydropyridine receptors. J. Gen. Physiol. 2000;116:341–348. doi: 10.1085/jgp.116.3.341. [DOI] [PMC free article] [PubMed] [Google Scholar]
- 23.Barry E.L., Gesek F.A., Froehner S.C., Friedman P.A. Multiple calcium channel transcripts in rat osteosarcoma cells: selective activation of α1D isoform by parathyroid hormone. Proc. Natl. Acad. Sci. USA. 1995;92:10914–10918. doi: 10.1073/pnas.92.24.10914. [DOI] [PMC free article] [PubMed] [Google Scholar]
- 24.Adams B.A., Tanabe T., Mikami A., Numa S., Beam K.G. Intramembrane charge movement restored in dysgenic skeletal muscle by injection of dihydropyridine receptor cDNAs. Nature. 1990;346:569–572. doi: 10.1038/346569a0. [DOI] [PubMed] [Google Scholar]
- 25.Takahashi S.X., Miriyala J., Colecraft H.M. Membrane-associated guanylate kinase-like properties of β-subunits required for modulation of voltage-dependent Ca2+ channels. Proc. Natl. Acad. Sci. USA. 2004;101:7193–7198. doi: 10.1073/pnas.0306665101. [DOI] [PMC free article] [PubMed] [Google Scholar]
- 26.Avila G., Dirksen R.T. Functional impact of the ryanodine receptor on the skeletal muscle L-type Ca(2+) channel. J. Gen. Physiol. 2000;115:467–480. doi: 10.1085/jgp.115.4.467. [DOI] [PMC free article] [PubMed] [Google Scholar]
- 27.Kasielke N., Obermair G.J., Kugler G., Grabner M., Flucher B.E. Cardiac-type EC coupling in dysgenic myotubes restored with Ca2+ channel subunit isoforms α1C and α1D does not correlate with current density. Biophys. J. 2003;84:3816–3828. doi: 10.1016/S0006-3495(03)75109-1. [DOI] [PMC free article] [PubMed] [Google Scholar]
- 28.Nakai J., Adams B.A., Imoto K., Beam K.G. Critical roles of the S3 segment and S3–S4 linker of repeat I in activation of L-type calcium channels. Proc. Natl. Acad. Sci. USA. 1994;91:1014–1018. doi: 10.1073/pnas.91.3.1014. [DOI] [PMC free article] [PubMed] [Google Scholar]
- 29.Feldmeyer D., Melzer W., Pohl B., Zollner P. Fast gating kinetics of the slow Ca2+ current in cut skeletal muscle fibres of the frog. J. Physiol. 1990;425:347–367. doi: 10.1113/jphysiol.1990.sp018107. [DOI] [PMC free article] [PubMed] [Google Scholar]
- 30.Schuhmeier R.P., Gouadon E., Ursu D., Kasielke N., Flucher B.E. Functional interaction of CaV channel isoforms with ryanodine receptors studied in dysgenic myotubes. Biophys. J. 2005;88:1765–1777. doi: 10.1529/biophysj.104.051318. [DOI] [PMC free article] [PubMed] [Google Scholar]
- 31.Schuhmeier R.P., Melzer W. Voltage-dependent Ca2+ fluxes in skeletal myotubes determined using a removal model analysis. J. Gen. Physiol. 2004;123:33–51. doi: 10.1085/jgp.200308908. [DOI] [PMC free article] [PubMed] [Google Scholar]
- 32.Jurkat-Rott K., Lehmann-Horn F. Muscle channelopathies and critical points in functional and genetic studies. J. Clin. Invest. 2005;115:2000–2009. doi: 10.1172/JCI25525. [DOI] [PMC free article] [PubMed] [Google Scholar]
- 33.Weiss R.G., O'Connell K.M., Flucher B.E., Allen P.D., Grabner M. Functional analysis of the R1086H malignant hyperthermia mutation in the DHPR reveals an unexpected influence of the III–IV loop on skeletal muscle EC coupling. Am. J. Physiol. Cell Physiol. 2004;287:C1094–C1102. doi: 10.1152/ajpcell.00173.2004. [DOI] [PubMed] [Google Scholar]
Associated Data
This section collects any data citations, data availability statements, or supplementary materials included in this article.