

Abstract
Background and Aims
Early observations that genome size was positively correlated with cell size formed the basis of hypothesized consequences of genome size variation at higher phenotypic scales. This scaling was supported by several studies showing a positive relationship between genome size and seed mass, and various metrics of growth and leaf morphology. However, many of these studies were undertaken with limited species sets, and often performed within a single genus. Here we seek to generalize the relationship between genome size and the phenotype by examining eight phenotypic traits using large cross-species comparisons involving diverse assemblages of angiosperm and gymnosperm species. These analyses are presented in order of increasing scale (roughly equating to the number of cells required to produce a particular phenotypic trait), following the order of: cell size (guard cell and epidermal), stomatal density, seed mass, leaf mass per unit area (LMA), wood density, photosynthetic rate and finally maximum plant height.
Scope
The results show that genome size is a strong predictor of phenotypic traits at the cellular level (guard cell length and epidermal cell area had significant positive relationships with genome size). Stomatal density decreased with increasing genome size, but this did not lead to decreased photosynthetic rate. At higher phenotypic scales, the predictive power of genome size generally diminishes (genome size had weak predictive power for both LMA and seed mass), except in the interesting case of maximum plant height (tree species tend to have small genomes). There was no relationship with wood density. The general observation that species with larger genome size have larger seed mass was supported; however, species with small genome size can also have large seed masses. All of these analyses involved robust comparative methods that incorporate the phylogenetic relationships of species.
Conclusions
Genome size correlations are quite strong at the cellular level but decrease in predictive power with increasing phenotypic scale. Our hope is that these results may lead to new mechanistic hypotheses about why genome size scaling exists at the cellular level, and why nucleotypic consequences diminish at higher phenotypic scales.
Key words: Genome size, cell size, stomata density, guard cell, LMA, photosynthesis, scaling
INTRODUCTION
The functional significance of the profound variation in plant genome size is still largely unknown and represents one of the most significant unanswered questions in plant biology. There has been great interest in linking this variation to plant phenotypic traits. Early observations that genome size was positively correlated with cell size, and the duration of meiosis, formed the basis of hypothesized genome size consequences at higher phenotypic scales (Bennett, 1971, 1972, 1987). This scaling was supported by numerous studies showing a positive relationship between genome size and seed mass (see table 4 in Knight et al., 2005, for a list of studies), leaf anatomical traits (Castro-Jimenez et al., 1989; Chung et al., 1998; Wakamiya et al., 1993) and growth rate (see table 6 in Knight et al., 2005, for a list of studies). In addition, several studies have documented relationships between environmental conditions (temperature, water availability, latitude and elevation) and genome size (reviewed by Knight and Ackerly, 2002). These environmental predictors of genome size might be a consequence of genome size change.
To date, most studies have investigated limited subsets of species (often performed within individual genera or families). Therefore, the generality of genome size correlations with phenotypic traits is unknown. It is possible that the there is no direct, or general phenotypic consequences of variation in plant genome size (Oliver et al., 2007), or it may be that any significant associations are mitigated through some other third factor (Beaulieu et al., 2007b). Regardless, establishing the generality of any phenotypic correlation with genome size is a logical first step. The analyses presented here have benefited from large cross-species comparisons involving diverse assemblages of angiosperm and gymnosperm species (often involving 100 or more species). The goal is to generalize the phenotypic consequences (or correlations) of genome size variation at several different phenotypic scales (Fig. 1). It is our hope that after the generality of these patterns has been established, new mechanistic hypotheses will be proposed, and experiments performed to explain how genome size affects the phenotype.
Fig. 1.

Conceptual organization of phenotypic scale involving the traits examined in this paper.
Pattern searching across large comparative data sets is prone to mistakes when phylogenetic information is not taken into consideration. While a simple regression or correlation statistic may document a predictive relationship between two traits, evolutionary inferences should not be drawn from regression analyses. For evolutionary inferences, methods to incorporate the phylogenetic tree of a species set should be used (see Felsenstein, 1985; Harvey and Pagel, 1991; Garland et al., 1992; http://www.phylodiversity.net/phylocom/). Because of the centrality of the independent contrast method to pattern searching in comparative biology, and because of the continued publication of studies in which independent contrasts should be used but are not, a brief tutorial on how to carry out these analyses is presented in Fig. 2.
Fig. 2.

A traditional bivariate scatter plot of two variables, such as genome size and guard cell length (A), will normally include a regression line, and the significance of such a relationship expounded. It is important to note that this is a predictive relationship between x and y, but not an evolutionary prediction, and it violates the assumption that the data are independent because all species share varying degrees of evolutionary relatedness (as depicted for the species in A in the phylogenetic tree presented in D). Independence is achieved by calculating differences in trait values between all sister taxa (one such calculation is highlighted in B). This calculation is performed iteratively across the entire phylogeny essentially transforming the data into n – 1 estimates of evolutionary change, which are then plotted in a new Cartesian space (C). A regression can be calculated from these data representing the unweighted average of all evolutionary changes between two traits. For heuristic purposes, highlighted are divergences at several different taxonomic levels shown in (C) and (D) with the same symbols.
Here we review a series of analyses on the relationship between genome size and the phenotype in order of increasing scale (roughly equating to the number of cells required to produce a particular phenotypic trait): cell size (guard cell and epidermal cell), stomata density, seed mass, leaf mass per unit area (LMA), wood density, photosynthetic rate and finally maximum plant height (Fig. 1). The analyses reviewed below involved two metrics of cellular DNA content: first, the 2C DNA content, which is the total amount of DNA in an unreplicated somatic cell; and second, the 1Cx DNA content, which is the ploidy-corrected monoploid genome size of a species (sensu Greilhuber et al., 2005). As similar results were found for both metrics we just give the data for 2C DNA amounts and refer to this as ‘genome size’ correlations throughout.
THE SCALING OF GENOME SIZE AND CELL SIZE
Guard cells are one of the smallest cell types in plants. They are good candidates for this study because they rarely undergo endoreduplication while other leaf cells may be highly endoreduplicated (i.e. Arabidopsis; Melaragno et al., 1993). Furthermore, it is conceivable that selection pressures operate strongly on guard cell size parameters, and thus, if genome size increases manifest with increased guard cell size too, the generality of the relationship is strengthened. We tested the hypothesis that genome size is correlated with cell size using three different cell types (guard cells, epidermal cells and unicellular diatom cell volumes) (Beaulieu et al., 2007c). Briefly, epidermal impressions (made using clear nail varnish) of a diverse assemblage of angiosperms were taken from the living collections at Royal Botanical Gardens, Kew (102 species in total). Guard cell length on both the abaxial and the adaxial surfaces of mature, fully expanded leaves was measured from digital photographs of these impressions (further description of the methods will be given in a forthcoming paper).
A strong positive association was found between genome size and guard cell length, with genome size explaining 61 % of the variation in guard cell length (Figs 3 and 4A, Table 1). Independent contrast analyses supported this conclusion, albeit with a slightly lower R2 value (0·61 vs. 0·42). This is a remarkably strong relationship. What is surprising is that guard cell length seems to scale directly with genome size rather than setting a minimum threshold (Figs 3 and 4A). It seems plausible that guard cells may be large for species with large genome sizes due to space constraints imposed by an increase in the amounts of bulk DNA. However, it is not obvious why species with small genome sizes have small guard cell sizes, as there could be many other factors that may increase guard cell size irrespective of genome size. However, that is not what the data show.
Fig. 3.
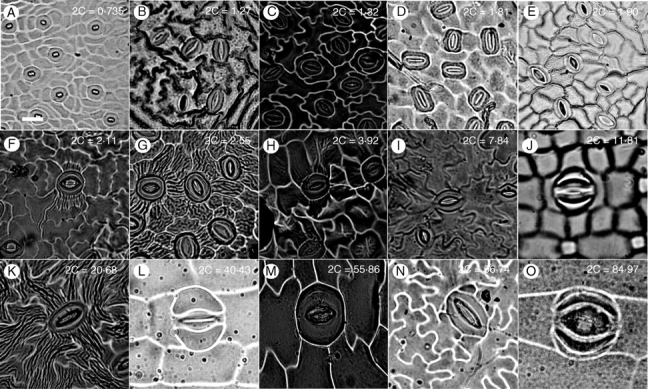
Abaxial leaf epidermal impressions (from nail polish) demonstrating guard cell size in relation to 2C DNA amount (indicated in white text to the right of each letter). All photographs are 40× magnification. White scale bar in (A) = 20 µm. (A) Citrus aurantifolia, (B) Rosa acicularis, (C) Origanum vulgare, (D) Quercus robur, (E) Fraxinus excelsior, (F) Ligustrum vulgare, (G) Platanus orientalis, (H) Cypripedium irapeanum, (I) Capsicum annuum, (J) Zingiber officinale, (K) Sambucus racemosa, (L) Tradescantia paludosa, (M) Cypripedium formosanum, (N) Paeonia clusii, (O) Tradescantia virginiana.
Fig. 4.

The relationship between genome size and (A) guard cell length, (B) epidermal cell area, (C) stomatal density and (D) mass-based photosynthetic rate (Amass). For D, the data are split into angiosperms (closed circles) and gymnosperms (open circles). At the cellular level, there is a strong positive relationship between 2C DNA content and (A) guard cell length and (B) epidermal cell area. There was also a significant negative relationship between 2C DNA content and (C) stomatal density. At a higher phenotypic scale, there is a weak negative relationship between 2C DNA content and (D) Amass across all seed plants. However, for gymnosperms alone the relationship is significantly negative, whereas for angiosperms alone the slope is nearly zero. See Table 1 for a more complete statistical description.
Table 1.
Regression and independent contrast statistics for the relationship between genome size (2C DNA content) and each of the eight phenotypic traits analysed
| Regression |
Independent contrasts |
|||||
|---|---|---|---|---|---|---|
| Trait | Slope | R2 | P | Slope | R2 | P |
| Maximum plant height (m) | –0·21 | 0·03 | <0·001 | 0·08 | 0·01 | NS |
| Amass (nmol g–1 s–1) | –0·02 | <0·001 | NS | 0·01 | <0·001 | NS |
| Wood density (kg m–3) | –0·04 | 0·01 | NS | –0·02 | 0·002 | NS |
| LMA (g m–2) | –0·10 | 0·03 | <0·01 | 0·17 | 0·055 | 0·001 |
| Seed mass (mg) | –0·02 | <0·001 | NS | 0·38 | 0·03 | <0·001 |
| Stomatal density (no. mm–2) | –0·36 | 0·34 | <0·001 | –0·32 | 0·18 | <0·001 |
| Epidermal cell area (μm2) | 0·56 | 0·59 | <0·001 | 0·40 | 0·22 | <0·001 |
| Guard cell length (μm) | 0·20 | 0·61 | <0·001 | 0·18 | 0·42 | <0·001 |
These data are for relationships within angiosperms only. Traits are arranged in the same order as in Fig. 1.
Epidermal cell areas are intricately margined and therefore no simple dimensional analysis other than two-dimensional projected area would suffice for cell size. A strong positive association was found between genome size and epidermal cell area, with genome size explaining 59 % of the total variation in area (Fig. 4B, Table 1). Again, this relationship was quite linear, with no indication of threshold effects. Species with small genome size had small epidermal cell areas, and species with large genome size had large epidermal cell areas. The observation was supported by independent contrast statistics, albeit with a lower percentage of the variation explained (0·59 vs. 0·22).
Recently, a significant relationship between genome size and unicellular diatom cell volume was reported for unicellular diatoms (Connolly et al., 2007). They studied 16 species and found a significant positive relationship that explained 69 % of the variation in cell volume for these diatoms. This result was supported using independent contrasts. These results, combined with similar trends in the animal world (see Discussion), suggest that cell volume scaling with genome size is a general phenomenon for all life.
GENOME SIZE SCALING TO STOMATAL DENSITY AND PHOTOSYNTHETIC RATE
Stomatal density on the abaxial surface was measured using the same images collected to measure guard cell length (Beaulieu et al., 2007c). There was a strong link between stomatal density and genome size (Fig. 4C). As genome size increases, stomatal density decreases. However, genome size explains less of the variation in stomatal density (R2 = 0·34) than either guard cell length or epidermal cell size (Table 1). This is the first hint that genome size effects diminish as we move up in phenotypic scale. The link between genome size and stomatal density was supported with independent contrast statistics, although again with lower percentage of the variation explained (0·32 versus 0·18). Decreased stomatal density is partly determined by increasing epidermal cell area (Beerling and Chaloner, 1993). Furthermore, stomatal density also decreases with increasing guard cell size (Heatherington and Woodward, 2003; Beaulieu et al., 2007c).
It seems possible that changes in stomatal density could affect the gas exchange characteristics of a species, including the transpiration and photosynthetic rate. Previously, we measured photosynthetic rate for 112 angiosperm species with known genome size that were growing in the living collections at the Royal Botanical Gardens, Kew (Beaulieu et al., 2007b). The data for photosynthetic rate highlight the importance of using independent contrast methodology. There is a large basal divergence between angiosperms and gymnosperms (Fig. 4D). If a correlation is plotted across all species, it is significant, and negative (Table 1). However, this is largely due to the fact that gymnosperms as a group have, on average, larger genomes and lower photosynthetic rates, while angiosperms typically have smaller genome sizes, and higher photosynthetic rates. Within angiosperms alone, there is no relationship between genome size and photosynthetic rate. There is a weak negative relationship within gymnosperms alone. Splitting the data into these two groups is the first step to incorporating the evolutionary history of species; however, the problem spans every divergence in the phylogeny. Independent contrast analyses reveal that there has not been correlated evolution between genome size and photosynthetic rate both across all species and within angiosperms alone.
GENOME SIZE SCALING WITH SEED MASS
Beaulieu et al. (2007a) examined the relationship between genome size and seed mass by testing the relationship across 1222 species, from 139 families and 48 orders of seed plants using information from the Seed Information Database (SID; Flynn et al., 2004). They found that there was no significant linear regression relationship between genome size and seed mass across 1222 species despite the multitude of studies that have documented such trends in smaller subsets of species. However, they did discover a unique threshold effect of genome size variation. Species with very large genome sizes never had small seeds, while species with small genome sizes had a large range of seed sizes (Fig. 5A). Independent contrast analyses increased the percentage variation in seed size explained by genome size, although the percentages were both very small (Table 1). By plotting the slopes within all congeneric sets of species, both positive and negative slopes were apparent (Fig. 5A). However, by sign test, there were significantly more positive slopes than negative slopes. Interestingly, of all predictors of seed mass, genome size ranks quite highly on a recent list compiled by Moles et al. (2005).
Fig. 5.

The relationship between genome size and (A) seed mass, (B) leaf mass per unit area (LMA), (C) wood density and (D) maximum plant height. The data are split into angiosperms (closed circles) and gymnosperms (open circles). There is a significant positive relationship between 2C DNA content and (A) seed mass across all species. However, the positive relationship was not consistent across congeneric species (each black line corresponds to a congeneric slope). For 2C DNA content and (B) LMA, angiosperms alone have a significant negative relationship, and gymnosperms alone have a significant positive relationship. For 2C DNA content and (C) wood density the significant negative relationship across all species was not maintained within either angiosperms or gymnosperms. For 2C DNA content and (D) maximum plant height, there is a significant negative relationship within angiosperms with large genome angiosperms never being associated with large height. In (D), each grey line corresponds to a different quantile of data to highlight the boundary to the distribution for larger genome sizes. See Table 1 for a more complete statistical description.
GENOME SIZE SCALING WITH LMA AND WOOD DENSITY
Following on from genome size to cell size the next logical phenotypic level is at the density of plant material. The fact that much of the biomass of plant material is composed of cell walls and that larger cells have a smaller ratio of cell wall per unit volume lead to the prediction that increasing cell size should lead to decreasing cell and mass density (on a dry weight basis). Likewise, because the relationship between genome size and cell volume is so robust, density parameters such as LMA and wood density should be correlated with genome size. We envisaged that these links would be negative; as genome size increases, density would decrease. LMA is perhaps the most predictive trait for plant physiology. If you know the LMA of a species, you can make a reasonable prediction of its leaf life span, growth rate, photosynthetic rate, nitrogen content and many other traits (Wright et al., 2004). Nevertheless, the genetic basis of variation in LMA is largely unknown; therefore, it was of interest to us to test whether genome size variation was associated with LMA variation.
LMA data were collected for all species for which we had measured the photosynthetic, and additional observations were added from Glopnet (Wright et al., 2004). Across 274 species of both angiosperms and gymnosperms there was a weak positive relationship that was significant. However, the relationship was significant and negative within angiosperms and significant and positive within gymnosperms (Fig. 5B). Interestingly, independent contrast results showed that there has been significant positive correlated evolution between LMA and genome size that was driven by divergences in angiosperms. Again, however, the relationship was quite weak (R2 = 0·05; Table 1).
Wood density information was generously provided by Nathan Swenson, who previously reported the database in Swenson and Enquist (2007). Across 200 species, wood density followed a similar trend, with a marked difference between angiosperms and gymnosperms, with gymnosperms having marginally less dense wood on average and significantly larger genome sizes (Fig. 5C). However, both regression and independent contrast analyses failed to uncover any significant relationship between the two traits (Table 1).
GENOME SIZE SCALING WITH PLANT HEIGHT
Maximum plant height information was obtained from both Glopnet (Wright et al., 2004) and the SID (Flynn et al., 2004). There was a triangular relationship between genome size and maximum plant height across 324 species of angiosperms. As genome size increases maximum plant height decreases within angiosperms (Fig. 5D). This relationship was significant for regression analyses but not for independent contrasts.
CONCLUSIONS
The relationship between genome size and phenotypic traits decreases at higher phenotypic scales. This is somewhat surprising given the strength of the relationship at the cellular level. By contrast, it seems that compensatory mutations have occurred such that leaf and wood density are largely unaffected by changes in cell size, and likewise, variation in seed mass is only marginally affected by changes in genome size, and there is no relationship with photosynthetic rate. Interestingly, there is a significant association with maximum plant height.
The genome size effect on cell size is not unique to seed plants, as other investigators have documented positive relationships with animal cell sizes, such as for red blood cell size in fishes, amphibians, reptiles, birds and mammals (Gregory, 2005). The generality of this phenomenon begs for a better mechanistic understanding for why it exists. Because of the linearity of the response, it appears that there is a functional relationship. In addition, guard cell sizes proportionally increase in polyploid series (Masterson, 1994), also suggesting a direct DNA content effect on cell size. We suggest a functional hypothesis for why this relationship exists that involves an osmotic effect of DNA. Nucleotides are charged solutes that may decrease the osmotic potential of plant cells and draw in more water, increasing turgor pressure, and perhaps resulting in larger cells.
Discrepancies between regression and independent contrast analyses can reveal important patterns in the evolution of phenotypic traits. In the work presented here, for angiosperms (Table 1), independent contrast analyses had uniformly lower variation explained by genome size for five of the eight traits considered. Strong regression and weak independent contrast results arise when large divergences deep in the phylogeny are highly influential and more recent divergences are much smaller. This result can be an indication of significant trait shifts at higher taxonomic levels with subsequent trait conservatism operating among more closely related species (Ackerly and Donoghue, 1998; Ackerly and Reich, 1999). The most obvious example of this process is the evolutionary divergence between angiosperms and gymnosperms. Not only is this divergence important in shaping genome size variation among extant species, but it also resulted in significant trait shifts coinciding with an apparent reduction in genome size within the angiosperms (Leitch et al., 1998; Beaulieu et al., 2007a, b). The functional and physiological significance of genome size during these important evolutionary events may provide insights into understanding the influence of genome size evolution at higher phenotypic scales.
The strength of correlations between guard cell length and epidermal cell area is remarkably strong and allows for the possibility of genome size inferences of extinct fossilized species. Early work by Thomson (1972), Thomson and Muraszko (1978) and Conway Morris and Harper (1988) demonstrated the strength of this kind of approach by identifying intriguing evolutionary trends in genome size within and among various vertebrate groups (reviewed by Leitch, 2007). The recent study of Organ et al. (2007) has ignited a renewed interest in this area of research by clearly showing that the small genomes of bird species were a pre-existing trait within a lineage of dinosaurs. For plant biology, this same approach can be used to determine the response of genome size to climatic catastrophe (i.e. the KT extinction event). Which species survived? Was there a genome size filter? There is evidence suggesting that species with smaller genome size are more invasive (Bennett et al., 1998) and grow in more extreme environments (Knight and Ackerly, 2002). Therefore, these species may be more likely to survive a climatic catastrophe such as the KT event. We propose a concerted effort to align databases of fossilized leaf impressions with known fossil ages to address this question. We also encourage the continued effort in joining the Plant DNA C-values database (Bennett and Leitch, 2005) and other functional trait databases, such as Glopnet (Wright et al., 2004), SID (Flynn et al., 2004), wood density (Swenson and Enquist, 2007), The Ecological Flora of California (http://ucjeps.berkeley.edu/efc) and BiolFlor (www.ufz.de/biolflor). Through this effort, the patterns will soon be fully described, and processed-based studies can be initiated for traits that are significantly correlated with genome size.
LITERATURE CITED
- Ackerly DD. Analysis of Traits (AOT): a module of Phylocom. 2006. Version 3·1. http://www.phylodiversity.net/phylocom/ [Google Scholar]
- Ackerly DD, Donoghue MJ. Leaf size, sapling allometry, and Corner's rules: phylogeny and correlated evolution in maples (Acer) American Naturalist. 1998;152:767–791. doi: 10.1086/286208. [DOI] [PubMed] [Google Scholar]
- Ackerly DD, Reich PB. Convergence and correlations among leaf size and function in seed plants: a comparative test using independent contrasts. American Journal of Botany. 1999;86:1272–1281. [PubMed] [Google Scholar]
- Beaulieu JM, Moles AT, Leitch IJ, Bennett MD, Dickie JB, Knight CA. Correlated evolution of genome size and seed mass. New Phytologist. 2007;a 173:422–437. doi: 10.1111/j.1469-8137.2006.01919.x. [DOI] [PubMed] [Google Scholar]
- Beaulieu JM, Leitch IJ, Knight CA. Genome size evolution in relation to leaf strategy and metabolic rates revisited. Annals of Botany. 2007;b 99:495–505. doi: 10.1093/aob/mcl271. [DOI] [PMC free article] [PubMed] [Google Scholar]
- Beaulieu JM, Leitch IJ, Patel S, Pendharkar A, Knight CA. Genome size is a strong predictor of cell size and stomatal density in angiosperms. 2007;c doi: 10.1111/j.1469-8137.2008.02528.x. [DOI] [PubMed] [Google Scholar]
- Beerling DJ, Chaloner WG. Evolutionary responses of stomatal density to global CO2 change. Biological Journal of the Linnean Society. 1993;48:343–353. [Google Scholar]
- Bennett MD. The duration of meiosis. Proceedings of the Royal Society of London, Series B. 1971;178:277–299. [Google Scholar]
- Bennett MD. Nuclear DNA content and minimum generation time in herbaceous plants. Proceedings of the Royal Society of London, Series B. 1972;181:109–135. doi: 10.1098/rspb.1972.0042. [DOI] [PubMed] [Google Scholar]
- Bennett MD. Variation in genomic form in plants and its ecological implications. New Phytologist. 1987;106:177–200. [Google Scholar]
- Bennett MD, Leitch IJ. Plant DNA C-values database (release 4·0, October 2005) 2005 http://www.kew.org/genomesize/homepage . [Google Scholar]
- Bennett MD, Leitch IJ, Hanson L. DNA amounts in two samples of angiosperm weeds. Annals of Botany. 1998;82:121–134. [Google Scholar]
- Castro-Jimenez Y, Newton RJ, Price HJ, Halliwell RS. Drought stress response of Microseris species differing in nuclear DNA content. American Journal of Botany. 1989;76:789–795. [Google Scholar]
- Chung J, Lee JH, Arumuganathan K, Graef GL, Specht JE. Relationships between nuclear DNA content and seed and leaf size in Soybean. Theoretical and Applied Genetics. 1998;96:1064–1068. [Google Scholar]
- Connolly JA, Oliver MJ, Beaulieu JM, Knight CA, Tomanek L, Moline MA. Journal of Phycology. 2007. Correlated evolution of genome size and cell volume in diatoms (Bacillariophyceae) (in press) doi: 10.1111/j.1529-8817.2007.00452. [DOI] [PubMed] [Google Scholar]
- Conway Morris S, Harper E. Genome size in Conodonts (Chordata): inferred variation during 270 million years. Science. 1988;241:1230–1232. doi: 10.1126/science.241.4870.1230. [DOI] [PubMed] [Google Scholar]
- Felsenstein J. Phylogenies and the comparative method. American Naturalist. 1985;125:1–15. doi: 10.1086/703055. [DOI] [PubMed] [Google Scholar]
- Flynn S, Turner RM, Dickie JB. Seed Information Database (release 6·0, October 2004) 2004. http://www.rbgkew.org.uk/data/sid .
- Garland T, Jr, Harvey PH, Ives AR. Procedures for the analysis of comparative data using phylogenetically independent contrasts. Systematic Biology. 1992;42:265–292. [Google Scholar]
- Gregory TR. Genome size evolution in animals. In: Gregory TR, editor. The evolution of the genome. Elsevier: San Diego; 2005. pp. 3–87. [Google Scholar]
- Greilhuber J, Doležel J, Lysák MA, Bennett MD. The origin, evolution, and proposed stabilization of terms ‘genome size’ and ‘C-value’ to describe nuclear DNA contents. Annals of Botany. 2005;95:255–260. doi: 10.1093/aob/mci019. [DOI] [PMC free article] [PubMed] [Google Scholar]
- Harvey PH, Pagel MD. The comparative method in evolutionary biology. Oxford: Oxford University Press; 1991. p. 239. [Google Scholar]
- Heatherington AM, Woodward FI. The role of stomata in sensing and driving environmental change. Nature. 2003;424:901–908. doi: 10.1038/nature01843. [DOI] [PubMed] [Google Scholar]
- Knight CA, Ackerly DD. Variation in nuclear DNA content across environmental gradients: a quantile regression analysis. Ecology Letters. 2002;5:66–76. [Google Scholar]
- Knight CA, Molinari NA, Petrov DA. The large genome constraint hypothesis: evolution, ecology, and phenotype. Annals of Botany. 2005;95:177–190. doi: 10.1093/aob/mci011. [DOI] [PMC free article] [PubMed] [Google Scholar]
- Leitch IJ. Genome sizes through the ages. Heredity. 2007;99:121–122. doi: 10.1038/sj.hdy.6800981. [DOI] [PubMed] [Google Scholar]
- Leitch IJ, Chase MW, Bennett MD. Phylogenetic analysis of DNA C-values provides evidence for a small ancestral genome size in flowering plants. Annals of Botany. 1998;82:85–94. [Google Scholar]
- Masterson J. Stomatal size in fossil plants: evidence for polyploidy in majority of angiosperms. Science. 1994;264:421–424. doi: 10.1126/science.264.5157.421. [DOI] [PubMed] [Google Scholar]
- Moles AT, Ackerly DD, Webb CO, Tweddle JC, Dickie JB, Pitman AJ, Westoby M. Factors that shape seed mass evolution. Proceedings of the National Academy of Sciences of the USA. 2005;102:10540–10544. doi: 10.1073/pnas.0501473102. [DOI] [PMC free article] [PubMed] [Google Scholar]
- Melaragno JE, Mehrotra B, Coleman AW. Relationship between endopolyploidy and cell size in epidermal tissue of Arabidopsis. The Plant Cell. 1993;5:1661–1668. doi: 10.1105/tpc.5.11.1661. [DOI] [PMC free article] [PubMed] [Google Scholar]
- Oliver MJ, Petrov D, Ackerly DD, Falkowski P, Schofield OM. The mode and tempo of genome size evolution in eukaryotes. Genome Research. 2007;17:594–601. doi: 10.1101/gr.6096207. [DOI] [PMC free article] [PubMed] [Google Scholar]
- Organ CL, Shedlock AM, Meade A, Pagel M, Edwards SV. Origin of avian genome size and structure in non-avian dinosaurs. Nature. 2007;446:180–184. doi: 10.1038/nature05621. [DOI] [PubMed] [Google Scholar]
- Swenson NG, Enquist BJ. Ecological and evolutionary determinants of a key plant functional trait: wood density and its community-wide variation across latitude and elevation. American Journal of Botany. 2007;94:451–459. doi: 10.3732/ajb.94.3.451. [DOI] [PubMed] [Google Scholar]
- Thomson KS. An attempt to reconstruct evolutionary changes in the cellular DNA content of lungfish. Journal of Experimental Zoology. 1972;180:363–372. [Google Scholar]
- Thomson KS, Muraszko K. Estimation of cell size and DNA content in fossil fishes and amphibians. Journal of Experimental Zoology. 1978;205:315–320. [Google Scholar]
- Wakamiya I, Newton RJ, Johnston SJ, Price JH. Genome size and environmental factors in the genus Pinus. American Journal of Botany. 1993;80:1235–1241. [Google Scholar]
- Wright IJ, Reich PB, Westoby M, Ackerly DD, Baruch Z, Bongers F, et al. The world-wide leaf economics spectrum. Nature. 2004;428:821–827. doi: 10.1038/nature02403. [DOI] [PubMed] [Google Scholar]