Abstract
Background and Aims
Perennial ryegrass (Lolium perenne) is one of the key forage and amenity grasses throughout the world. In the UK it accounts for 70 % of all agricultural land use with an estimated farm gate value of £6 billion per annum. However, in terms of the genetic resources available, L. perenne has lagged behind other major crops in Poaceae. The aim of this project was therefore the construction of a microsatellite-enriched genomic library for L. perenne to increase the number of genetic markers available for both marker-assisted selection in breeding programmes and gene isolation.
Methods
Primers for 229 non-redundant microsatellite markers were designed and used to screen two L. perenne genotypes, one amenity and one forage. Of the 229 microsatellites, 95 were found to show polymorphism between amenity and forage genotypes. A selection of microsatellite primers was selected from these 95 and used to screen two mapping populations derived from intercrossing and backcrossing the two forage and amenity grass genotypes.
Key Results and Conclusions
The utility of the resulting genetic maps for analysis of the genetic control of target traits was demonstrated by the mapping of genes associated with heading date to linkage groups 4 and 7.
Key words: Microsatellites, Lolium perenne, perennial ryegrass, trait mapping
INTRODUCTION
Genetic markers and linkage maps provide the basis for the development of superior varieties via marker-assisted selection in breeding programmes and for gene isolation via chromosome walking strategies (e.g. Armstead et al., 2006, 2007). A wide range of genetic markers has been developed and used over the past two decades. The usefulness of a genetic marker is decided by a wide range of factors including cost of development, ease of use and transferability within varieties of the same species or between species. Microsatellites are highly polymorphic, co-dominant markers found throughout both the transcribed and non-transcribed regions of a genome (Varshney et al., 2005). As PCR-based markers, their transferability both within and between species makes them a good choice for breeding programmes for, for example, tagging genes of interest.
Lolium perenne (2n = 2x = 14; DNA content = 2034 Mbp: Bennett and Smith, 1976) is one of the most economically and environmentally important grass species. For example, in the UK it accounts for 50 % of all land use and 70 % of all agricultural land use. Furthermore, this figure is likely to rise with increasing emphasis on sustainable agricultural practices, i.e. a move from concentrate to increasing grass consumption. The economic value of forage grass in the UK measured by its end products, meat and milk, is £6 billion per annum. This value compares well with £2·36 billion – the farm gate value of all cereals (wheat, barley and oats) (figures taken from ‘Agriculture in the UK’; DEFRA, 2002). In addition, the value of grass will continue to increase in line within an increase in the requirement for meat and milk at a rate of 7 % per annum.
In addition to conventional agricultural use, grass is of fundamental importance for the development of environmentally friendly biofuels and platform chemicals. Leisure activities, such as tourism, gardening and sport, and associated industries, e.g. garden machinery/equipment, sports equipment, sports media coverage, etc., are valued at hundreds of billions of euros per annum throughout the European Union.
The number of microsatellites for use in the Lolium–Festuca complex of grasses that are publicly available has really only started to increase in the last few years, e.g. Kubik et al. (1999, 2001), Jones et al. (2001, 2002), Warnke et al. (2004), Lauvergeat et al. (2005), Jensen et al. (2005) and Studer et al. (2006). This project was started with the aim of developing a genomic microsatellite library for L. perenne, which would then be combined with a set of EST-based microsatellites produced from a L. perenne GeneThresher database (Gill et al., 2006). Genomic microsatellites can be produced from both transcribed and non-transcribed regions of the genome, but microsatellites derived from coding regions, e.g. ESTs and GeneThresher databases, tend to be concentrated in the gene-rich regions of the genome (Varshney et al., 2005). Therefore a combination of the two sets of microsatellites would be expected to give as wide a genome coverage as possible.
As already stated, genetic linkage mapping provides the basis for the development of superior varieties via marker-assisted selection in breeding programmes and for gene isolation via chromosome walking strategies. A key trait within crops principally grown for their vegetative organs, such as L. perenne, is the transition to flowering growth as this has impacts both on performance traits associated with the vegetative growth phase and seed yield. Therefore, as an initial step in assessing the utility of the microsatellite linkage maps for both marker-assisted selection and gene isolation, heading date was also studied in the L. perenne populations being screened with the microsatellites.
MATERIALS AND METHODS
Plant material
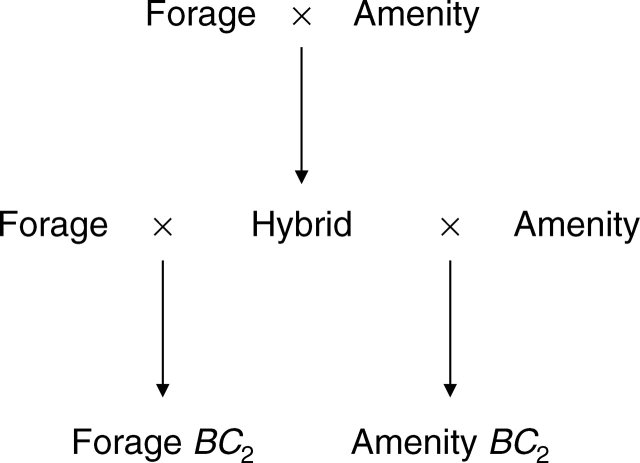
Two Lolium perenne genotypes (2n = 2x = 14), one amenity (IGER accession Ba11773 3/33/8) and one forage (IGER accession Ba12142 3/34/8) were selected and intercrossed to produce an F1 hybrid (Fig. 1). This was then cloned and backcrossed to the amenity and forage parental genotypes to produce two BC2 mapping populations (Fig. 1).
Fig. 1.
Development of forage and amenity mapping populations.
Microsatellites
Six microsatellite-enriched libraries of a L. perenne genotype (Liprio) were constructed using the procedure of Edwards et al. (1996). DNA extraction was performed using a Nucleon Phytopure Kit (GE Healthcare, Little Chalfont, Bucks, UK). In order to minimize problems with restriction sites, the libraries were based on three enzymes (RsaI, AluI and HaeII). Two units of each enzyme were used to digest separately two replicates of 200 ng of genomic DNA in a volume of 50 µL for 2 h at 37 °C. At the end of 2 h, 1 µg of an MluI adaptor (consisting of a 21-mer oligonucleotide 5'-CTCTTGCTTACGCGTGGACTA-3′ and a phosphorylated 25-mer oligonucleotide: 5′-pTAGTCCACGCGTAAGCAAGAGCACA-3′), 3 µL 10 mm ATP and 1 unit of T4 ligase were added. Ligation was carried out overnight at room temperature in the dark. The ligated DNA was then denatured by boiling for 5 min. Enrichment for microsatellites was carried out using 100 ng of the ligated, denatured DNA in 500 µL hybridization buffer [50 % formamide, 3× standard saline citrate (SSC; 45 mm sodium citrate, pH 7·0, 450 mm NaCl), 25 mm Na-phosphate, pH 7·0 and 0·5 % sodium dodecyl sulphate (SDS)] containing 1 µg of the 21-mer oligonucleotide (5′-CTCTTGCTTACGCGTGGACTA-3′). The DNA solution was incubated at 45 °C for ∼24 h with a single Hybond N+ filter with bound oligonucleotides. [Hybond filters were prepared using two different oligonucleotides – CA(15) and CT(15). One hundred micrograms of one oligonucleotide brought to 1 mL with 2× SSC was spotted onto a 1·0 × 15 cm2 piece of Hybond® N+ (Amersham, Arlington Heights, IL, USA), air dried for 1 h and then baked for 1 h at 65 °C. The dry membrane was UV-treated for 30 s using a 260-nm transilluminator. Weakly bound oligonucleotides were washed off the membrane by washing twice in 10 mL of hybridization buffer at 45 °C for 2 d.] Thus six libraries were produced with DNA digested with three different enzymes undergoing filter selection for two dinucleotide repeats. Following hybridization, the filter was washed five times (5 min per wash) in 2× SSC, 1 % SDS at 65 °C and three times (5 min per wash) in 0·5× SSC, 1 % SDS at 65 °C. Bound DNA was eluted in 200 µL sterile distilled water by boiling for 5 min.
Three libraries were selected for characterization (based only on the criteria of two enzymes and two repeats). Three replicates of each library were amplified by PCR. The PCR conditions were (final volume of 50 µL): 1 µL of the eluted DNA, 0·4 µL Amplitaq Gold® Taq DNA polymerase with 5 µL of the manufacturer's buffer system, 1·25 mm of each dNTP and 200 ng of the 21-mer oligonucleotide. Thermal cycling was performed in an ABI9700 (Applied Biosystems, Warrington, UK) with an initial denaturation of 30 s at 94 °C, then 25 cycles of 20 s at 94 °C, 1 min at 60 °C and 3 min at 72 °C with a final extension of 10 min at 72 °C, after which like samples were pooled. Approximately 2·5 ng of the amplified DNA from the final amplification of the AluI CA, AluI CT and HaeII CA libraries was digested with 1 unit of MluI and ligated into 10 ng of a modified pUC19 vector (pJV1) containing a BssHII site (obtained from K. J. Edwards, University of Bristol). Inclusion of MluI in the ligation ensured that each plasmid contained only a single insert. Plasmids were transformed into BRL DH5α competent cells (Invitrogen, Paisley, UK) and plated onto LB-agar containing 100 µg mL−1 ampicillin and 40 mg mL−1 X-gal. Colonies were transferred into micro-plates after overnight incubation at 37 °C. Microsatellite-containing clones were selected using an appropriate 32P-labelled 30-mer oligonucleotide, i.e. CA(15) or CT(15). After sequencing with M13 forward and reverse primers, microsatellite containing sequences were entered into a local database to screen for redundancy. PCR primers were designed from the unique sequence flanking non-redundant microsatellites.
Primers were used to amplify DNA from the amenity and forage parents. The PCR amplification conditions were (final volume of 10 µL): 10 ng of DNA sample, 1 U of Faststart Taq polymerase with the manufacturer's buffer system (Roche, Lewes, Sussex, UK) 1·25 mm of each dNTP and 0·2 µm of each primer. Thermal cycling was performed with an initial denaturation of 5 min at 96 °C, then 40 cycles of 15 s at 96 °C, 30 s at 60 °C (the annealing temperature was adjusted for a small number of the microsatellite primers) and 30 s at 72 °C, with a final extension of 4 min at 72 °C. Products were run on 6 % denaturing polyacrylamide gels. Microsatellites were visualized using the Silver Sequence DNA Staining Reagents (Promega, Southampton, UK) with bands scored as present or absent.
Genetic mapping
Primers which generated polymorphisms between the two parental genotypes were identified. Fourteen of these primer pair sequences are given in Table 1 but academic research licenses are available for the primer sequences for all microsatellite markers developed from the genomic library (Institute of Grassland and Environmental Research, Plas Gogerddan, Aberystwyth, UK). A selection of these primers was then used to screen the two BC2 mapping populations (Fig. 1). JOINMAP, version 2·0 (Stam, 1993; Stam and van Ooijen; 1995), was used to place the genomic microsatellite markers into linkage groups in both the forage and amenity populations. Analyses were performed using a LOD threshold of 3 and Kosambi's mapping function (Kosambi, 1944). Selected microsatellite primers from the Vialactia GeneThresher database were also used (Gill et al., 2006). Primers selected were those already mapped to the Vialactia genetic linkage map of L. perenne and/or to a linkage map for water-soluble carbohydrate (WSC) produced at IGER (Turner et al., 2006). GeneThresher microsatellites derived from each of the seven linkage groups of L. perenne were used in order to allow the newly derived genomic microsatellites to be assigned to specific linkage groups.
Table 1.
Microsatellite primer sequences
| Microsatellite | Primer (forward and reverse) | Microsatellite motif |
|---|---|---|
| LpACT13H2 | f – TAACATTGATGCATGGGTTTC | CT(35) |
| r – ACTATTTAACTAGGATCCAAC | ||
| LpACT14A4 | f – CATGCTTGGACACTGTTAGCC | CT(21) |
| r – CTCTGTGCATATTCACGAGGG | ||
| LpACT14C9 | f – AATGATGGCACGGAGCAATCG | CT(22) |
| r – CTGTAATTCCAGGTCACTACC | ||
| LpACT15H3 | f – GACATCCATGCAAAATGTAAG | CT(33) |
| r – TCGTCACTTGCAAATATGAAC | ||
| LpACT43C6 | f – AGCGGGAAAGATACAGCGAAG | CT(29) |
| r – GAGCAAATTGGTGATCGCTAC | ||
| LpACT44A7 | f – CACGTAGAAGCCACACTTTAC | CT(60) |
| r – GTCACATTCCATTCACTTCCG | ||
| LpACT44B9 | f – TATGCAGCTTATGGGATCTTG | CT(38) |
| r – CGCATGCTGCACAATATCTGG | ||
| LpACA31C9 | f – CTGAATGCGCAAGCCGCATTC | CA(40) |
| r – CGATTTGCAAAACCGATGGTG | ||
| LpHCA16B2 | f – TGACAGTGTAGGCTAGTGATG | CA(16) |
| r – GAGTACAACATAGCAGATACC | ||
| LpHCA17C6 | f – AACAGCATCATGGATGCTAGG | CA(20) |
| r – ACGGTATGGGTATGCTGATCC | ||
| LpHCA17C11 | f – ACCGGGACAAAGGGCTAGTAC | CA(23) |
| r – CGCTCGATCGATCTGATCGTG | ||
| LpHCA18B12* | f – TCACGCTTGAAAGATAAACCC | CA(5)CA(9) |
| r – AACTCATGCAACACATGCATG | ||
| LpHCA18F11 | f – TTCACATGGCATGCACAAACC | CA(15) |
| r – AGGTATGACGTGCCGACATGC | ||
| LpHCA20F6 | f – GGGTCATCAGAGATCTTGCTC | CA(5) |
| r – TGCAGCTGGATGGATCAGCTC |
* The microsatellite motif detected by this pair of primers is an interrupted one; the two parts are separated by a 7-base insertion.
The forage mapping population was also screened for heading date in order to assess the utility of the microsatellites generated. The 100 genotypes making up the forage population were grown as spaced plants and induced to flower under field conditions. Heading date was scored as number of days from 1 April until there was a minimum of three inflorescences emerging from the flag leaf sheath. QTL analysis was carried out using MapQTL 4·0 (van Ooijen et al., 2002) using interval and MQM mapping. Co-factors for MQM mapping were identified using the automatic co-factor selection option within MapQTL 4·0.
In addition to screening the amenity forage parents, primers were also used to screen seven Lolium/Festuca substitution lines (King et al., 2002a, b). In each of these lines one of the seven L. perenne chromosomes has been replaced by its homoeologous equivalent from Festuca pratensis (2n = 2x = 14; DNA content = 2181 Mbp: Bennett et al., 1982) (King et al., 2008). Screening of the substitution lines was carried out on an ABI3100 (Applied Biosystems, Warrington, Lancs, UK).
RESULTS
The microsatellites developed from the genomic libraries were screened on the forage parent, the amenity parent and the forage/amenity hybrid to test for polymorphism (Table 2). A chi-square test, carried out on the number of polymorphic versus non-polymorphic microsatellites in the three libraries, proved slightly significant (χ2 = 3·867, 1 d.f.) at the 5 % level of probability. This therefore suggests that the level of polymorphism found in the microsatellites may vary depending both on the enzyme used to make the library and the repeat selected for. The AluI CT library proved the best source of polymorphic microsatellites for L. perenne with a ratio of polymorphic to non-polymorphic of 49 % : 35 %. In the AluI CA library the ratio was reversed, i.e. 36 % : 49 %, whereas the HaeII CA library provided an almost even split of polymorphic to non-polymorphic, i.e. 38 % : 43 %. Genomic microsatellites which produced products in L. perenne were also used to screen a set of seven Lolium perenne/Festuca pratensis monosomic substitution lines (data not shown), each with 13 L. perenne chromosomes and one F. pratensis chromosome. The microsatellite primers did not all produce an amplification product in the F. pratensis genotype used with the HaeII CA library giving the lowest percentage (38 % of AluI CT primers and 39 % of AluI CA primers produced amplification products in both the Lolium and Festuca genotypes compared with just 21 % of HaeII primers). Conversely, of those primers that did produce amplification products in both the Lolium and Festuca genotypes, the highest frequency of polymorphism was with those primers from the HaeII CA library (55 % of the HaeII CA primers giving amplification products in both Lolium and Festuca were polymorphic compared with 43 % of the AluI CT primers and 40 % of the AluI CA primers).
Table 2.
Microsatellites from the three genomic libraries screened on the amenity/forage parents (comparison of amplification products produced and levels of polymorphism)
| AluI CT | AluI CA | HaeII CA | |
|---|---|---|---|
| Polymorphic | 43 | 30 | 22 |
| Non-polymorphic | 31 | 41 | 25 |
| No amplification | 8 | 6 | 6 |
A total of 77 microsatellites was screened on 100 forage backcross plants and 79 amenity backcross plants (Fig. 1). Bands were screened as present or absent. The number of bands per microsatellite varied considerably (Table 3). In a number of the microsatellites, bands could only be scored for one of the populations as the bands in the other population were non-polymorphic (either absent from all BC2 plants or present in all).
Table 3.
Number of polymorphic bands per microsatellite primer pair in the forage and amenity populations
| No. of polymorphic bands | Forage population | Amenity population |
|---|---|---|
| 0 | 11 | 9 |
| 1 | 16 | 14 |
| 2 | 15 | 18 |
| 3 | 13 | 12 |
| 4 | 6 | 5 |
| 5 | 4 | 1 |
| 6 | 1 | 2 |
| 7 | 0 | 0 |
| 8 | 0 | 1 |
| NS | 11 | 15 |
NS shows number of microsatellites not scored due to scoring problems.
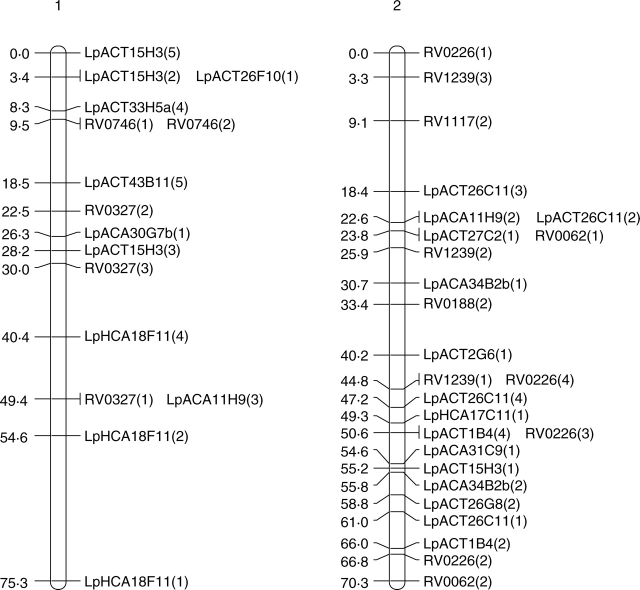
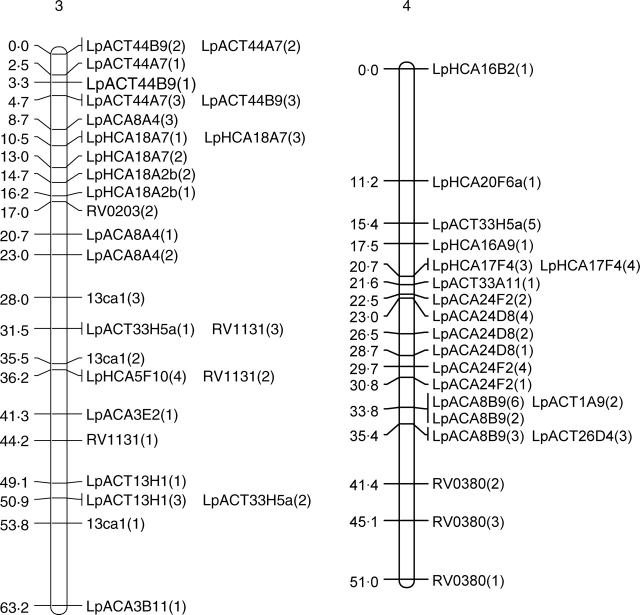
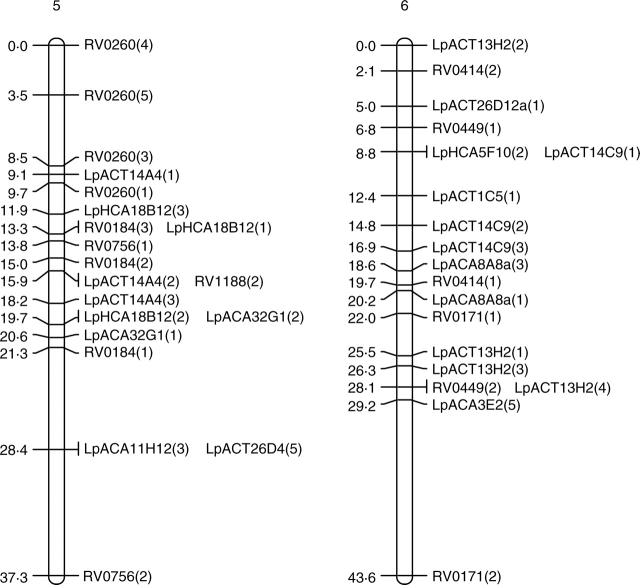
In both populations, JOINMAP produced seven distinct linkage groups although not all markers were included (Fig. 2). In the forage population, 52 primer pairs produced 118 segregating loci, whereas 47 primer pairs produced 94 segregating loci in the amenity population. With the exception of eight markers, those scored as polymorphic in both populations were placed in the same linkage groups. The eight exceptions to this were LpACA3B7a(1), LpACA3B7b(1), LpACT15H3(1), LpACT26C11(2), LpACT26C11(3), LpHCA18F11(2), LpHCA18F11(3) and LpHCA18F11(4). These eight markers were placed in linkage groups in the forage population but were left unlinked to any other markers by JOINMAP in the amenity population.
Fig. 2.
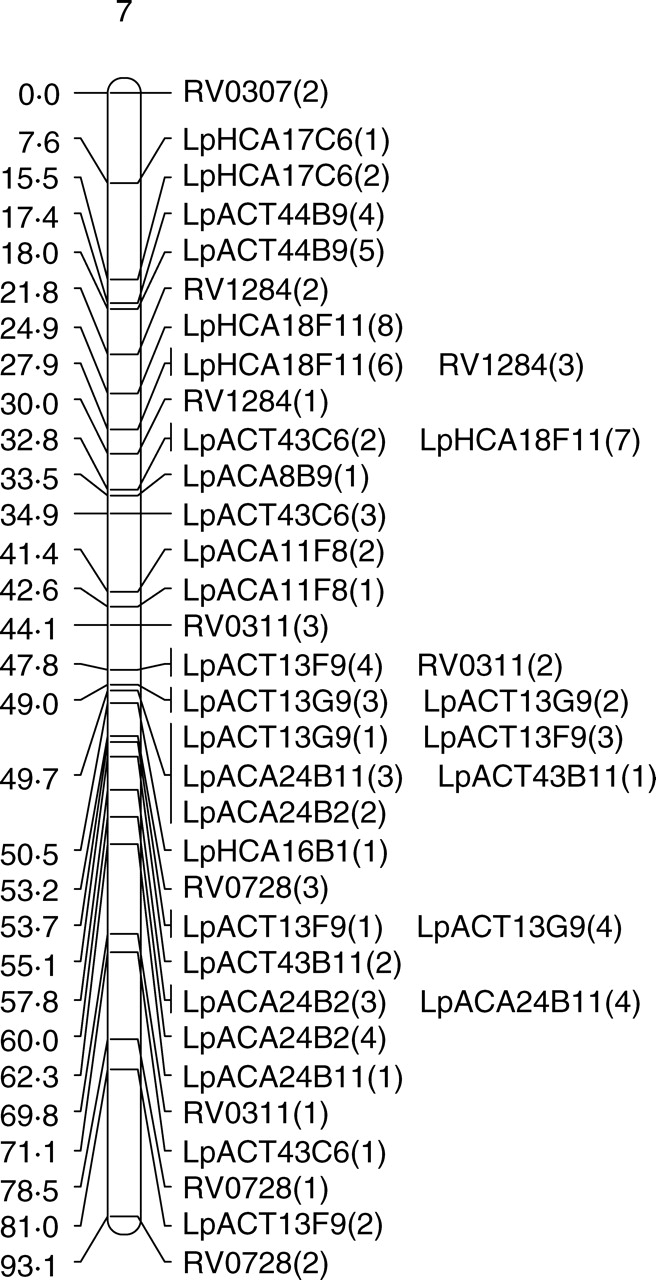
Genetic maps of the seven linkage groups based on the forage mapping population incorporating both the genomic microsatellites (prefixed Lp) and selected EST microsatellites from Vialactia (prefixed RV or 13). In the genomic microsatellites the letter following the Lp prefix donates the enzyme used to produce the library (A = AluI; H = HaeII) and the second and third letters show the dinucleotide repeat enriched for (CA or CT). Figures within parentheses show which band was being scored as polymorphic for a particular primer pair.
Selected Vialactia L. perenne GeneThresher microsatellite primers were also run on the 100 plants of the forage backcross population. The GeneThresher microsatellites were developed from a L. perenne GeneThresher library (Gill et al., 2006) and were therefore mainly developed from coding sequences, i.e. EST microsatellites. The mapping information for the GeneThresher microsatellites was combined with that obtained for the genomic microsatellites and JOINMAP run on the total data set. The GeneThresher microsatellites remained in the same linkage groups respective to each other in the forage population as they had previously been mapped to in the Vialactia genetic linkage map of L. perenne (Gill et al., 2006). The linkage groups in the GeneThresher-derived microsatellite map of L. perenne have previously been aligned to the orthologous Triticeae groups by comparison to a RFLP based map (Armstead et al., 2002; Gill et al., 2006). The seven linkage groups produced here were therefore designated LG1 to LG7 in accordance with the orthologous Triticeae group by reference to the Vialactia microsatellites (Fig. 2).
JOINMAP was then used to estimate the genetic distances between markers in each of the seven linkage groups of the forage population. The map derived from the forage mapping population covered a total genetic distance of 433·8 cM, with the smallest linkage group of 37·3 cM and the largest of 93·1 cM. JOINMAP was also used to estimate the genetic distances between markers in each of the seven linkage groups of the amenity population (although with considerably fewer data points available due to lower plant numbers and fewer markers these data can only be viewed as preliminary). The map derived from the amenity population covered a total genetic distance of 438·5 cM, with the smallest linkage group of 45·9 cM and the largest of 87·2 cM.
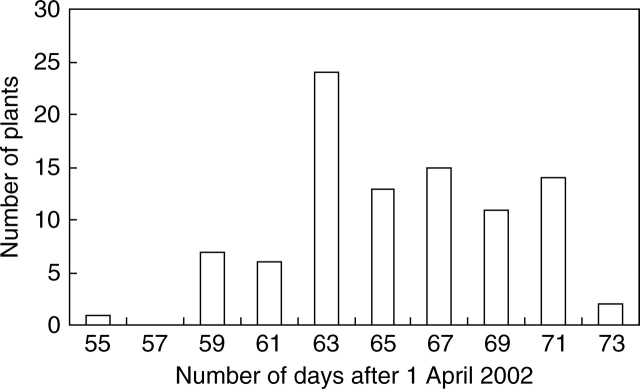
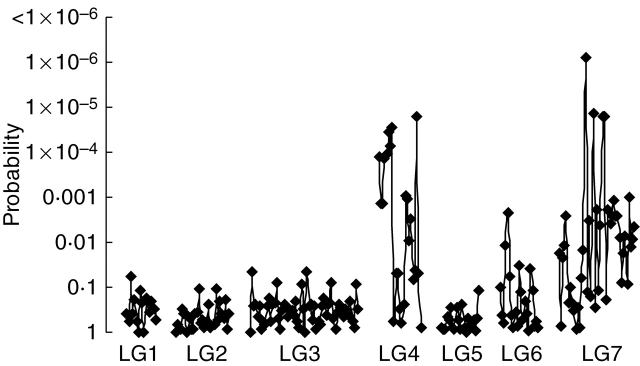
The genomic microsatellites generated were tested to confirm their potential for mapping genes which control target phenotypic traits. Heading date was the trait initially used for this work. Heading date in the forage population varied from a minimum of 55 d after 1 April to a maximum of 73·8 d after 1 April (mean = 64·85; n = 94). The plants of the forage backcross population were therefore screened for heading date (Fig. 3) and the results analysed with MapQTL 4·0 (van Ooijen et al., 2002). Association for heading date was shown by a number of markers from linkage group 4 and a strong association for heading date with nearly all the markers from linkage group 7 (Fig. 4).
Fig. 3.
Heading dates in 200 plants of forage backcross mapping population.
Fig. 4.
Significance of t-tests for marker/heading date association in the forage backcross mapping family for microsatellite markers across seven linkage groups (LG).
DISCUSSION
Genomic microsatellite markers, with only eight exceptions, formed the same linkage groups and same order in both the amenity and forage mapping populations. This demonstrates the reliability of the markers despite the relatively small number of genotypes from each population used to produce the genetic linkage groups. The relatively small size of the two populations probably explains some of the discrepancies found in the microsatellite markers between the two populations, e.g. the eight common markers placed in linkage groups in the forage population but left unlinked by JOINMAP in the amenity population.
The two sets of microsatellites used in this project, the genomic microsatellites produced at IGER and the GeneThresher microsatellites produced at Vialactia, complement each other. The genomic microsatellites have been shown to be highly polymorphic both in the two populations outlined in this paper and also in a set of L. perenne/F. pratensis introgression lines (data not shown). The banding patterns on the polyacrylamide gels and also data obtained from an ABI sequencer have often been very complex. Genomic microsatellites have generally been reported as being more polymorphic than EST microsatellites in crop plants because of less DNA sequence conservation in non-transcribed regions (Cho et al., 2000; Eujayl et al., 2001; Russell et al., 2004). The GeneThresher microsatellites were shown to produce strong bands and distinct allelic peaks. However, the level of polymorphism shown by the GeneThresher microsatellites was lower than those produced from the genomic library when tested on the forage and amenity populations (Table 4). The EST microsatellites were selected from those already shown to be polymorphic in the population used to produce a genetic linkage map of L. perenne (Gill et al., 2006) and therefore the figures shown in Table 3 may inflate the frequency of polymorphism of GeneThresher-derived microsatellites. The lower level of polymorphism shown by the GeneThresher-derived microsatellites was also found in Lolium/Festuca introgression lines. One hundred and sixty-one GeneThresher-derived microsatellite primer pairs were tried on the substitution lines, of which 36 % did not amplify a product in Festuca and 27 % were non-polymorphic between Lolium and Festuca. In comparison, of 58 genomic microsatellite primer pairs tried, 52 % did not amplify a band in Festuca but only 19 % were non-polymorphic between Lolium and Festuca.
Table 4.
Comparison of frequency of polymorphism of EST microsatellites and genomic microsatellites in the forage mapping population
| EST microsatellites | Genomic microsatellites | |
|---|---|---|
| Total number tested | 37 | 66 |
| No. of polymorphic in forage | 22 | 55 |
| % polymorphic in forage | 59·5 | 83 |
| No. of non-polymorphic in forage | 15 | 11 |
| % non-polymorphic in forage | 40·5 | 17 |
The estimated total map length of the forage grass genetic map was 433·8 cM. This is considerably shorter than most of the recent genetic maps published in L. perenne (all examples of which below are forage populations). For example, Vialactia published a distance of 675·6 cM for their framework map (Gill et al., 2006) made up of 376 SSR markers and nine RFLP markers. Armstead et al. (2002) reported 515 cM in an RFLP-based map and 565 cM in a backcross pedigree. Bert et al. (1999) reported a map distance of 930 cM (based on 463 AFLP markers), Jones et al. (2002) reported a map distance of 811 cM (based on 96 SSR loci) and Faville et al. (2004) reported map distances of 963 cM in one parent and 757 cM in the other (based on a combination of SSR and RFLP markers). Since the map reported here contains only genomic and a few EST microsatellite markers it would suggest that the microsatellites are not evenly distributed across the genome and indeed microsatellite loci isolated from genomic libraries have previously been shown to cluster on a number of genetic maps, e.g. barley (Ramsey et al., 2000). It is therefore possible that the inclusion of different types of markers, e.g. AFLP and RFLP, would give greater genome coverage.
QTL analysis revealed a major QTL for heading date on linkage group 7 in the forage population with a large number of the markers assigned to this group showing significant association to this QTL (Fig. 3). Analysis also revealed a second, considerably smaller QTL for heading date on linkage group 4. QTLs for heading date have been identified in Triticeae species associated with linkage groups 2, 4 and 7 (Laurie et al., 1995; Lundqvist et al., 1997; Börner et al., 2002). In L. perenne, Armstead et al. (2004) located a major QTL for heading date to linkage group 7 and have shown that candidate orthologues of rice Hd1 and barley HvCO1 also map to linkage group 7 (Armstead et al., 2005). Further smaller QTLs were also shown to be located on linkage groups 2, 4 and 7. QTL mapping with only 100 individuals is obviously of limited value. However, the main objective of this work was the construction of the microsatellite library and an initial assessment of its utility as regards its main objectives of marker-assisted selection within breeding programmes and gene isolation. The association of the microsatellite markers on linkage groups 4 and 7 with known QTLs for heading date provides further verification for the accuracy of the linkage map produced in this study and raises the confidence levels in the ability of the microsatellites to look for less well-understood QTL.
The genomic microsatellites described in this work, and the GeneThresher-derived microsatellites are presently being exploited for marker-assisted selection in breeding programmes. Key targets are the development of new varieties adapted to sustainable agricultural practices (e.g. low nitrogen input), climate change traits (e.g. heading date) and biorenewables (e.g. fermentability). In addition, the microsatellites are being exploited for the development of introgression maps of all seven Lolium/Festuca chromosomes. Introgression mapping is enabling the establishment of the syntenic relationship between the monocots and the determination of the genetic control of target traits (King et al., 2002a, b, 2007). These microsatellites in combination with introgression maps will form the basis for the development of a physical map of grass and thus provide a springboard for gene isolation via map-based cloning (Armstead et al., 2007).
ACKNOWLEDGEMENTS
J. King was funded by the Aberystwyth Challenge Fund, EMBO and BBSRC.
LITERATURE CITED
- Armstead IP, Turner LB, King IP, Cairns AJ, Humphreys MO. Comparison and integration of genetic maps generated from F2 and BC1-type mapping populations in perennial ryegrass. Plant Breeding. 2002;121:501–507. [Google Scholar]
- Armstead IP, Turner LB, Farrell M, Skøt L, Gomez P, Montoya T, et al. Synteny between a major heading-date QTL in perennial ryegrass (Lolium perenne L.) and the Hd3 heading-date locus in rice. Theoretical and Applied Genetics. 2004;108:822–828. doi: 10.1007/s00122-003-1495-6. [DOI] [PubMed] [Google Scholar]
- Armstead IP, Skøt L, Turner LB, Skøt K, Donnison IS, Humphreys MO, et al. Identification of perennial ryegrass (Lolium perenne (L.)) and meadow fescue (Festuca pratensis (Huds.)) candidate orthologous sequences to the rice Hd1 (Se1) and barley HvCO1 CONSTANS-like genes through comparative mapping and microsynteny. New Phytologist. 2005;167:239–247. doi: 10.1111/j.1469-8137.2005.01392.x. [DOI] [PubMed] [Google Scholar]
- Armstead IP, Donnison IS, Aubry S, Harper JA, Hörtensteiner S, James CL, et al. From crop to model to crop: identifying the genetic basis of the staygreen mutation in the Lolium/Festuca forage and amenity grasses. New Phytologist. 2006;172:592–597. doi: 10.1111/j.1469-8137.2006.01922.x. [DOI] [PubMed] [Google Scholar]
- Armstead IP, Donnison IS, Aubry S, Harper JA, Hörtensteiner S, James CL, et al. Cross-species identification of Mendel's I locus. Science. 2007;315:73. doi: 10.1126/science.1132912. [DOI] [PubMed] [Google Scholar]
- Bennett MD, Smith JB. Nuclear DNA amounts in angiosperms. Philosophical Transactions of the Royal Society of London. Series B. Biological Sciences. 1976;274:227–274. doi: 10.1098/rstb.1976.0044. [DOI] [PubMed] [Google Scholar]
- Bennett MD, Smith JB, Heslop-Harrison JC. Nuclear DNA amounts in angiosperms. Proceedings of the Royal Society of London. Series B. Biological Sciences; 1982. pp. 179–199. [DOI] [PubMed] [Google Scholar]
- Bert PF, Charmet G, Sourdille P, Hayward MD, Balfourier F. A high-density molecular map for ryegrass (Lolium perenne) using AFLP markers. Theoretical and Applied Genetics. 1999;99:445–452. doi: 10.1007/s001220051256. [DOI] [PubMed] [Google Scholar]
- Börner A, Buck-Sorlin GH, Hayes PM, Malyshev S, Korzun V. Molecular mapping of major genes and quantitative trait loci determining flowering time in response to photoperiod in barley. Plant Breeding. 2002;121:129–132. [Google Scholar]
- Cho YG, Ishii T, Temnykh S, Chen X, Lipovich L, McCouch SR, et al. Diversity of microsatellites derived from genomic libraries and GenBank sequences in rice (Oryza sativa L.) Theoretical and Applied Genetics. 2000;100:713–722. [Google Scholar]
- DEFRA. Agriculture in the UK. London: Department for Environment Food and Rural Affairs; 2002. [Google Scholar]
- Edwards KJ, Barker JHA, Daly A, Jones C, Karp A. Microsatellite libraries enriched for several microsatellite sequences in plants. BioTechniques. 1996;20:758–760. doi: 10.2144/96205bm04. [DOI] [PubMed] [Google Scholar]
- Eujayl I, Sorrells M, Baum M, Wolters P, Powell W. Assessment of genotypic variation among cultivated durum wheat based on EST-SSRs and genomic SSRs. Euphytica. 2001;119:39–43. [Google Scholar]
- Faville MJ, Vecchies AC, Schreiber M, Drayton MC, Hughes LJ, Jones ES, et al. Functionally associated molecular genetic marker map construction in perennial ryegrass (Lolium perenne L.) Theoretical and Applied Genetics. 2004;110:12–32. doi: 10.1007/s00122-004-1785-7. [DOI] [PubMed] [Google Scholar]
- Gill GP, Wilcox PL, Whittaker DJ, Winz RA, Bickerstaff P, Echt CE, et al. A framework linkage map of perennial ryegrass based on SSR markers. Genome. 2006;49:354–364. doi: 10.1139/g05-120. [DOI] [PubMed] [Google Scholar]
- Jensen LB, Muylle H, Arens P, Andersen CH, Holm PB, Ghesquiere M, et al. Development and mapping of a public reference set of SSR markers in Lolium perenne L. Molecular Ecology Notes. 2005;5:951–957. [Google Scholar]
- Jones ES, Dupal MP, Kölliker R, Drayton MC, Forster JW. Development and characterisation of simple sequence repeat (SSR) markers for perennial ryegrass (Lolium perenne L.) Theoretical and Applied Genetics. 2001;102:405–415. [Google Scholar]
- Jones ES, Dupal MP, Dumsday JL, Hughes LJ, Forster JW. An SSR-based genetic linkage map for perennial ryegrass (Lolium perenne L.) Theoretical and Applied Genetics. 2002;105:577–584. doi: 10.1007/s00122-002-0907-3. [DOI] [PubMed] [Google Scholar]
- King J, Armstead IP, Donnison IS, Thomas HM, Jones RN, Kearsey MJ, et al. Physical and genetic mapping in the grasses Lolium perenne and Festuca pratensis. Genetics. 2002;a 161:307–314. doi: 10.1093/genetics/161.1.315. [DOI] [PMC free article] [PubMed] [Google Scholar]
- King J, Roberts LA, Kearsey MJ, Thomas HM, Jones RN, Huang L, et al. A demonstration of a 1 : 1 correspondence between chiasma frequency and recombination using a Lolium perenne/Festuca pratensis substitution line. Genetics. 2002;b 161:315–324. doi: 10.1093/genetics/161.1.307. [DOI] [PMC free article] [PubMed] [Google Scholar]
- King J, Armstead IP, Donnison IS, Harper JA, Roberts LA, Thomas H, et al. Introgression mapping in the grasses. Chromosome Research. 2007;15:105–113. doi: 10.1007/s10577-006-1103-0. [DOI] [PubMed] [Google Scholar]
- King J, Armstead IP, Donnison SI, Roberts LA, Harper JA, Skøt K, et al. Comparative analyses between Lolium/Festuca introgression lines and rice reveal the major fraction of functionally annotated gene models are located in recombination poor/very poor regions of the genome. Genetics. 2008;177:597–606. doi: 10.1534/genetics.107.075515. [DOI] [PMC free article] [PubMed] [Google Scholar]
- Kosambi DD. The estimation of map distance from recombination values. Annals of Eugenics. 1944;12:172–175. [Google Scholar]
- Kubik C, Meye WA, Gaut BS. Assessing the abundance and polymorphism of simple sequence repeats in perennial ryegrass. Crop Science. 1999;39:1136–1141. [Google Scholar]
- Kubik C, Sawkins M, Meyer WA, Gaut BS. Genetic diversity in seven perennial ryegrass (Lolium perenne L.) cultivars based on SSR markers. Crop Science. 2001;41:1565–1572. [Google Scholar]
- Laurie DA, Pratchett N, Bezant JH, Snape JW. RFLP mapping of five major genes and eight quantitative trait loci controlling flowering time in a winter × spring barley (Hordeum vulgare L.) cross. Genome. 1995;38:575–585. doi: 10.1139/g95-074. [DOI] [PubMed] [Google Scholar]
- Lauvergeat V, Barre P, Bonnet M, Ghesquière M. Sixty simple sequence repeat markers for use in the Festuca-Lolium complex of grasses. Molecular Ecology Notes. 2005;5:401–405. [Google Scholar]
- Lundqvist U, Franckowiak JD, Konishi T. New and revised descriptions of barley genes. Barley Genetics Newsletter. 1997;26:22–516. [Google Scholar]
- van Ooijen JW, Boer MP, Jansen RC, Maliepaard C. Wageningen, The Netherlands: Plant Research International; 2002. Map QTL 4·0: software for the calculation of QTL positions on genetic maps. [Google Scholar]
- Ramsay L, Macaulay M, degli Ivanissevich S, MacLean K, Cardle L, Fuller J, et al. A simple sequence repeat-based linkage map of barley. Genetics. 2000;156:1997–2005. doi: 10.1093/genetics/156.4.1997. [DOI] [PMC free article] [PubMed] [Google Scholar]
- Russell J, Booth A, Fuller J, Harrower B, Hedley P, Machray G, et al. A comparison of sequence-based polymorphism and haplotype content in transcribed and anonymous regions of the barley genome. Genome. 2004;47:389–398. doi: 10.1139/g03-125. [DOI] [PubMed] [Google Scholar]
- Stam P. Construction of integrated genetic linkage maps by means of a new computer package: JOINMAP. The Plant Journal. 1993;3:739–744. [Google Scholar]
- Stam P, van Ooijen JW. Wageningen, The Netherlands: CPRO-DLO; 1995. JOINMAP version 2·0. Software for the calculation of genetic linkage maps. [Google Scholar]
- Studer B, Widmer F, Enkerli J, Kölliker R. Development of novel microsatellite markers for the grassland species Lolium multiflorum. Lolium perenne and Festuca pratensis. 2006;6:1108–1110. Molecular Ecology Notes. [Google Scholar]
- Turner LB, Cairns AJ, Armstead IP, Ashton J, Skøt K, Whittaker D, et al. Dissecting the regulation of fructan metabolism in perennial ryegrass (Lolium perenne) with quantitative trait locus mapping. New Phytologist. 2006;169:45–57. doi: 10.1111/j.1469-8137.2005.01575.x. [DOI] [PubMed] [Google Scholar]
- Varshney RK, Graner A, Sorrells ME. Genic microsatellite markers in plants: features and applications. Trends in Biotechnology. 2005;23:48–55. doi: 10.1016/j.tibtech.2004.11.005. [DOI] [PubMed] [Google Scholar]
- Warnke SE, Barker RE, Jung G, Sim S-C, Mian MAR, Saha MC, et al. Genetic linkage mapping of an annual × perennial ryegrass population. Theoretical and Applied Genetics. 2004;109:294–304. doi: 10.1007/s00122-004-1647-3. [DOI] [PubMed] [Google Scholar]


