Abstract
This protocol describes the preparation of frozen-hydrated single-particle specimens of macromolecular complexes. First, it describes how to create a grid surface coated with holey carbon by first inducing holes in a Formvar film to act as a template for the holey carbon that is stable under cryo-electron microscopy (cryo-EM) conditions and is sample-friendly. The protocol then describes the steps required to deposit the homogeneous sample on the grid and to plunge-freeze the grid into liquid ethane at the temperature of liquid nitrogen, so that it is suitable for cryo-EM visualization. It takes 4–5 h to make several hundred holey carbon grids and about 1 h to make the frozen-hydrated grids. The time required for sample purification varies from hours to days, depending on the sample and the specific procedure required. A companion protocol details how to collect cryo-EM data using an FEI Tecnai transmission electron microscope that can subsequently be processed to obtain a three-dimensional reconstruction of the macromolecular complex.
INTRODUCTION
There has been a recent surge in the popularity of cryo-EM and its use in structural biology. In view of the need for purifying and maintaining large amounts of intact complexes in X-ray crystallography, cryo-EM offers a distinct advantage as it requires significantly less material (10 µg ml−1 versus 10 mg ml−1) (see ref. 1) for crystallization. Additionally, certain biological complexes, or specific conformations of the complex, do not lend themselves to crystallization, but can be captured in their free single-particle form by rapid freezing in liquid ethane for visualization using cryo-EM2. There are a few constraints, however, on which molecules can be successfully reconstructed using cryo-EM3. One constraint is related to the size of the molecule of interest. Because the technique depends on the ability to align and classify projections of the macromolecular complex with sufficient accuracy, application of the technique has been limited to relatively large complexes. Currently, macromolecules in the size range of approximately 100–1,000 Å are routinely imaged using single-particle reconstruction methods. One limitation of single-particle cryo-EM is that the resolution achieved is not as high as that from X-ray crystallography or NMR spectroscopy, although by now subnanometer resolution has been achieved for several structures with low or no symmetry4–7. In most situations, the most effective approach for structural interpretation is a combination of techniques, such as docking atomic structures of individual components as rigid bodies into the cryo-EM density. In this way, a quasiatomic model is generated, which reveals information with resolutions of approximately four to five times better than cryo-EM alone8.
The cryo-EM specimen is prepared in near-native buffer conditions, and, once the frozen-hydrated grid is prepared, it is placed in the microscope and kept at approximately −180 K throughout the experiment. Our protocol describes the way a buffer containing a homogeneous population of molecules is deposited onto a specially treated EM grid and the subsequent steps needed to prepare and maintain EM grids for visualization in the transmission electron microscope.
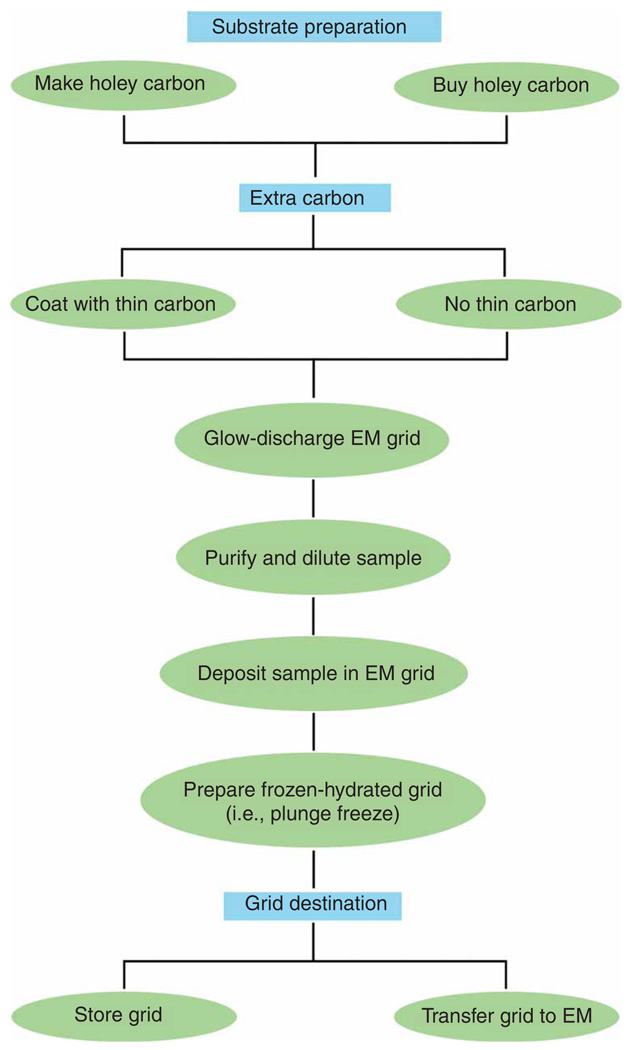
This protocol describes specimen grid preparation, while the companion protocol describes data collection strategies using cryo-EM9. The protocol is in standard use in this laboratory. It has been used previously, for instance, to investigate the interaction between release factor RF3 and ribosome during the termination process10, the way the hepatitis C virus internal ribosome entry site takes over the host’s protein synthesis machinery2 and the structure of GroEL11. An outline of the necessary steps is given in Figure 1.
Figure 1.
Schematic representation of grid preparation steps.
MATERIALS
REAGENTS
45 ml acetone
45 ml chloroform
Ethanol
0.2 g Formvar (polyvinyl formal powder)
1.5 ml of 90% (vol/vol) glycerin in water
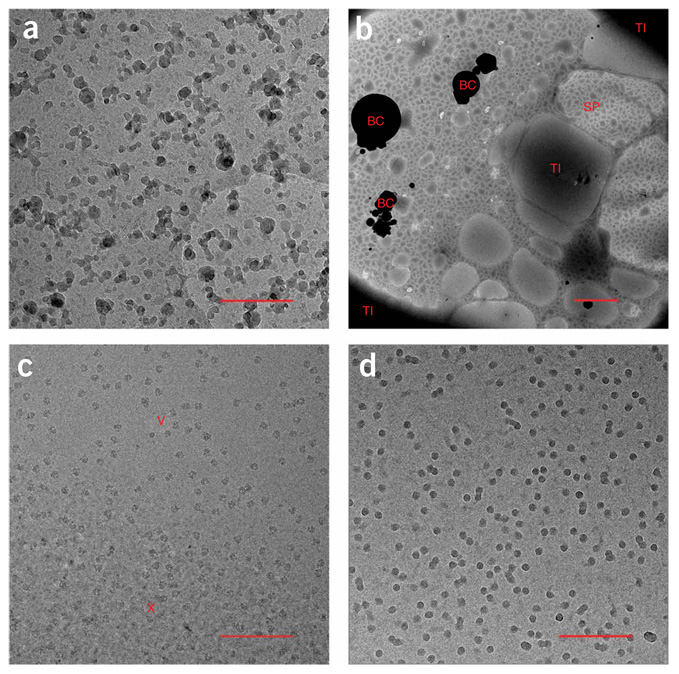
99.9990% purity ethane (for plunge-freezing; impurities can lead to high-contrast contaminants on the grid as seen in Figure 2a)
 Avoid sparks and ensure adequate ventilation
Liquid nitrogen (for plunge-freezing)
 Ensure adequate ventilation to avoid asphyxiation and use proper protective clothing, such as gloves and glasses
Figure 2.
Sample cryo-EM images. (a) Ethane contamination. The high-contrast blobs are contaminants that are sometimes in the ethane used to plunge-freeze the grids. The scale bar represents 250 nm on the object scale. (b) Low-magnification cryo-EM image of a bad grid. The image shows various problems that can occur when making frozen-hydrated grids. BC indicates large ice contaminants that are usually the result of poor handling. SP indicates the ‘splotchy’ ice appearance that occurs when the substrate is not hydrophilic. TI indicates thick ice. The scale bar is 2 µm on the object scale. (c) Vitreous and crystalline ice. Cryo-electron micrograph showing the appearance of vitreous ice (V) and crystalline ice (X). The scale bar represents 250 nm on the object scale. (d) Freeze-dried particles. Cryo-electron micrograph showing the high-contrast appearance of particles that have been freeze-dried. The scale bar represents 250 nm on the object scale.
EQUIPMENT
500 300-mesh EM grids (copper or molybdenum)
Light microscope slides
3 mm pre-sharpened carbon rods
Dumont no. 5 nonmagnetic tweezers
Mica sheets
Sharpened carbon rods
Petri dishes (glass and plastic)
Whatman no. 1 (55 mm) and no. 40 filter paper
Two 1–2 ml black caps (for floating thin carbon)
Sonic probe
Carbon evaporator
Phase-contrast light microscope (LM)
Harrick PDC-32G plasma cleaning device (http://www.harrickplasma.com/products_cleaners.php)
Taylor Wharton XT 20 cryo-storage dewar with cryo-sentry (grid manipulation)
Cryo-grid storage boxes (grid manipulation)
350 ml cryo-dewars (grid manipulation)
10-inch tweezers (grid manipulation)
Sharpened stainless-steel tweezers (grid manipulation)
Various tools, such as Dumont no. 5 tweezers, large tweezers, screwdriver (plunge-freezing)
 Use gloves when handling precooled tools to avoid frostbite
2–350 ml cryo-dewars (plunge-freezing)
1–10 µl pipetting device with tips (plunge-freezing)
Treated holey carbon EM grids (plunge-freezing)
Whatman no. 1 (55 mm) and no. 40 filter paper (plunge-freezing)
REAGENT SETUP
Sample solution
Refer to Step 10 for details on preparing the sample solution for cryo-EM.
EQUIPMENT SETUP
Plunge-freezer
Refer to Step 13 for details on how to set up this apparatus.
PROCEDURE
Select source of holey carbon substrate
-
For cryo-EM, the biological sample is first deposited on copper or molybdenum grids that are covered with a layer of holey carbon film. Molybdenum grids are used when sample flatness is a critical requirement because molybdenum minimizes the effects of crinkling due to thermal contraction. Holey carbon provides additional support and stability to the specimen grid. A good holey carbon film will have many holes of approximately 1–5 µm in diameter and can be made in the laboratory with minimal resources. To prepare your own holey carbon grids, either follow the steps in option A or refer to Box 1. Alternatively, commercially available holey grids can be purchased with a set pattern of hole distribution and size (option B). The periodic spacing of holes in commercially available grids makes them better suited for automated data collection. The disadvantages of using commercially available grids are a substantially higher cost as well as a compromise in the level of quality control. For more information regarding the preparation of holey carbon for support, see ref. 12.
-
Making grids coated with holey carbon
 ~4 h
~4 h-
Prepare 2% (wt/vol) Formvar solution. To produce many holes of appropriate size, a suspension of glycerol/water droplets is made in Formvar (plastic) solution. These suspended drops will create the holes in (what will later be) the carbon surface.
It is therefore important to have a high-enough concentration of hole-producing droplets of appropriate size in the solution. In a fume hood, dissolve 0.2 g of Formvar in 45 ml of chloroform in a Wheaton bottle and shake until the powder is dissolved.
Add 45 ml of acetone and 1.5 ml of 90% (vol/vol) glycerin in water and shake vigorously for 10 min.
Sonicate the mixture with a sonic probe for 5 min. Droplets of glycerin that form holes will coalesce to the correct size after 30 min.
Clean the slides to prepare them for coating. Light microscope slides are coated to produce a holey plastic (Formvar) film. These microscope slides should be first cleaned so that films will strip off easily and the holes will form evenly. Wash with detergent and water, rinsing thoroughly.
Soak the slides in 95% ethanol for a few minutes.
Wipe the slide dry with a lint-free cloth along the long axis of the slide to align subsequent holes.
Coat the slides with a holey film. Lower 2–3 cm of a slide into a 50 ml beaker of the 2% holey Formvar solution and hold it there for 5 s.
Slowly withdraw the slide at a 45° angle to the surface of the solution. The side that forms an acute angle to the surface should be used for the next step.
Wait for the film to dry (~1 min).
Gently dip the coated slide into a beaker of acetone and leave the end immersed for about 5 s with gentle agitation.
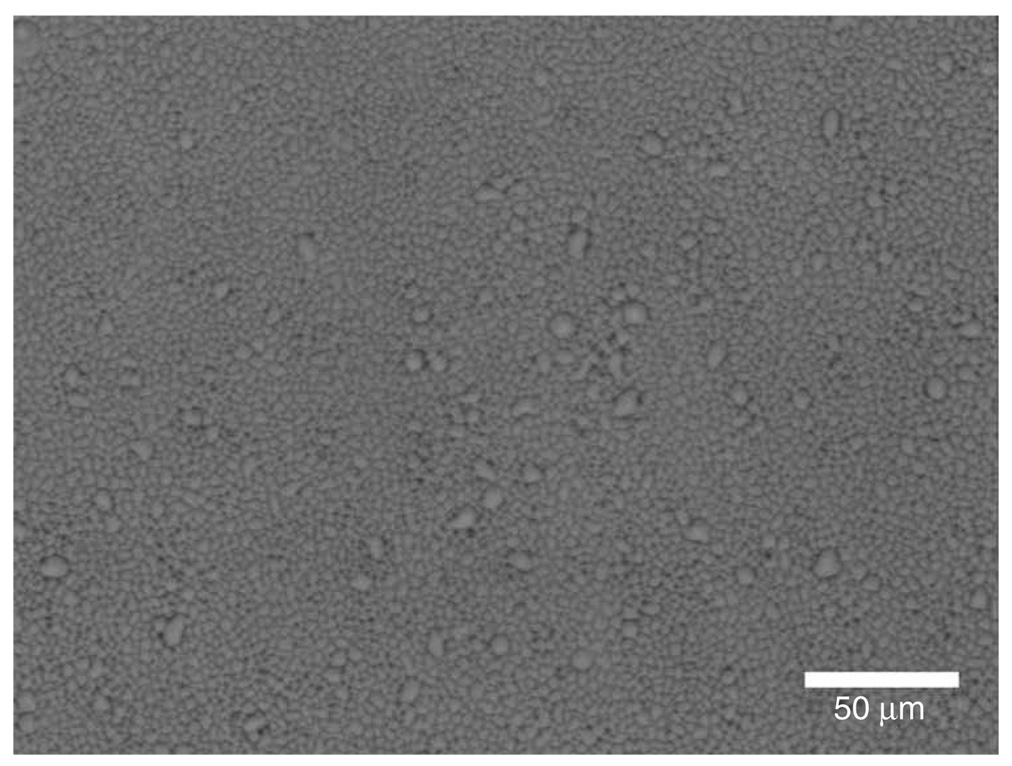
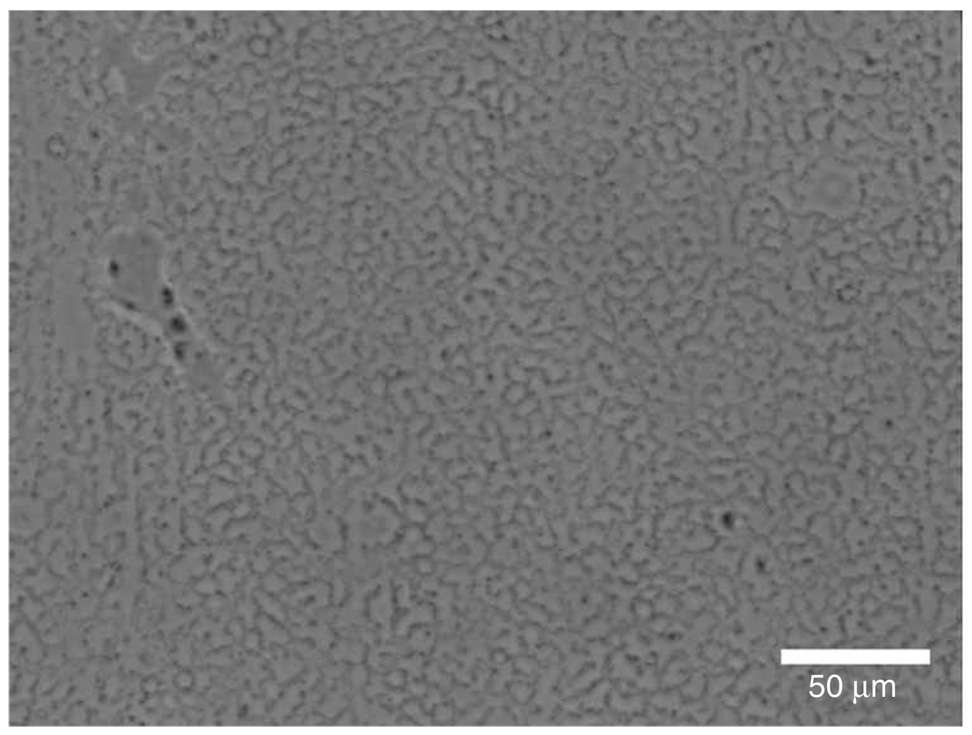
Observe the slide with a phase-contrast LM. There may be a fair amount of smoothly round and sometimes clustered holes that will result in a net of holey Formvar. The smooth holes will appear to have greater contrast than the network (see Fig. 3). If the network appears to be faint, the holes are not yet perforated and the slide should be dipped again in acetone (see Fig. 4).
Observe each slide and keep the best ones. The final grids will have smooth, round holes despite their irregular appearance at this point.
Prepare the holey EM grids. Score the edges of the coated slide with a single-edged razor. Make sure to use the side of the slide that formed an acute angle to the solution as described above.
Strip the holey Formvar film from the slide onto the surface of a bowl of distilled water.
Place 300-mesh grids onto the film.
Pick up the entire grid-covered film with parafilm and allow them to dry (1 h).
Coat the grids with a 10-nm-thick layer of carbon (as determined by dark gray color) using a vacuum evaporator, while they are still on the parafilm.
Remove the grids from the parafilm and place them with the film-side upward in a glass Petri dish on 4–5 sheets of filter paper saturated with chloroform or amyl acetate.
Leave the grids overnight in the solvent-saturated environment to remove any residual Formvar.
-
-
Commercially available pre-made grids coated with holey carbon
Choose an appropriate type of pre-made grid. The grids that are generally used in this laboratory are Quantifoil (http://www.quantifoil.com/) or C-flat (http://www.protochips.com/c_flat.html) grids that are manufactured with a regular pattern of holes on an EM grid. When using pre-made holey grids, select the type of grid that is appropriate for your application. Three-hundred-mesh copper grids, with 2-µm-diameter holes, are routinely used for single-particle applications.
Before use, the Quantifoil grids may need to be cleaned with an organic solvent to remove residual plastic and other contaminants. Put 4–5 layers of filter paper in a glass Pertri dish.
Soak the paper with chloroform using a glass Pasteur pipette to wet the paper.
Place the grids—holey carbon side upward—on the saturated filter paper.
Cover the Petri dish and leave the grids in a fume hood overnight.
Follow additional washing steps if needed. It may be necessary to repeat this step with deionized water to remove water-soluble contaminants.
-
-
Decide if thin carbon will be used (option A). Samples are either applied directly to the holey carbon, in which case they fill the holes as a suspension, or placed on a thin carbon layer that covers the holey carbon. The thin carbon has some advantages, such as decreased charging and increased stability when exposed to the electron beam. Also, the defocus value of images is easier to measure from the strong signal of thin carbon. The disadvantage of using a thin-carbon backing is that it adds background noise to the image, which will decrease the signal-to-noise ratio. Refer to option B for experiments not using thin carbon.
-
Making and transferring the thin carbon>
Start with a 4 cm × 2 cm piece of mica. Cleave the mica to expose a fresh surface.
Place the freshly exposed side of mica face-up on a piece of filter paper in a Petri dish.
Tape the mica to the filter paper at the very edge of the mica so that it is not disturbed when the bell jar of the evaporator is vented.
-
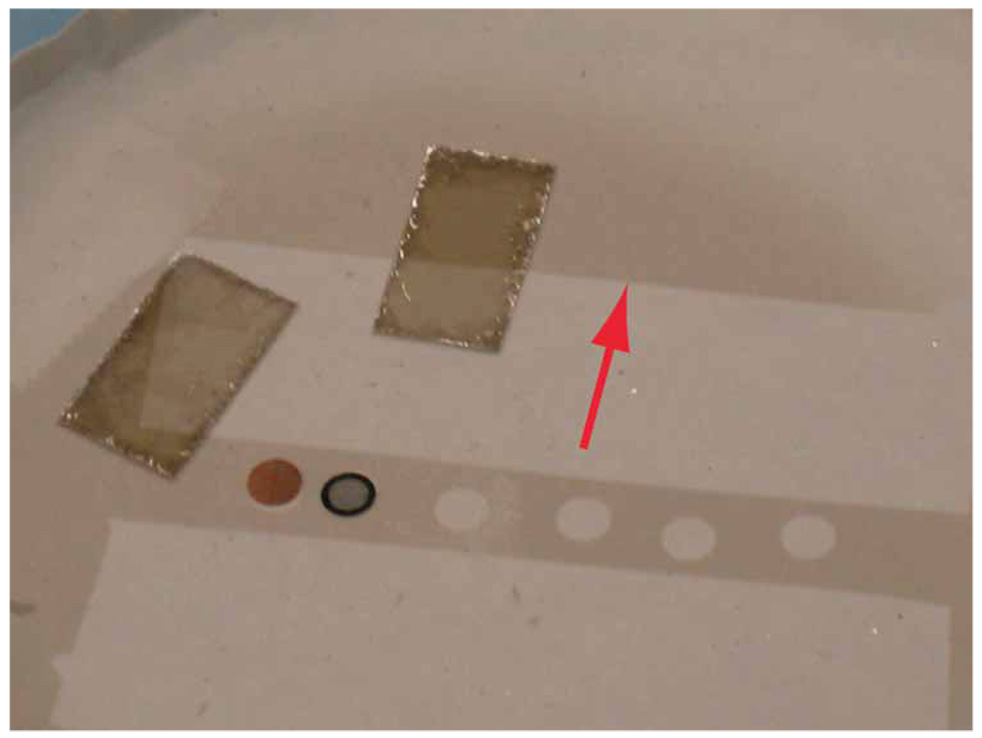
Coat the mica with a thin layer (~5 nm) of carbon using a carbon evaporator (see Fig. 5).
 The thickness of the carbon film is determined by the resulting color, or by using a film-thickness monitor. The holey grids can be carbon coated simultaneously with the mica, or alone if thin carbon (from the mica) is not necessary.
 -
Cut a piece of coated mica slightly larger than the size of the grid (5 mm) and float the carbon off the mica onto the surface of filtered, de-ionized water.
 The floating carbon can be visualized by using a high-intensity light placed at a glancing angle to the surface of water.
 Pick up the carbon using the holey grid, making sure that the side of the grid that has the holey carbon is the side that is in contact with the thin carbon.
Repeat Steps 15 and 16 until a sufficient number of grids are prepared.
The carbon-coated grids are useable for up to 1 week, if left in a desiccator.
-
Using holey grids without thin carbon
Refer to Box 2 for advice on applying your sample onto a grid without thin carbon over the holey carbon.
Glow-discharge the grids
-
It is advisable to glow-discharge the grids to ensure that the sample coats the grid smoothly and evenly12,13. Example images showing good (Fig. 6) and bad spreading (Fig. 2b) are provided (see also Table 1). Glow-discharging/plasma-cleaning removes any residual hydrocarbons, thereby making the grids hydrophilic. Alternatively, a hydrophobic surface can be generated by glow-discharging in the presence of an amyl amine solution. For glow-discharging, bring the holey grids with or without the thin carbon (depending on the protocol being used) and place them on a filter paper in a small Petri dish.
Place the grids into the bell jar of the glow-discharge apparatus.
Seal the bell jar.
Evacuate the bell jar for approximately 1 min.
-
Glow-discharge for 25 s at approximately 20 W.
 Look for the light purple glow in the bell jar.
 Slowly vent the bell jar.
-
Remove the Petri dish with the grids. They are now ready to have the sample applied on them.
 Grids should be used within 1 h of glow-discharging, or they should be retreated.
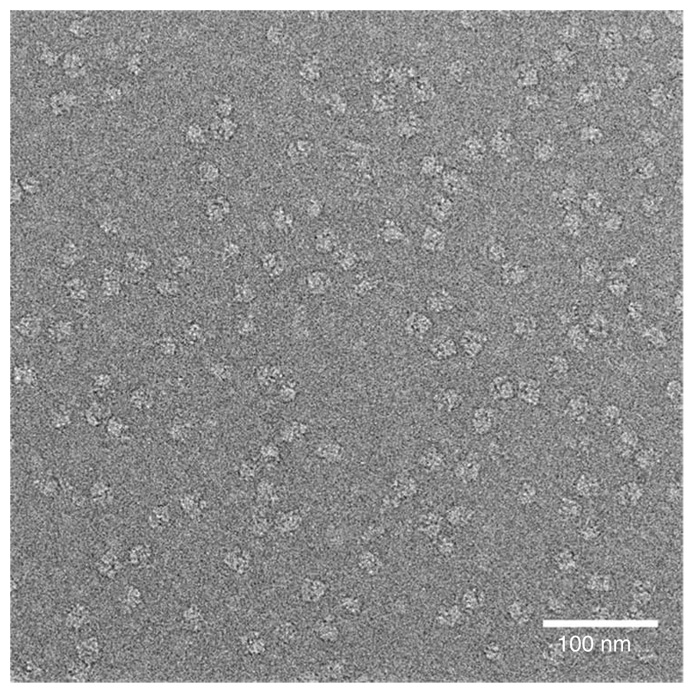
 Prepare your sample as described in Box 3. An example of a well-prepared sample is shown in Figure 6.
-
Select the desired EM-grid preparation technique. The choices of grid preparation are frozen-hydrated, negatively stained or a more recently developed combination of the two, cryo-negative stain. Frozen-hydrated preparation, discussed in this protocol, allows the visualization of the actual density distribution within the assembly to be studied, but with low contrast. In contrast, negative staining casts the molecule in a shell of electron-dense material that produces much higher contrast than with frozen-hydrated preparation when viewed in the electron microscope14,15. A good reference for negative staining protocols is presented in ref. 16.
A hybrid approach of these two techniques is cryo-negative staining17, where the molecule is diluted in a stain solution, blotted and plunge-frozen like a standard frozen-hydrated grid.
Note that this protocol describes frozen-hydrated grid preparation of single-particle samples.
-
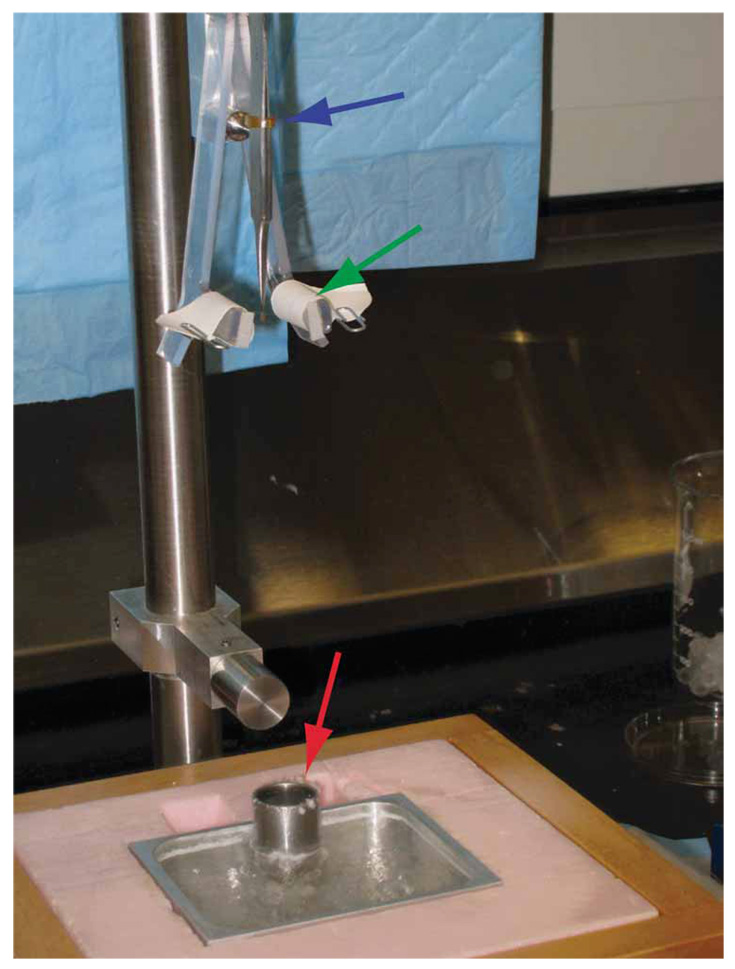
Set up a freeze-plunger. Note that the following steps describe the method for using the freeze-plunger described in Box 4 and shown in Figure 7. An example of a sample in nonvitreous ice can be seen in Figure 2c.
Freezing grids with manual plunger
 ~1h
~1h Use the apparatus described in Box 4 in a cold room to increase the relative humidity and decrease the temperature. The conditions used in our laboratory are ~90% relative humidity and ~6 °C.
Fill the cryogen vessel with liquid nitrogen to cool down the apparatus and wait for the rapid boiling of the nitrogen to subside.
-
Slowly condense ethane in the cold cryogen cup until it is filled with liquid ethane.
 The ethane should be maintained in a state where it is cloudy, but not frozen. It may be necessary to thaw the ethane in the cup with a slow stream of fresh ethane gas.
 Place the grid box (for storing the frozen grids) into the liquid nitrogen pool.
Precool a set of large tweezers and a screwdriver in a separate 350 ml dewar half-filled with liquid nitrogen.
Pick up a freshly glow-discharged, carbon-coated holey grid with the tweezers and mount it on the plunging apparatus.
Pipette 4–5 µl of sample onto the mounted grid. Make sure it is applied to the side with the carbon.
-
Wait for a defined amount of time (30 s) so that the particles can adhere to the carbon (if used).
 This waiting time affects the particle distribution and can be varied or eliminated, depending on the properties of the particles.
 If plunging is done at higher temperatures or low humidity, there can be substantial evaporation resulting in cooling and also an increase in salt concentrations. This effect can be damaging to sensitive samples, and, in such cases, this step should be skipped.
 -
Blot the grid between the two pieces of Whatman no. 1 filter paper for approximately 2 s and release the plunger with the foot switch.
 Blotting times will vary, but the goal is to get the ice as thin as possible while still maintaining adequate sample concentration.
 -
Dismount the tweezers and lift the shaft of the plunger away from the cryogen, being certain not to remove the grid from the cryogen, which could freeze-dry or devitrify the sample.
 Example images showing freeze-dried (Fig. 2d) and nonvitreous (Fig. 2c) samples are provided (see also Table 1).
 Place the grid into the precooled grid box and repeat the process if necessary.
When all the grids have been made, remove the grid box from the pool and either store it or bring it in an appropriate container to the microscope.
-
Precool all the equipment required in the handling, storage and transfer of the frozen-hydrated grids. After preparation, cryo-grids must be kept below the devitrification temperature of −137 °C (see ref. 18). Therefore, any tool that will be in contact with the grids or the grid boxes must be precooled by submerging it first in liquid nitrogen.
 Whenever handling these precooled tools, protective gloves should be worn to avoid frostbite. Additionally, tools should be warmed to room temperature (20–30 °C) and dried before re-use, to minimize condensed-ice contamination being introduced into the grid environment (see Table 1 and Fig. 2b (BC)). The individually labeled grid boxes are stored in a dewar, under liquid nitrogen. Even at this temperature, freeze-drying can occur, so it is advisable to use the grids within a year from the date they are made.
 Place the frozen-hydrated grids in a precooled grid box either made in-house or purchased commercially.
Transfer the grid box into a small 350 ml dewar filled with liquid nitrogen.
Bring the grid box to the microscope for viewing as described in ref. 9 or place it in the cryo-storage dewar.
OTHER PROTOCOLS TO MAKE HOLEY CARBON
There are other protocols for making holey carbon grids that use condensation onto a cold glass surface to produce holes in the Formvar layer. Yet another technique uses a preformed nucleopore filter as the holey substrate (http://cimbio.scripps.edu/misc/ documentation).
Figure 3.
Good holey Formvar. Image from phase-contrast LM showing the appearance of a good network of holes in a Formvar-coating on a glass slide.
Figure 4.
Pseudo-holey Formvar. Image from a phase-contrast LM showing the appearance when the Formvar coating is not fully perforated.
Figure 5.
Carbon-coated mica. A thin layer (approximately 50 Å) of carbon is deposited onto freshly cleaved mica using a vacuum evaporator. The thickness of the carbon can be estimated by monitoring the gray level on the filter paper (see red arrow). Also note the voids left by the holey carbon grids in the center of the image that were recoated along with the mica.
NO THIN CARBON
Sample can also be applied directly onto the holey carbon.
 Sample concentration should be increased fivefold to get the same particle-dispersal on the grid, assuming that initial prescreening was performed using negative staining technique.
Figure 6.
Micrograph of ribosomes in vitreous ice. The micrograph shows an even particle distribution of ribosomes on a frozen-hydrated grid. Note: Contrast has been inverted for subsequent image processing.
TABLE 1.
Troubleshooting table.
| Problem | Cause | Solution | Example image |
|---|---|---|---|
| Beam not visible | Insufficient blotting, ice much too thick | Increase blotting time or number of blots or change the blotting paper | Figure 2b (TI) |
| Poor contrast | Insufficient blotting, ice too thick | Increase blotting time or number of blots or change the blotting paper | |
| Dense background from Buffer | Verify if the levels of sucrose, glycerol, etc. are below 5% | ||
| Build-up of contamination in the column | Verify if anticontaminator is operational, desiccate or remove the film loaded into scope | ||
| Uneven or splotchy ice | Hydrophobic grid surface | Pre-clean grids; use fresh carbon and glow-discharged grids before applying the sample | Figure 2b (SP) |
| Excess contamination | Poor transfer or handling | Shorten the time the sample and cold tools are exposed to a wet environment | Figure 2b (BC) |
| Ethane impurities | Use high-grade ethane; do not shake the ethane tank; when tank is close to becoming empty, change the tank | Figure 2a | |
| Crystalline ice | Improper plunging | Verify that the grid is plunging deep and fast enough into the cryogen | Figure 2c (X), (V) |
| Devitrification due to handling with warm tools | Precool tools and verify all contact surfaces are below −140 °C | ||
| Poor thermal contact of grid with holder | Clean the sample boat or verify that the clip ring is tight | ||
| Freeze-dried sample | Severe heating, excess blotting (rare) | Verify that all contact surfaces are below −140 °C | Figure 2d |
| Degraded sample | Hostile substrate surface Properties | Use another batch of grids, clean grids and glow-discharge grids | |
| Elevated salt concentration due to on-grid evaporation | Use two-side blot; blot in a high-humidity environment |
SAMPLE PREPARATION
Because of the relatively large size of the macromolecules visualized using cryo-EM, purification techniques commonly employ velocity sedimentation in sucrose or glycerol. It is a critical requirement to first remove such cryo-protectants from the sample before freezing. This is because, at high concentrations, cryo-protectants will interfere with the freezing process and, even at lower concentrations, will contribute to the background noise, decreasing the contrast between signal from the complex and the background. The lower signal-to-noise ratio makes particle identification and alignment more difficult. In general, the amount of cryo-protectant should be as low as possible and never more than 5% (wt/vol).
Cryo-EM requires little material. One cryo-EM grid is made from 4 to 5 µl of sample at a concentration of only 30 nM for ribosomes (~70 µg ml−1 for 70S ribosome), using a thin carbon layer, and will easily contain enough single particles for an entire data set.
Note: If the thin-layer carbon film (see above) is omitted, then the concentration of the sample needs to be increased by roughly fivefold, to get an equivalent distribution of the particles. Some initial screening of sample concentration has to be performed to optimize data collection. Finally, some preliminary work may be desired to prevent the individual particles from clumping or aggregating. An ideal sample should cover the entire grid, with particles close to, but not touching, one another (Fig. 6).
 Because cryo-EM reconstructions are obtained by combining thousands of individual projections, it is extremely important to obtain a homogenous sample. Heterogeneity can arise from several factors, such as partial occupancy of a ligand whose binding is associated with conformational changes in the target macromolecule. Therefore, it is advantageous to first screen the biochemical conditions such as ligand stoichiometry, incubation times and temperatures, buffer conditions (i.e., pH, salt concentration) and component concentrations that yield the most homogenous sample. Cleavage-defective ligands, nonhydrolyzable ATP/GTP analogs or antibiotics are commonly used to ‘lock’ complexes, all in the same state. Additionally, there are computational methods for addressing heterogeneity after the data are collected19–21; however, the more pure and homogenous the starting sample, the more straightforward the data processing.
THE FREEZE-PLUNGER
For routine preparation of a frozen-hydrated sample, a specially designed plunging apparatus is generally employed22. These plungers must allow for
holding of an EM grid on its edge so that the sample can be applied (tweezers)
removal of excess sample from the grid to create a grid that is electron transparent (blotting)
extremely rapid vitrification (plunging into a cup containing a cryogen such as liquid ethane or propane).
The frozen-hydrated sample should be transferred from the tweezers into a storage container while keeping the temperature below the devitrification temperature of −137 °C (see ref. 18) (transfer vessel) (an example of a sample in nonvitreous ice can be seen in Figure 2c). To increase reproducibility of grids, a special plunging apparatus was designed22. It blots from both sides and maintains the grid between two pieces of filter paper before rapid plunging in liquid ethane (Fig. 7). Other plungers that can be used and the protocols to use them are the Vitrobot (http://www.fei.com/) (see ref. 23), the Gatan cryoplunge (http://www.gatan.com/) and a time-resolved plunge-freezing apparatus. The time-resolved unit, which is made to order, is useful when attempting to resolve reactions that occur in the 10-ms timescale24.
Figure 7.
Manual plunge-freezing apparatus. The sample is applied to the grid held in place by the forceps (blue arrow). The sample layer is blotted between the filter pads (green arrow) and quickly plunged into the cryogen cup (red arrow).
![]()
Troubleshooting advice can be found in Table 1.
ANTICIPATED RESULTS
Grids prepared by this procedure should have thin and even ice covering approximately 75% of the grid. Particle distribution should be even, with little overlap and maximum particle count per image acquired (see Fig. 6). Visualization of these grids should produce images of sufficient quality to achieve three-dimensional reconstructions with resolutions in the 1–2 nm range, assuming high sample homogeneity, when processed with single-particle techniques6.
ACKNOWLEDGMENTS
We acknowledge support from HHMI, NIH R37 GM29169, R01 GM55440 and P41 RR01219. We also thank M. Watters for assistance in the preparation of the illustrations.
Footnotes
Reprints and permissions information is available online at http://npg.nature.com/ reprintsandpermissions
References
- 1.Sjoberg A, Onnerfjord P, Morgelin M, Heinegard D, Blom AM. The extracellular matrix and inflammation: fibromodulin activates the classical pathway of complement by directly binding C1q. J. Biol. Chem. 2005;280:32301–32308. doi: 10.1074/jbc.M504828200. [DOI] [PubMed] [Google Scholar]
- 2.Spahn CM, et al. Hepatitis C virus IRES RNA-induced changes in the conformation of the 40s ribosomal subunit. Science. 2001;291:1959–1962. doi: 10.1126/science.1058409. [DOI] [PubMed] [Google Scholar]
- 3.Henderson R. The potential and limitations of neutrons, electrons and X-rays for atomic resolution microscopy of unstained biological molecules. Q. Rev. Biophys. 1995;28:171–193. doi: 10.1017/s003358350000305x. [DOI] [PubMed] [Google Scholar]
- 4.Halic M, Becker T, Frank J, Spahn CM, Beckmann R. Localization and dynamic behavior of ribosomal protein L30e. Nat. Struct. Mol. Biol. 2005;12:467–468. doi: 10.1038/nsmb933. [DOI] [PubMed] [Google Scholar]
- 5.Jiang W, Ludtke SJ. Electron cryomicroscopy of single particles at subnanometer resolution. Curr. Opin. Struct. Biol. 2005;15:571–577. doi: 10.1016/j.sbi.2005.08.004. [DOI] [PubMed] [Google Scholar]
- 6.Taylor DJ, et al. Structures of modified eEF2 80S ribosome complexes reveal the role of GTP hydrolysis in translocation. EMBO J. 2007;26:2421–2431. doi: 10.1038/sj.emboj.7601677. [DOI] [PMC free article] [PubMed] [Google Scholar]
- 7.Valle M, et al. Incorporation of aminoacyl-tRNA into the ribosome as seen by cryo-electron microscopy. Nat. Struct. Biol. 2003;10:899–906. doi: 10.1038/nsb1003. [DOI] [PubMed] [Google Scholar]
- 8.Rossmann MG. Fitting atomic models into electron-microscopy maps. Acta Crystallogr. D Biol. Crystallogr. 2000;56:1341–1349. doi: 10.1107/s0907444900009562. [DOI] [PubMed] [Google Scholar]
- 9.Grassucci RA, Taylor D, Frank J. Visualization of macromolecular complexes using cryo-electron microscopy with FEI Tecnai TEMs. Nat. Protoc. doi: 10.1038/nprot.2007.474. (in the press) [DOI] [PMC free article] [PubMed] [Google Scholar]
- 10.Gao H, et al. RF3 induces ribosomal conformational changes responsible for dissociation of class I release factors. Cell. 2007;129:929–941. doi: 10.1016/j.cell.2007.03.050. [DOI] [PubMed] [Google Scholar]
- 11.Roseman AM, Ranson NA, Gowen B, Fuller SD, Saibil HR. Structures of unliganded and ATP-bound states of the Escherichia coli chaperonin GroEL by cryoelectron microscopy. J. Struct. Biol. 2001;135:115–125. doi: 10.1006/jsbi.2001.4374. [DOI] [PubMed] [Google Scholar]
- 12.Baumeister W, Seredynski J. Preparation of perforated films with predeterminable hole size distributions. Micron. 1976;7:49–54. [Google Scholar]
- 13.Dubochet J, Groom M, Mueller-Neuteboom S. The mounting of macromolecules for electron microscopy with particular reference to surface phenomena and treatment of support films by glow discharge. In: Barrer R, Cosslett VE, editors. Advances in Optical and Electron Microscopy. London, New York: Academic Press; 1982. pp. 107–135. [Google Scholar]
- 14.Stoffler G, Stoffler-Meilicke M. Immunoelectron microscopy of ribosomes. Annu. Rev. Biophys. Bioeng. 1984;13:303–330. doi: 10.1146/annurev.bb.13.060184.001511. [DOI] [PubMed] [Google Scholar]
- 15.Stöffler G, Stöffler-Meilicke M. The ultrastructure of macromolecular complexes studied with antibodies. In: Tesche H, editor. Modern Methods in Protein Chemistry. Berlin: De Gruyter; 1983. pp. 409–455. [Google Scholar]
- 16.Ohi M, Li Y, Cheng Y, Walz T. Negative staining and image classification—powerful tools in modern electron microscopy. Biol. Proced. Online. 2004;6:23–34. doi: 10.1251/bpo70. [DOI] [PMC free article] [PubMed] [Google Scholar]
- 17.Adrian M, Dubochet J, Fuller SD, Harris JR. Cryo-negative staining. Micron. 1998;29:145–160. doi: 10.1016/s0968-4328(97)00068-1. [DOI] [PubMed] [Google Scholar]
- 18.Dubochet J, Lepault J, Freeman R, Berriman JA, Homo J-C. Electron microscopy of frozen water and aqueous solutions. J. Microsc. 1982;128:219–237. [Google Scholar]
- 19.Valle M, et al. Cryo-EM reveals an active role for aminoacyl-tRNA in the accommodation process. EMBO J. 2002;21:3557–3567. doi: 10.1093/emboj/cdf326. [DOI] [PMC free article] [PubMed] [Google Scholar]
- 20.Scheres SH, et al. Disentangling conformational states of macromolecules in 3D-EM through likelihood optimization. Nat. Methods. 2007;4:27–29. doi: 10.1038/nmeth992. [DOI] [PubMed] [Google Scholar]
- 21.Gao H, et al. Study of the structural dynamics of the E coli 70S ribosome using real-space refinement. Cell. 2003;113:789–801. doi: 10.1016/s0092-8674(03)00427-6. [DOI] [PubMed] [Google Scholar]
- 22.Cyrklaff M, Adrian M, Dubochet J. Evaporation during preparation of unsupported thin vitrified aqueous layers for cryo-electron microscopy. J. Electron Microsc. Tech. 1990;16:351–355. doi: 10.1002/jemt.1060160407. [DOI] [PubMed] [Google Scholar]
- 23.Iancu CV, et al. Electron cryotomography sample preparation using the Vitrobot. Nat. Protoc. 2007;1:2813–2819. doi: 10.1038/nprot.2006.432. [DOI] [PubMed] [Google Scholar]
- 24.White HD, Thirumurugan K, Walker ML, Trinick J. A second generation apparatus for time-resolved electron cryo-microscopy using stepper motors and electrospray. J. Struct. Biol. 2003;144:246–252. doi: 10.1016/j.jsb.2003.09.027. [DOI] [PubMed] [Google Scholar]


