Abstract
Background and Aims
Cotton shows a marked plasticity vs. density in terms of branch development and geometry, internode elongation and leaf expansion. This paper proposes interpretations for observed plasticity in terms of light quantity and quality.
Methods
3-D virtual plants were reconstructed from field observations and 3-D digitization and were used to simulate the light regime in cotton stands of different densities.
Key Results
All densities showed the same linear relationship between LAI and the sum of light intercepted by the canopy, from seedling emergence up to flowering. Simulated R : FR ratio profiles can very likely explain (1) the longer first internodes on main stem and branches and (2) the azimuthal re-orientation of branches toward the inter-row.
Conclusions
Simulation tools were used to analyse plant plasticity in terms of light quantity and quality. The methodology applied here at the stand scale will now be continued at the plant scale to further strengthen the above hypotheses.
Key words: Light capture, photomorphogensis, R : FR ratio, cotton, Gossypium hirsutum, plant architecture, virtual plants, phenotypic plasticity, density
INTRODUCTION
Density is a key factor in the performance of annual crops, which need to accumulate as much biomass as possible within a couple of months. High-density practice may be efficient in maximizing both light interception and subsequent biomass accumulation in young crops; however, this advantage disappears when the canopy closes, and the enhanced competition between plants for resources may lead to negative effects (Ford, 1975; Hutchings and DeKroon, 1994). Final crop performance at a given density will therefore mainly depend on the plant's ability to forage for existing resources.
Aside from competition for water and nutrients, density induces drastic changes in plants' light environment. Theses changes not only concern the quantity of photosynthetically active radiation (PAR) available for plants but also the spectral quality of light. The most important spectral change induced by the interaction of light with vegetation is the decrease in the R : FR ratio (ratio of red radiation, ‘R’, around 660 nm over far-red radiation, ‘FR’, around 730 nm). This decrease is known to elicit multiple morphogenetic responses in many plant species (Aphalo et al., 1999), such as inhibition of branching or tillering (Casal et al., 1986; Kasperbauer and Karlen, 1986), increased petiole or internode extension (Ballaré et al., 1991) and reduced leaf thickness (Smith and Whitelam, 1997). Other spectral modifications are also known to elicit morphogenetic responses, particularly in the blue light that controls phototropism in conjunction with FR light (Ballaré et al., 1992). All these so-called photomorphogenetic responses and the photoreceptors mediating them are now better understood. However, these responses are difficult to analyse, mainly because they interact with the plant carbon balance: clearly, responses such as branching or increased internode length can only be expressed within the limits allowed by assimilate availability. This is why substantial responses can be obtained when photosynthetically active radiation is maintained at reasonable levels (Smith and Whitelam, 1997) whereas responses are often contradictory and difficult to interpret under limiting conditions (Ballaré et al., 1991; Kurepin et al., 2007). Consequently, the study of plant behaviour in relation to density must be conducted not only with respect to light quality but also the quantity of PAR radiation that the plants receive.
According to the regular approach introduced by Monteith (1972), crop biomass accumulation may be related to its PAR interception through a coefficient of light-use efficiency (LUE). Generally, LUE is relatively stable for a given crop throughout its vegetative stage. Consequently, the main biomass gain in a developing crop depends primarily on its ability to rapidly augment its light capture capacity. In line with the concept that plant morphological plasticity contributes to increasing the plant's ability to forage for resources (Hutchings and DeKroon, 1994), and particularly the capacity to forage for light (Ballaré et al., 1997), we suggest that photomorphogenetic responses may be analysed in terms of light-foraging efficiency (LFE), defined as:
 |
where IPAR is the quantity of light intercepted by the crop.
We also further assert that this efficiency is a combination of two different traits:
the efficiency of the existing leaf area to capture light, which depends on plant geometry;
the efficiency of the ability to use light for increasing leaf area, which is basically a combination of LUE and the biomass partitioning to leaves.
Although this analysis would appear to be fairly simple, it is not that easy to carry out experimentally, partly due to the difficulties encountered in measuring the quantity and quality of the light actually intercepted by plants. An alternative approach consists of performing virtual measurements on 3-D plant models since, together with the development of functional–structural plant models over the last two decades, powerful simulation tools have also been developed to simulate the plant's ‘phylloclimate’ (Chelle, 2005) and, in particular, the light regime within canopies. Recent models using the radiosity method (Chelle and Andrieu, 1998; Solers et al., 2003; Evers et al., 2005) or the ray-tracing method (Allen et al., 2005; Clark and Bullock, 2007) are now able to simulate the exchange of scattered light between neighbouring plants and between plants and soil. They can therefore be used to address not only the light balance of organs in the PAR range but also the spectral changes resulting from differential scattering of the different wavelengths. However, this latter use of light models still requires a good deal of investigation.
The aim of the study reported here is to illustrate how simulations based on virtual plant models can be used to estimate the quantity and quality of light intercepted by cotton crops of different densities. The methodology was applied to cotton stands throughout their vegetative growth in order (1) to identify the major changes induced by plant competition; (2) to analyse their overall effect on crop efficiency in foraging for light; and (iii) to evaluate the role of the R : FR ratio in a number of morphological changes.
MATERIALS AND METHODS
Field experiments
This study was based on a density experiment conducted in 2003 in Montpellier, France (42°60′N, 3°90′E), whereas a previous experiment conducted in 1999 at the same location was used to validate the virtual plant construction method. Both experiments were conducted with the cultivar ‘DES 119’ (Clouvel et al., 2007). Plots were managed with regular fertilization and a non-limiting water supply during the cotton vegetative phase. Rows were east–west orientated in all experiments. In 1999, plants were sown on 21 May and grown at a density of 6 plants m−2 along 0·8-m spaced rows. In the 2003 experiment, plants were sown on 30 May and grown at densities of 1, 2 and 4 plants m−2 (referred to as D1, D2 and D4, respectively) along 1-m spaced rows.
Measurements in the 2003 experiment were made on ten contiguous plants per density. The number of nodes on the main stem and on monopodial branches was recorded weekly for each plant. Final internode length was measured on the same plants at harvest along with leaf area using a leaf area meter (laser area CI-209, CID Inc., Camas, Washington). Time-course changes in leaf area were determined for five plants per plot at three stages: 1st reproductive bud, 1st opened flower and end of vegetative growth.
In the 1999 experiment, a complete geometrical description was made of 12 adjacent plants (i.e. a row portion of about 2 m long) using a 3D Fastrack digitizer equipped with a long-range emitter and a ‘stylus’ sensor (Polhemus, Inc., Winooski; http://www.polhemus.com) applying similar methodology to that presented by Sinoquet and Rivet (1997). Digitizing was performed at three plant stages: 1st reproductive bud (12 July), 1st flower (1 Aug.) and end of vegetative growth (8 Sept.). This device was used to measure the 3-D co-ordinates of all nodes on the main stem and branches, and the co-ordinates of the petiole extremity and blade tip. The orientation and length of the central rib on each leaf were also recorded. Sketches of plant topology were drawn in the field concomitantly with the digitizing procedure. Plant topology was later coded in a ‘Multiscale Tree Graph’ file (Godin et al., 1997; Godin and Caraglio, 1998), which was merged with the corresponding 3-D co-ordinates' file. Lastly, AMAPmod software (Godin et al., 1999) was used to reconstruct 3-D architecture for the measured plants.
Percentage crop cover (CC) was estimated for all three stages in the 1999 experiment using two alternative methods.
(1) Multi-spectral images (at wavelengths 450, 550, 600, 650, 750 and 850 nm) were acquired with a camera [VIDEO XYBION (MSC-02), 30 ° FOV] mounted on a platform 2 m above the canopy. The fractions of visible soil and vegetation were extracted from red (750 nm) and infrared (850 nm) images as explained in Luquet et al. (2003). Measurements were made at the spot where the plants were digitized.
(2) For the rest of the plot, crop cover was estimated from reflectance data acquired with a CIMEL reflectometer (CIMEL Electronique, Paris) working in the three spectral bands of the HRV instrument on SPOT satellite images (green, 500–590 nm; red, 620–680 nm; near-infrared, NIR, 790–890 nm). Measurements were taken weekly at noon at five locations, each time averaging ten acquisitions over an area of about 1/3 m2. Crop cover (CC) was estimated from the Normalized Difference Vegetation Index (NDVI; eqn 1), subsequently converted into CC using eqn (2). Equation parameters were fitted to acquired data in digitized subplots, giving a = 1·026; b = 0·042 (r2 = 0·966, based on six points).
 |
1 |
ρNIR and ρred being reflectance in the near infrared and red bands, respectively.
 |
2 |
Climate
Air temperature (at 3 m) was measured by a CIMEL automatic station (ENERCO 411), located 100 m from the experimental fields. In 1999, average daily temperature varied from 18 °C at seedling emergence to 25 °C at 1st flower appearance. In 2003, temperature varied from 23 °C at emergence to 28 °C at 1st flower appearance. The cut-out stage (stage at which organogenesis is drastically inhibited by fruit load; Patterson et al., 1978) occurred in September for all experiments, with average daily air temperatures ranging from 18 to 20 °C.
Dynamic simulation of cotton architecture
Organogenesis and plant topology
A complete description of ten plants per experiment yielded plant topology and organ dimensions (leaf area and internode length). Plant simulation therefore consisted of interpolating plant topology and organ growth from emergence up to the harvest stage.
The number of nodes on the main stem and monopodial branches was interpolated from weekly field observations. Node appearance rate (NAR) on sympodial branches was taken as a ratio (R) of that on the main stem. As described by Reddy et al. (1997), this ratio was considered to depend on the average daily air temperature according to the following equation:
 |
3 |
where T = (Tmin + Tmax)/2.
Organ expansion
The duration of leaf and internode expansion was calculated by the relationship with air temperature as used in the Gossym model (Hodges et al., 1998), and this regardless of position within the plant. Daily organ expansion was calculated according to the following equations:
 |
4 |
 |
5 |
where T is the average daily temperature, YLE is the daily increase in leaf area expansion and YIE is the daily increase in internode length expansion.
According to these equations, an organ is fully expanded when the sum of Y is 1. Petiole length (Lp) was obtained through the following allometric relationship with leaf area (AL) established on leaves of all ages and sizes:
 |
6 |
with Lp expressed in cm and AL in cm2.
Plant geometry
The branching angles (α; degrees) of monopodia and sympodia on the main stem were extracted from data sets generated from plants digitized in 1999. The α value was 57·1 ± 16·4 (mean ± s.d.) for monopodia and 56·4 ± 15·8 for sympodia. In order to follow changes in branching angle over time, the initial α value was set to 40 °C and subsequent bending with age and branch curvature was simulated according to de Reffye's methodology (de Reffye, 1976).
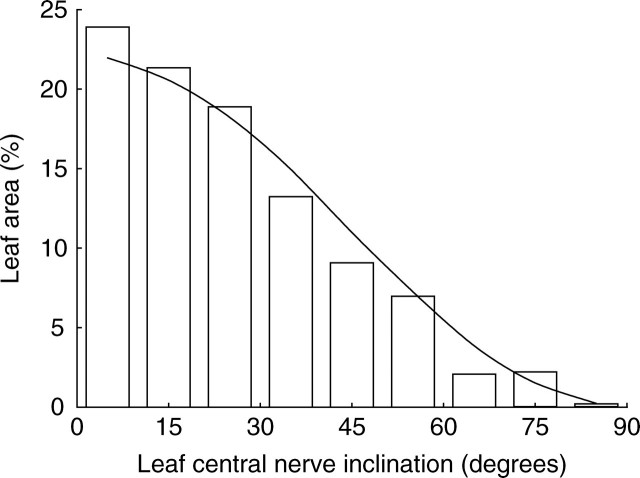
Leaf inclination was similarly extracted from data sets generated from plants digitized in 1999. Results (Fig. 1) showed that leaf inclination distribution was similar to the theoretical planophile distribution (de Wit, 1965) as defined by its probability density function ḡL (θL) of leaf inclination (θL):
 |
7 |
Fig. 1.
Observed leaf-angle distribution (bars) compared to the theoretical planophile distribution (curve).
The initial inclination of unfolding leaves on virtual plants was set at 15°. A bending function was then applied to generate (in conjunction with branch geometry) a planophile distribution.
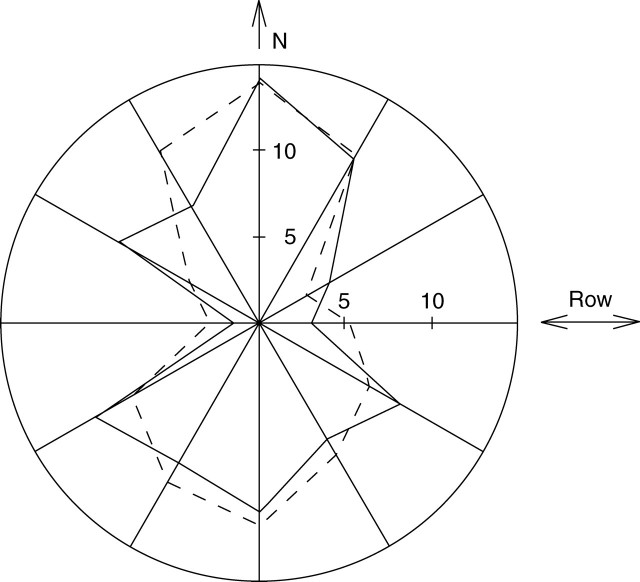
Branch azimuth showed marked anisotropy (see Fig. 10): most branches were orientated towards the inter-row. To simulate this feature, the branches were azimuthally turned aside if their deviation from the inter-row direction exceeded a maximum value θM, which was set at 45° for the highest densities (4 and 6 plants m−2), 30° for the medium density (2 plants m−2) and 0° for lowest density (1 plant m−2). The same procedure was applied for monopodia with θM set at 75°, 55° and 0° for densities 4–6, 2 and 1 plant m−2, respectively. A library of 3-D patterns was used to represent plant organs (Fig. 2).
Fig. 10.
Azimuthal distribution (%) of monopodial and sympodial branches in the 1999 experiment at a density of 6 plants m−2.
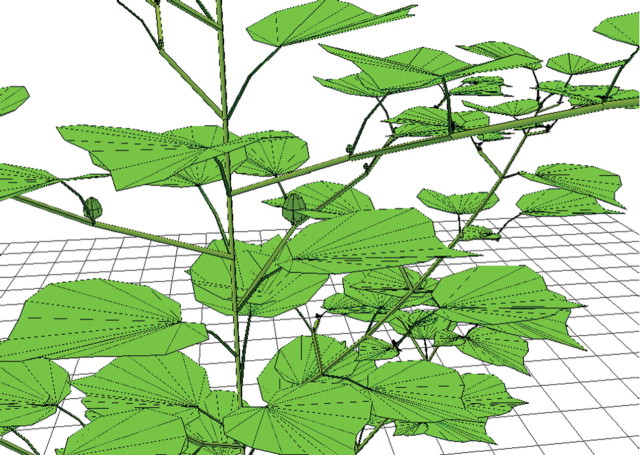
Fig. 2.
Close-up illustration of a simulated cotton plant.
Simulation of virtual stands
For each plot, the ten adjacent plants described along a row were simulated (Fig. 3) and duplicated to simulate a plot containing 25 plants. Given that the radiative model virtually duplicates the plot, the result was an infinite canopy constituted by the replication of the ten-plant sample. The architecture of each plant was updated daily from its observed emergence date up to its cut-out stage and beyond.
Fig. 3.
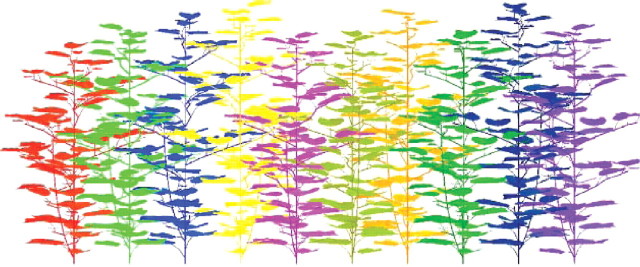
Example of reconstruction of ten adjacent plants measured along a row at 4 plants m−2 density at the time of cut-out.
Simulation of light interception
Radiative transfers were simulated using the MMR (Mir-Musc-Radbal) model implemented on the ARCHIMED simulation platform (Dauzat et al., 2007). The MMR model has been validated for different plants under various conditions (Chenu et al., 2005; Dauzat and Eroy, 1997; Lamanda et al., 2007).
Incident radiation
Incident radiation was depicted as a set of 46 downward-directional fluxes spread over the sky vault according to the ‘Turtle’ model (den Dulk, 1989). Directional fluxes were calculated throughout the day from values of total solar radiation (Rs), which was either measured or estimated by applying a cloudiness reduction factor to extraterrestrial solar radiation (Fraser et al., 1999).
Rs was divided into its direct and diffuse components by means of the global and extraterrestrial radiation ratio (Spitters et al., 1986). Direct radiation was then assigned to the closest Turtle directions, whereas diffuse radiation was assigned to all directions in proportion to the corresponding directional sky luminance. Sky luminance was calculated using Dogniaux's formula (1973) for a clear sky and Anderson's formula (1966) for a standard overcast sky. A combination of the two formulae was used under intermediate conditions.
Interception of incident radiation by vegetation
The MIR model (Dauzat et al., 2001) calculates images of the plot from each of the 46 directions (d). In each image (i.e. direction), the number of visible pixels (Po,d) for each plant organ (o) is stored in a file. The number of visible pixels is then later converted into units of organ area exposed to incident light in the d direction.
Additionally, MIR calculates the superimposition of hidden organs below visible pixels using the Z-buffer technique. This information is used to calculate exchange coefficients between horizontal layers of vegetation.
Calculation of multiple scattering within the stand
Multiple scattering was calculated for horizontal vegetation layers (10 cm wide in this study). The light intercepted by a layer in any given direction was scattered in 46 upward and 46 downward directions according to the optical properties of the vegetation elements. The re-interception of scattered light by other vegetation layers and the soil was then calculated on the basis of the exchange coefficients defined above. The process was repeated until the extinction of scattered radiation.
Radiative balance of plant organs
The RADBAL model operates on the basis of sub-hourly time steps. It calculates first the incident radiation as described above and then the irradiance of plant organs by totalizing incident and scattered radiation for all directions.
Simulation experiments
The MMR model was run in this study at 5-min time steps using a cloudiness index of 0·65. The scattering (reflectance + transmittance) coefficient for vegetation elements was set at 0·20 for the PAR range, 0·10 for red (660 nm) and 0·90 for far-red (730 nm). Soil reflectance was set at 0·18, 0·20 and 0·22 for PAR, red and far-red, respectively. A toricity option was used to simulate an infinite canopy.
To estimate the R : FR ratio sensed by plant organs, the MMR model was run successively for red and far-red bands. The R : FR ratio of incident light above the canopy was taken to be 1·15 (Holmes and Smith, 1977). The R : FR ratio of vegetation was then calculated as the ratio between vegetation irradiance in the two bands. In this manner the R : FR ratio was calculated for the light actually intercepted by the plants. Light quality was integrated for vegetation layers without differentiating plant organs. It should be noted in this respect that the actual R : FR ratio may be different for leaves and internodes since leaves close to the horizontal intercept mostly upward and downward light, whereas erected internodes mostly intercept sub-horizontal light (Ballaré et al, 1990).
RESULTS
Validation of cotton stand reconstruction
The cotton stand reconstruction was validated for the 1999 experiment. Comparisons of biometrical variables such as plant height (Fig. 4A), number of nodes on main stem (Fig. 4B) and LAI (Fig. 4C) supported the validity of the organogenetic and morphogenetic rules used to interpolate plant development from emergence to cut-out stage.
Fig. 4.
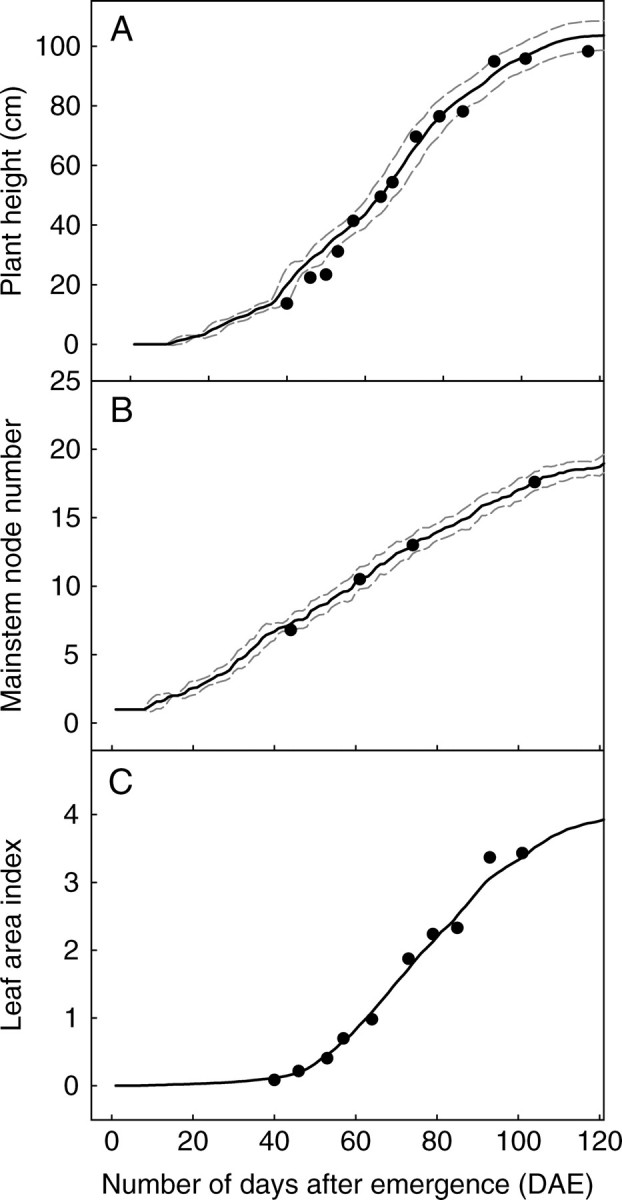
Simulated (points) and observed (lines) changes in (A) number of nodes on the main stem, (B) plant height, and (C) leaf area index. The dotted lines in (A) and (B) indicate s.d. (All data from the 1999 experiment.)
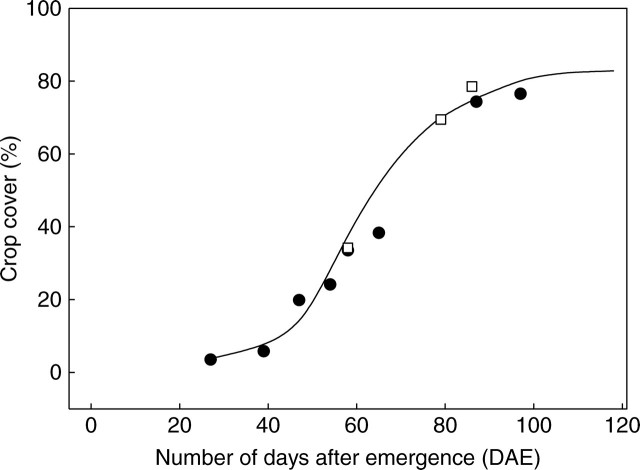
However, light interception is primarily determined by plant geometry, which is the most difficult aspect of plant simulation. In order to check overall plant geometry, vertical and lateral leaf distributions were tested and these showed that the vertical LAI profile of simulated plants was in good agreement with that of digitized plants (Fig. 5). Percentage crop cover was used to check plant lateral extension. The crop cover of virtual stands was obtained from an analysis of MIR images calculated from a bird's eye view and compared to field measurements taken with the XYBION camera and the CIMEL reflectometer. A satisfactory agreement was found between crop cover measurements and simulations throughout the cotton vegetative stage (Fig. 6).
Fig. 5.
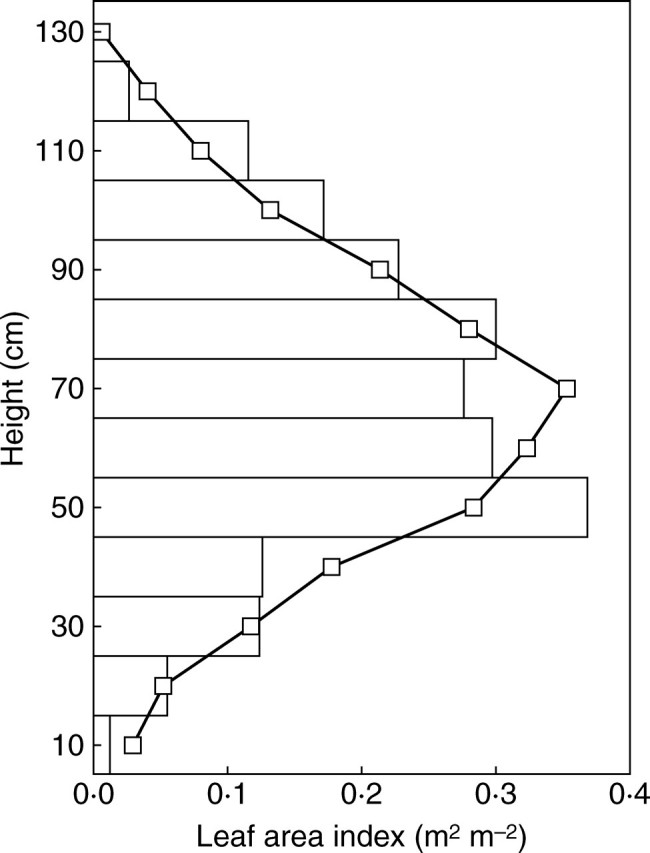
Observed (bars) and simulated (line and squares) vertical profile of leaf area at the time of cut-out in the 1999 experiment.
Fig. 6.
Simulated (line) and measured (points) percentage crop cover. Squares represent values extracted from field images taken from above the canopy, and black circles represent values estimated from NDVI measurements.
Architectural changes with density
Organogenetic changes
The cotton main stem is a monopodium that axilates monopodial branches on basal main-stem nodes (mainly on nodes 4–7) and sympodial branches on upper nodes. At the lowest density, monopodial branches developed at all possible positions and grew substantially (Table 1; Fig. 7). Some monopodial branches have an architecture similar to that of the main stem (i.e. producing axillary sympodia). In this respect, they duplicated the architecture of the main stem. Conversely, at the density of 4 plants m−2, about 40 % of the monopodia were inhibited.
Table 1.
Main plant characteristics at harvest (120 days after emergence)
| Number of nodes on: |
Dry mass per plant (g) |
|||||
|---|---|---|---|---|---|---|
| Density (plants m−2) | Number of monopodial branches | Main stem | Monopodial branches | Lower sympodia | Leaves | Stem |
| 1 | 4·9 ± 0·8 | 22·3 ± 0·8 | 12·8 ± 2·2 | 6·8 ± 1·4 | 169 ± 25 | 269 ± 39 |
| 2 | 4·5 ± 0·9 | 21·5 ± 0·9 | 11·5 ± 2·5 | 5·3 ± 1·3 | 91 ± 18 | 148 ± 25 |
| 4 | 2·9 ± 0·7 | 19·8 ± 0·8 | 10·5 ± 1·9 | 4·9 ± 1·2 | 61 ± 26 | 98 ± 40 |
Data are means ± s.d.
Fig. 7.
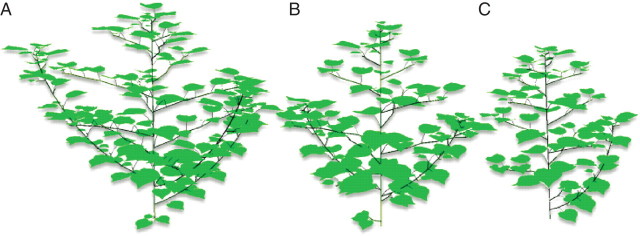
Illustration of the architectural plasticity of cotton plants grown at densities of 1, 2 and 4 plants m−2 (A–C, respectively).
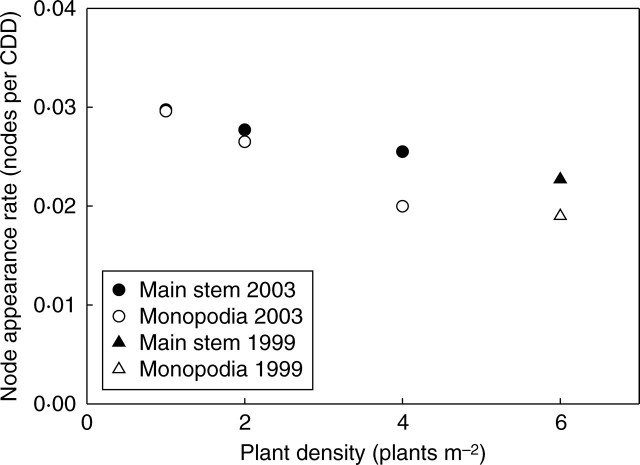
Node appearance rate (NAR) decreased exponentially with density on the main stem and branches (Fig. 8 and Table 1; more details given in Clouvel et al., 2007). It should be noted that the NAR was similar for main stem and axillary monopodia at the lowest density, but diverged for higher densities due to density exerting a more marked depressing effect on axillaries than on the main stem.
Fig. 8.
Effect of density on node appearance rate (expressed in degree-days) on main stem and monopodial branches.
Morphogenetic changes
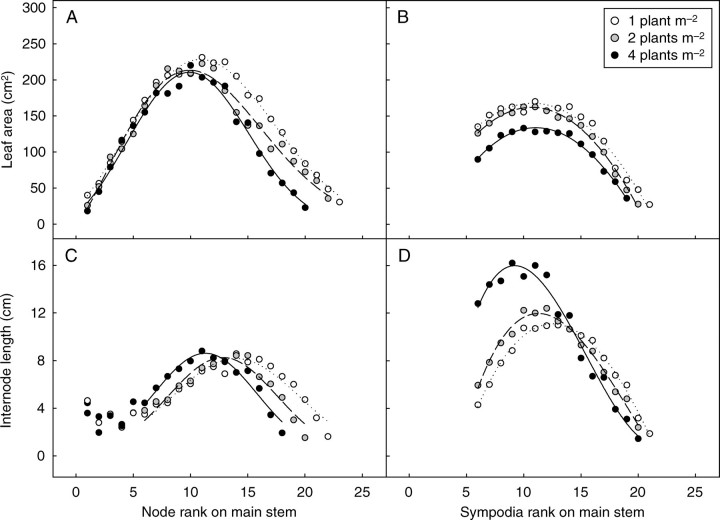
Leaf size differed greatly with topological position in the plant structure but was not greatly affected by density (i.e. leaves at the same topological position were comparable in size). On the main stem (Fig. 9A), leaf area increased in a linear manner with node rank followed by a decrease for the highest node ranks (over node 10). The first phase was similar for all densities, whereas the decrease occurred slightly earlier for highest densities. The relationship between leaf area and node rank on axillaries was also bell-shaped. Leaves were significantly smaller at density D4 but fairly similar at densities D1 and D2 (Fig. 9B). The allometry between blade area and petiole length (eqn 6) was found to be independent of density.
Fig. 9.
Time-course changes in leaf area and internode length according to position on the main stem (A, C, respectively) and changes in leaf area and internode length on the first metamer of sympodial branches according to their rank on the main stem (B, D, respectively). Plant densities as indicated.
If the first five nodes (which are pre-formed in the seed) are excluded, the trend for internode length along the main stem was also bell-shaped. Increasing the density resulted in longer internodes in the lower half of the main stem but shorter internodes in the upper half (Fig. 9C). The transition between the two zones was located lower for D4 (at node 10) than for D2 (at node 13) and D1 (at node 15). The same trends were observed for basal nodes on sympodia but with density exerting an even stronger effect. For instance, the first internode on sympodia axillated by nodes 6 to 11 on the main stem was twice as long in D4 than in D1 (Fig. 9D). The opposite trend was observed for upper sympodia where internode length decreased with density.
Geometrical changes
Branch orientation was drastically changed by density: at the lowest density (with plant spacing of 1 × 1 m), the azimuthal orientation of monopodial and sympodial branches was isotropic, whereas they were mostly stretched toward the inter-row at the highest density (Fig. 10). Conversely, branch bending was found to be dependent on branch size rather than density.
LAI changes
The rate of increase in LAI (Fig. 11A) was steeper in the early growth stages (until 35 DAE) at the highest density, but differences between the densities tended to lessen in the period preceding cut-out. When cut-out occurred, LAI was 1·73, 2·31 and 3·33 for densities of 1, 2 and 4 plants m−2, respectively. This implies that leaf area per plant for the lowest density was twice that of the highest density.
Fig. 11.
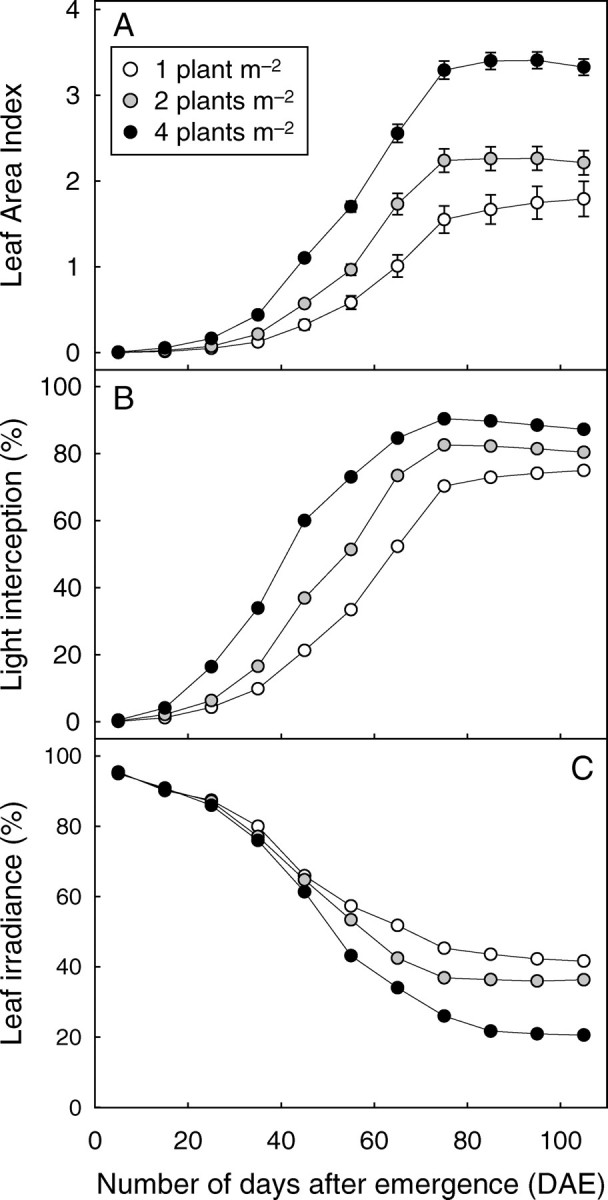
Time-course changes in (A) leaf area index, (B) percentage of incident light intercepted by stands, and (C) average leaf irradiance expressed as a percentage of incident light, for plant densities as indicated.
Light interception and light-use efficiency for incrementing LAI
The percentage of incident light intercepted by vegetation (Iv) increased rapidly over time for D4 and reached 90 % at cut-out (Fig. 11B). Iv showed similar trends over time for D2 and D1 but with delays of about 10 and 20 d, respectively. Dissimilarity for Iv values between the different densities were maximal at emergence (at very early stages, Iv was proportional to density) and progressively decreased until cut-out (Iv was 82 % and 70 % at this stage for D2 and D1, respectively). Conversely, average leaf irradiance in PAR started with the same value of close to 100 % incident radiation for the three densities and increasingly diverged until cut-out, where it stabilized (Fig. 11C).
In order to express the efficiency of light interception, we introduced a variable ‘radiation day’ (RD), which we defined as the integration of effective daily radiation intercepted by the crop since emergence:
 |
8 |
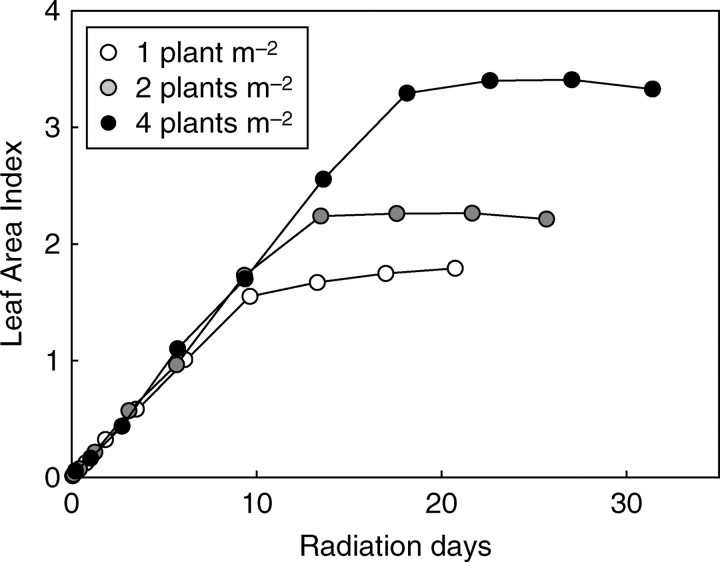
Plotting LAI against RD showed that light-use efficiency for producing leaf area was almost the same for all three densities up to cut-out (Fig. 12). The linear-fitting calculated from 0 to 55 DAE (i.e. excluding the last four points of Fig. 12) gave LAI = 0·183RD; r2 = 0·996.
Fig. 12.
Changes in LAI with respect to cumulated intercepted light for densities of 1, 2 and 4 plants m−2. ‘Radiation days’ is the integration over days of the fraction of daily incident radiation that is intercepted by the crop.
Note that the graphs produced by plotting LAI against integrated radiation expressed in energy or moles of photons instead of RD were fairly similar to Fig. 12. RD was used here to highlight the fact that crops capture only a small fraction of the available light resources during their vegetative growth. In this experiment, the fraction of light captured by vegetation from emergence up to 95 DAE was about a third of incident radiation for D4 and only a quarter for D1.
Light-capture efficiency
Light-capture efficiency was characterized by the extinction coefficient of incident radiation (Kbl) as defined in the Appendix.
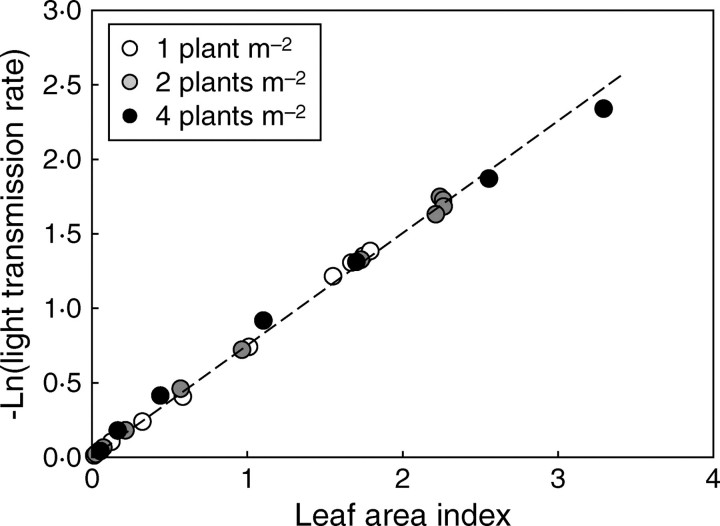
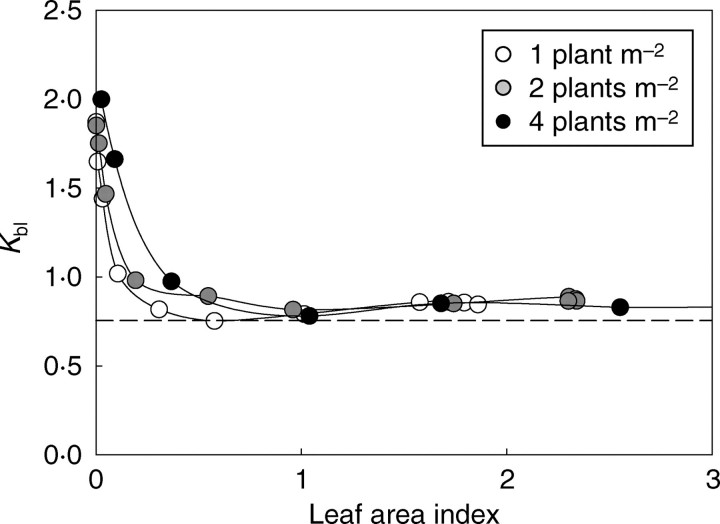
The logarithm of the light transmission rate (T = 1 − Iv) was linearly related to LAI, and this for all growth stages and planting densities (Fig. 13). The regression obtained for the pooled data gave an extinction coefficient (Kbl) of 0·75, which, in the first approximation, was the same for all densities. However, the inversion of Beer's law with eqn (9) showed that the Kbl value changed with time and differed between densities (Fig. 14).
 |
9 |
Fig. 13.
Relationship of the logarithm of the light transmission rate under the canopy and LAI from emergence to the cut-out stage.
Fig. 14.
Time-course changes in light extinction coefficient Kbl with LAI for densities of 1, 2 and 4 plants m−2. The horizontal line represents the Kbl value of a theoretical planophile canopy.
Vertical profiles of quantity and quality of intercepted light
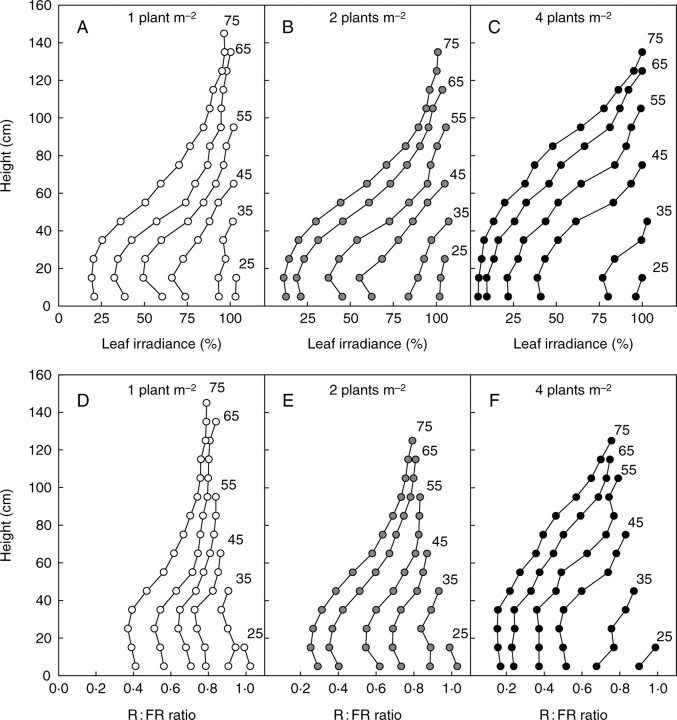
Averaging the leaf irradiance as presented in Fig. 11C did not render the variability of the conditions between the top and the bottom of the canopy. Figure 15A–C shows that PAR irradiance of the upper leaves was close to 100 % of incident photosynthetic photon flux density (PPFD) for all dates and densities. This result is consistent with the fact that most leaves were close to horizontal and also received an additional fraction of light scattered by surrounding vegetation and soil. Conversely, leaf irradiance rapidly diverged between densities at the bottom of the canopy, where values as low as 20, 10 and 5 % of PPFD were observed at 75 DAE for densities D1, D2 and D4, respectively.
Fig. 15.
Vertical profiles of PAR irradiance of leaves expressed as percentage of incident light (A–C) and R : FR ratio of light intercepted by vegetation (D–F) for population densities of 1, 2 and 4 plants m−2. The numbers at the top of the profiles indicate the number of days elapsed after emergence.
The R : FR ratio for the vegetation (i.e. the R : FR ratio of the light actually intercepted by plant organs) was simulated for 10-d intervals from emergence up to cut-out. The results are presented in Fig. 15D–F as vertical profiles calculated by splitting the canopy into 10-cm high vegetation layers. It can be seen that initial values for R : FR were lower than the value of incident light (1·15) because soil reflectance was lower for R than for FR (Kasperbauer and Hunt, 1992). Subsequently, the profiles rapidly differed between the three densities. As LAI increased, the R : FR diminished in the lower part of the canopy, whereas its value tended to stabilize at about 0·7 in the uppermost layer of the canopy.
DISCUSSION
Validation
The good agreement observed between measured and simulated variables such as canopy height, LAI and crop cover throughout the vegetative stage in the 1999 experiment validated the method used for cotton plant reconstruction. Moreover, it was shown by Sadras and Wilson (1997) that the Charles-Edwards and Lawn equation (1984) relating the daily light interception by the crop to light interception around noon is suitable for cotton. Given that light interception at noon is roughly proportional to crop cover, the good agreement between measured and simulated crop cover reinforces the notion that reconstructed cotton stands were a reliable basis for calculating light interception.
Effect of density on time-course changes in cotton architecture
Competition between plants induced clear organogenetic trends that can be considered to be mainly (1) inhibition of some monopodial branches in early growth stages and (2) reduction in node appearance rate on the main stem and branches. This latter effect was more notable on upper (sympodial) than lower (monopodial) branches and on the main stem (Table 1).
Morphological changes affecting leaves and internodes were more complicated, with contrasting responses over time. Two phases could be distinguished for all densities according to final organ size (leaf area and internode length): a phase of increasing organ size, followed by a phase of decreasing organ size. During the first phase, internode length increased with density. As discussed below, this observation is consistent with the assumption that internode length is dependent upon R : FR modifications within the canopy. However, the opposite response was observed during the second phase. These features strongly suggest that photomorphonegetic responses of the internodes were counteracted by plant carbon balance limitations during this phase. This assumption is further supported by the fact that leaf area and internode length decreased simultaneously. Interestingly, it may be noted that the transition between the two phases occurred at a time when average leaf irradiance decreased below 60 % of incident PPFD (Fig. 11C).
Light quality and photomorphogenesis
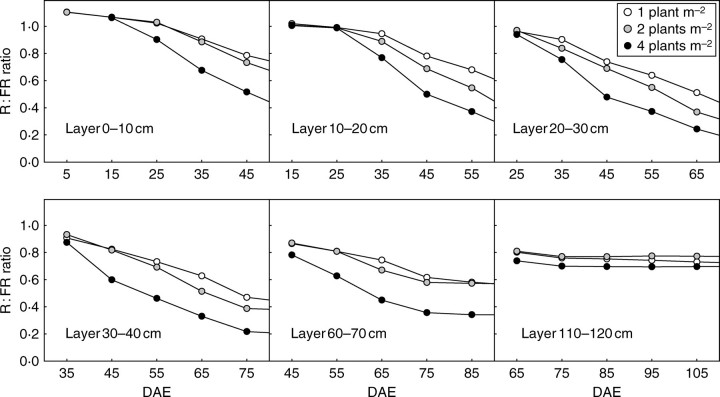
Increased internode length is a regular and important morphological response to the R : FR ratio (Smith and Whitelam, 1997). This mechanism can be invoked to interpret the density effect observed on the length of basal internodes on the main stem and sympodia. When internodes are set up, they are located at the top of the canopy where the R : FR ratio does not differ greatly between densities (Fig. 15D–F). However, it should be noted that the R : FR ratio for intercepted light was averaged for all organs within the horizontal vegetation layers. In fact, internodes intercept a greater proportion of horizontally propagating light than leaves and consequently can perceive more subtle changes in their lateral surroundings (Ballaré et al., 1990). Moreover, if the internode response is to be understood, one has to account for the duration of internode elongation (about 3 weeks). In fact, time-course changes in the R : FR ratio at the top of the canopy were different for the three densities and consequently internodes experienced different ratios during their elongation. This feature can be demonstrated by plotting the time-course changes in R : FR at different heights within the canopy (Fig. 16). As the canopy develops, the upper layer (left-most points on the graphs) is covered by new layers that decrease its R : FR ratio. This phenomenon is particularly effective in periods of active growth and is more accentuated for the highest planting density. As a consequence, the more rapidly the canopy develops (young stages) the more the R : FR ratio is altered. In contrast, the R : FR ratio stabilizes when plants reach the cut-out stage. The study of internode length on the main stem supports the assumption that differences observed between densities may be driven by the R : FR ratio. The fact that sympodia start their development when the main stem has already developed three or four metamers above their branching node may also explain why the density effect was more pronounced on the sympodium first internode than on the main-stem internode axillating the sympodium.
Fig. 16.
R : FR ratio of light intercepted by different horizontal canopy layers at densities of 1, 2 and 4 plants m−2. At the earliest date for each graph (i.e. the left-most point), the layer was located at the top of the canopy. DAE, days after emergence.
Density was observed to exert a drastic effect on branch reorientation toward inter-rows. Phototropism is known to be largely controlled by blue-light receptors, although phytochromes also contribute to the overall response (Ballaré et al., 1992; Lin, 2002). In the experiments reported here, branch reorientation occurred in the young stages of plant growth, i.e. before marked blue-light masking by neighbouring plants. The FR light, which is far more altered by vegetation than blue light, is therefore likely to play a significant role (Ballaré, 1999). However, this question was not further addressed here as any evaluation of this assumption requires an analysis of light quality not at the scale of vegetation layers, but for individual branches.
Light-foraging efficiency
Cotton shows phenotypic plasticity that allows the plant to double its foliage area when growing at a density of 1 plant m−2 rather than 4 plants m−2. One mechanism is the variable development of monopodial branches that can duplicate main-stem architecture at a low density. Given the lateral extension of these monopodia, plants at a low density can enhance their light capture in their early growth stages.
As shown by Fig. 12, the efficiency of light use for incrementing LAI (LUEA) was fairly linear, whatever the planting density, during the vegetative stage until cut-out stopped vegetative growth. This feature means that plant investment in foliage development is fairly constant. If it is assumed that – for a given density – neither leaf mass area nor LUE changed significantly over time, this implies that assimilate allocation to leaves was stable during the vegetative period until reproductive organs began to compete with vegetative growth. In terms of plant strategy, preferential allocation to light-capturing organs is positive for biomass accumulation as long as the canopy is not closed. Such a strategy may therefore be considered as optimal for low-density cotton crops that never reach canopy closure. In contrast, at high densities, the canopy rapidly closes and the benefit of increasing LAI is less marked.
The second observation that can be made from Fig. 12 is that LUEA was similar for all densities during the vegetative stage. This feature may appear trivial since neither the LUE nor the allocation of assimilates to foliage are supposed to be greatly affected by density. However, in terms of plant plasticity, this also means that leaf area increment is not limited by organogenesis or morphogenesis. More precisely, the development of monopodia allows a steady allocation rate of assimilates for producing leaf area. In this respect, cotton may be said to be perfectly plastic over a density range of 1–4 plants m−2.
Efficiency of light capture by LAI
At the very early growth stages, the extinction coefficient of incident light, Kbl, was independent of density since (1) plant geometry was similar and (2) mutual shading between plants was negligible. Its value of greater than 1 means that – owing to their orientation – the leaves intercepted more light than flat, horizontal panels of the same area in an open space. Subsequently, Kbl rapidly decreased because of self-shading inside the plant crowns and mutual shading between plants. The decrease in Kbl with density reflected the fact that – for a given LAI – the lower mutual shading in D1 did not compensate for the higher self-shading resulting from branch development. Still later, when the canopy closed, the value of Kbl tended to stabilize at around 0·85. This value is above that obtained for a theoretical planophile canopy where leaves are randomly dispersed (the Kbl value of such a theoretical canopy is 0·755; see Appendix). This result shows that cotton plants have a marked capacity to fill gaps in the canopy.
CONCLUSIONS
Together with functional–structural plant models (FSPMs) devoted to the simulation of plant architecture, the last two decades have seen the development of specific light models to simulate not only the interception of incident radiation but also the exchange of scattered radiation between plant organs and their local environment. Such models can be used to determine spectral modifications within canopies and, more specifically, the quality of light actually sensed by plant organs. However, this field is still little explored and thus warrants a great deal of further investigation. Pioneering studies conducted on white clover (Gautier et al., 2000) and recently on spring wheat (Evers et al., 2007) illustrate how FSPMs can be coupled with light models to simulate plants that respond to light quality. In these studies, empirical photomorphological responses to R : FR were tested and their overall results were evaluated against field observations. Such an approach is fruitful but difficult because of the complexity of interacting processes and, particularly, the combined effects of light quantity and light quality. Alternatively, our approach consisted of performing simulations on replicas of actual stands in order to make virtual measurements of the quantity and quality of light intercepted by plants throughout their development. By doing so, useful information was obtained for analysing plant responses. However, further investigations will need to differentiate between leaves and internodes in respect to the quality of light to which they are subjected.
In the present study we have proposed a framework for the analysis of photomorphogenesis in terms of foraging efficiency. This first investigation was conducted at the stand level because, as claimed by Aphalo et al. (1999), ‘When moving the viewpoint from individual plants to the mono-specific stand, new emergent properties of the system appear and the apparent ecological function of shade avoidance as traditionally described (Casal and Smith, 1989; Schmitt, 1997) needs to be expanded’. In this study we have further asserted that, when the canopy of a monospecific stand is still open, setting new light captors, i.e. incrementing LAI, is the most cost-effective investment to ensure further growth. On the other hand, photomorphogenetic responses such as phototropism and increased internode elongation tend to optimize light capture by the existing LAI. Given that morphogenetic responses have a cost, crop strategy may therefore be designed as a compromise between (1) setting new light captors and (2) optimizing the light capture by these captors.
In order to determine cotton crop strategy, we compared time-course changes in cotton stands at densities ranging from 1 to 4 plants m−2. We reconstructed portions of these stands from detailed field observations and used them to simulate their light capture over time. The results obtained showed that light-use efficiency for increasing leaf area was stable throughout the vegetative phase and was similar for all densities. To achieve this result, cotton plants adjust their organogenesis rather than their morphogenesis, i.e. the number of leaves rather than leaf size. The organogenetic plasticity of branches allows the plant to adjust its lateral extension in relation to planting density. The overall result was that incident light was efficiently captured at all three studied densities.
This study also showed clear photomorphogenetic responses to density concerning (1) branch reorientation toward the inter-row and (2) increased basal internode length on the main stem and branches as the R : FR ratio decreased. Branch reorientation is obviously a major light-capture optimization mechanism both at stand and plant levels (Herbert, 1983). Conversely, increasing internode length on the main stem can help individual plants improve their access to light but not necessarily improve light capture at the stand level (Anten and Hirose, 2001). To evaluate further the light-foraging efficiency of cotton, we will therefore, in a forthcoming paper, quantify the gains provided by responses to density at both plant and stand levels.
ACKNOWLEDGEMENTS
We wish to thank ADEME (Agence De l'Environnement et de la Maîtrise de l'Energie) and CRLR (Conseil Régional Languedoc-Roussillon, France) for their financial support.
APPENDIX
Definition and measurement of light-capture efficiency
The notion of light-capture efficiency was used in this study to characterize how efficiently crops use their leaf area to capture PAR. Two definitions are possible depending upon whether the interception of scattered light is accounted for or not. If the sole interception of incident radiation is considered, Beer's law may be expressed as:
where I↓ is incident radiation, Isoil is the radiation reaching the soil without interacting with vegetation and Kbl is the extinction coefficient that would be obtained with black leaves and black soil (Goudriaan, 1977), i.e. with no light scattering in the stand.
Kbl can be approximated from radiometric measurements of I↓ and Isoil in a waveband where light scattering is reduced (e.g. with the Plant Canopy Analyser, filtered at 490 nm to minimize the contribution of radiation scattered by the foliage). Alternatively, Iv can be calculated from measurements of gap fractions (GF) using a method such as hemispherical photographs:
 |
where θ and ϕ are the zenith and azimuth angles of discrete sky sectors, respectively, GF(θ,ϕ) are the directional gap fractions and I(θ,ϕ) the directional incident radiation, such that Σθ,ϕ I(θ,ϕ) = I.
Most software used to analyse hemispherical photographs give Iv for theoretical radiative conditions characterized by a cloudiness index; Kbl can then be obtained by inverting eqn (A1). The value for Kbl can also be approximated by measuring I↓ and Isoil at wavelengths where scattering is reduced. This is the case for the plant canopy analyser (PCA) that works in the blue band.
Alternatively, if not only the capture of incident radiation but also the capture of scattered radiation is considered, the regular extinction coefficient K obtained by inverting Beer's law is no longer valid. In such cases, the different terms for the light balance in the canopy must be accounted for:
 |
where I↑ is the upward-scattered light reflected outside the canopy.
Because Iv reflects more directly the canopy geometry than I′v, we chose here to use Kbl to characterize the capture of incident light.
The Kbl value was simulated for a theoretical planophile canopy made up of randomly dispersed leaves and with a leaf size equal to the average leaf size observed before cut-out. This calculation gave a reference value used to analyse the light-capture efficiency of canopies: values of Kbl above this reference, for a given leaf-angle distribution, denote regular leaf disposition enabling the canopy to maximize its light capture. However, it should be noted that (1) this reference did not take account of the light interception by stems and (2) the actual leaf size in young stages was smaller than the average size taken here.
LITERATURE CITED
- Allen MT, Prusinkiewicz P, DeJong TM. Using 1-systems for modeling source sink interactions, architecture and physiology of growing trees: the L-PEACH model. New Phytologist. 2005;166:869–880. doi: 10.1111/j.1469-8137.2005.01348.x. [DOI] [PubMed] [Google Scholar]
- Anderson MC. Stand structure and light penetration. II. A theoretical analysis. Journal of Applied Ecology. 1966;3:41–54. [Google Scholar]
- Anten NP, Hirose T. Limitation onohotosynthesis of competing individuals in stands and the consequences for canopy structure. Oecologia. 2001;129:186–196. doi: 10.1007/s004420100718. [DOI] [PubMed] [Google Scholar]
- Aphalo PJ, Ballaré CL, Scopel A. Plant–plant signalling, the shade-avoidance response and competition. Journal of Experimental Botany. 1999;50:1629–1634. [Google Scholar]
- Ballaré CL. Keeping up with the neighbours: phytochrome sensing and other signalling mechanisms. Trends in plant science. 1999;4:97–102. doi: 10.1016/s1360-1385(99)01383-7. [DOI] [PubMed] [Google Scholar]
- Ballaré CL, Scopel AL, Sanchez RA. Far-red radiation reflected from adjacent leaves: an early signal of competition in plant canopies. Science. 1990;247:329–332. doi: 10.1126/science.247.4940.329. [DOI] [PubMed] [Google Scholar]
- Ballaré CL, Scopel AL, Sanchez RA. Photocontrol of stem elongation in plant neighbourhoods: effects of photon fluence rate under natural conditions of radiation. Plant, Cell and Environment. 1991;20:801–806. [Google Scholar]
- Ballaré CL, Scopel AL, Radosevich SR, Kendrick RE. Phytochrome-mediated phototropism in de-etiolated seedlings. Occurrence and ecological significance. Plant Physiology. 1992;100:170–177. doi: 10.1104/pp.100.1.170. [DOI] [PMC free article] [PubMed] [Google Scholar]
- Ballaré CL, Scopel AL, Sánchez RA. Foraging for light: photosensory ecology and agricultural implications. Plant, Cell and Environment. 1997;20:820–825. [Google Scholar]
- Casal JJ, Smith H. The function, action, and adaptative significance of phytochrome in light-grown plants. Plant, Cell and Environment. 1989;12:855–862. [Google Scholar]
- Casal JJ, Sanchez RA, Deregibus VA. The effect of plant density on tillering: the involvement of R/FR ratio and the proportion of radiation intercepted per plant. Environment and Experimental Botany. 1986;26:365–371. [Google Scholar]
- Charles-Edwards DA, Lawn J. Light interception by grain legume crops. Plant, cell and Environment. 1984;7:247–251. [Google Scholar]
- Chelle M. Phylloclimate or the climate perceived by individual plant organs: what is it? how to model it? what for? New Phytologist. 2005;166:781–790. doi: 10.1111/j.1469-8137.2005.01350.x. [DOI] [PubMed] [Google Scholar]
- Chelle M, Andrieu B. The nested radiosity model for the distribution of light within plant canopies. Ecological Modelling. 1998;111:75–91. [Google Scholar]
- Chenu K, Franck N, Dauzat N, Barczi JF, Rey H, Lecœur J. Integrated responses of rosette organogenesis, morphogenesis and architecture to reduced incident light in Arabidopsis thaliana results in higher efficiency of light interception. Functional Plant Biology. 2005;32:1123–1134. doi: 10.1071/FP05091. [DOI] [PubMed] [Google Scholar]
- Clark B, Bullock S. Shedding light on plant competition: modelling the influence of plant morphology on light capture (and vice versa) Journal of Theoretical Biology. 2007;244:208–217. doi: 10.1016/j.jtbi.2006.07.032. [DOI] [PubMed] [Google Scholar]
- Clouvel P, Lecœur J, Gerardeaux E, Luquet D, Rey H, Martin P. With sub-optimum conditions the current representation of potential crop development patterns needs to be reconsidered. European Journal of Agronomy. 2007 In press. doi: 10·1016/j.eja.2007·08·001. [Google Scholar]
- Dauzat J, Eroy M. Simulating light regime and intercrop yields in coconut based farming system. European Journal of Agronomy. 1997;7:63–74. [Google Scholar]
- Dauzat J, Rapidel B, Berger A. Simulation of leaf transpiration and sap flow in virtual plants: description of the model and application to a coffee plantation in Costa Rica. Agricultural and Forest Meteorology. 2001;109:143–160. [Google Scholar]
- Dauzat J, Franck N, Rapidel B, Luquet D, Vaast P. Simulation of ecophysiological processes on 3D virtual stands with the ARCHIMED simulation platform. Proceedings of PMA06: The Second International Symposium on Plant Growth Modeling, Simulation, Visualization and Applications; November 13–17, 2006; Beijing (CHINA PR): IEEE; 2007. In press. [Google Scholar]
- Den Dulk JA. The interpretation of remote sensing, a feasibility study. Wageningen, The Netherlands: 1989. Thesis. [Google Scholar]
- DeWit CT. Photosynthesis of leaf canopies. Wageningen, The Netherlands: Centre for Agricultural Publications and Documentation; 1965. Agricultural Research Report. [Google Scholar]
- Dogniaux R. Exposition énergétique par ciel serein des parois orientées et inclinées. Données d'application pour la Belgique. Inst. Météo. Belgique. Ed: Misc., Série B. 1973;25 26:86. [Google Scholar]
- Evers JB, Vos J, Fournier C, Andrieu B, Chelle M, Struik PC. Towards a generic architectural model of tillering in Gramineae, as exemplified by spring wheat (Triticum aestivum) New Phytologist. 2005;166:801–812. doi: 10.1111/j.1469-8137.2005.01337.x. [DOI] [PubMed] [Google Scholar]
- Evers JB, Vos J, Chelle M, Andrieu B, Fournier C, Struik P.C. Simulating the effects of localized red:far-red ratio on tillering in spring wheat (Triticum aestivum) using a three-dimensional virtual plant model. New Phytologist. 2007;176:325–336. doi: 10.1111/j.1469-8137.2007.02168.x. [DOI] [PubMed] [Google Scholar]
- Ford ED. Competition and stand structure in some even-aged plant monocultures. The Journal of Ecology. 1975;63:311–333. [Google Scholar]
- Fraser GW, Canham CD, Lertzman KP. Gap Light Analyser (GLA): imaging software to extract canopy structure and gap light indices from true-colour fisheye photographs. New York: Simon Fraser University, Burnaby, British Colombia and the Institute of Ecosystem Studies, Millbrook; 1999. Version 2·0. User manual and program documentation. © 1999 http://www.ecostudies.org/gla/ [Google Scholar]
- Gautier H, Mech R, Prusinkiewicz P, Varlet-Grancher C. 3D architectural modelling of aerial photomorphogenesis in white clover (Trifolium repens L.) using 1-systems. Annals of Botany. 2000;85:359–370. [Google Scholar]
- Godin C, Caraglio Y. A multiscale model of plant topological structures. Journal of Theoretical Biology. 1998;191:1–46. doi: 10.1006/jtbi.1997.0561. [DOI] [PubMed] [Google Scholar]
- Godin C, Costes E, Caraglio Y. Exploring plant topological structure with the AMAPmod software: an outline. Silva Fennica. 1997;31:355–366. [Google Scholar]
- Godin C, Costes E, Sinoquet H. A method for describing plant architecture which integrates topology and geometry. Annals of Botany. 1999;84:343–357. [Google Scholar]
- Goudriaan J. Crop micrimeteorology: a simulation study. Pudoc, The Netherlands: Simulation monographs; 1977. [Google Scholar]
- Herbert TJ. The influence of axial rotation upon interception of solar radiation by plant leaves. Journal of Theoretical Biology. 1983;105:603–618. [Google Scholar]
- Hodges HF, Whisler FD, Bridges SM, Reddy KR, Mckinion JM. Simulation in crop management: GOSSYM/COMAX. In: Peart RM, Curry RB, editors. Agricultural systems modeling and simulation. Gainesville, Florida: M. Dekker; 1998. pp. 235–281. [Google Scholar]
- Holmes MG, Smith H. The function of phytochrome in the natural environment. I. Characterisation of daylight for studies in photomorphogenesis and photoperiodism. Photochemistry and Photobiology. 1977;25:533–538. [Google Scholar]
- Hutchings MJ, DeKroon H. Foraging in plants: the role of morphological plasticity in resource acquisition. Advances in Ecological Research. 1994;25:159–238. [Google Scholar]
- Kasperbauer MJ, Hunt PG. Cotton seedling morphogenetic responses to FR/R ratio reflected from different colored soils and soil covers. Photochemistry and Physiology. 1992;56:579–584. [Google Scholar]
- Kasperbauer MJ, Karlen DL. Light-mediated bioregulation of tillering and photosynthate partitioning in wheat. Physiologia Plantarum. 1986;66:159–163. [Google Scholar]
- Kurepin LV, Emery RJN, Pharis RP, Reid DM. Uncoupling light quality from light irradiance effects in Helianthus annuus shoots: putative roles for plant hormones in leaf and internode growth. Journal of Experimental Botany. 2007;58:2145–2157. doi: 10.1093/jxb/erm068. [DOI] [PubMed] [Google Scholar]
- Lamanda N, Dauzat J, Jourdan C, Martin P, Malézieux E. Using 3D architectural models for investigating smallholder coconut-based agroforestry systems. Agroforestry Systems. 2007;72:63–74. [Google Scholar]
- Lin C. Plant blue-light receptors. Trends in Plant Science. 2000;5:337–342. doi: 10.1016/s1360-1385(00)01687-3. [DOI] [PubMed] [Google Scholar]
- Luquet D, Bégué A, Vidal A, Clouvel P, Dauzat J, Olioso A, Gu XF, Tao Y. Using multidirectional thermography to characterize water status of cotton. Remote Sensing of Environment. 2003;84:411–421. [Google Scholar]
- Monteith JL. Solar radiation and productivity in tropical ecosystems. Journal of Applied Ecology. 1972;9:747–766. [Google Scholar]
- Patterson LL, Buxton DR, Briggs RE. Fruiting in cotton as affected by controlled boll set. Agronomy Journal. 1978;70:118–122. [Google Scholar]
- Reddy KR, Hodges HF, McKinion JM. Modeling temperature effects on cotton internode and leaf growth. Crop Science. 1997;37:503–509. [Google Scholar]
- de Reffye P. Modélisation et simulation de la verse du caféier, à l'aide de la théorie de la résistance des matériaux. Café Cacao Thé. 1976;20:251–271. [Google Scholar]
- Sadras VO, Wilson LJ. Growth analysis of cotton crops infested with spider mites: I. Light interception and radiation-use efficiency. Crop Science. 1997;37:481–491. [Google Scholar]
- Schmitt J. Is photomorphogenic shade avoidance adaptative – perspectives from plant biology. Plant, Cell and Environment. 1997;20:826–830. [Google Scholar]
- Sinoquet H, Rivet P. Measurement and visualization of the architecture of an adult tree based on a three-dimensional digitising device. Trees. 1997;11:265–270. [Google Scholar]
- Smith H, Whitelam GC. The shade avoidance syndrome: multiple responses mediated by multiple phytochromes. Plant, Cell and Environment. 1997;20:840–844. [Google Scholar]
- Solers C, Sillion FX, Blaise F, et al. An efficient instantiation algorithm for simulating radiant energy transfer in plant models. ACM Transactions on Graphics. 2003;22:204–233. [Google Scholar]
- Spitters CJT, Toussaint HA, Goudriaan J. Separating the diffuse and direct component of global radiation and its implication for modelling canopy photosynthesis. Part I. Components of incoming radiation. Agricultural and Forest Meteorology. 1986;38:217–229. [Google Scholar]


