Abstract
Background and Aims
Plant population density (PPD) influences plant growth greatly. Functional–structural plant models such as GREENLAB can be used to simulate plant development and growth and PPD effects on plant functioning and architectural behaviour can be investigated. This study aims to evaluate the ability of GREENLAB to predict maize growth and development at different PPDs.
Methods
Two field experiments were conducted on irrigated fields in the North China Plain with a block design of four replications. Each experiment included three PPDs: 2·8, 5·6 and 11·1 plants m−2. Detailed observations were made on the dimensions and fresh biomass of above-ground plant organs for each phytomer throughout the seasons. Growth stage-specific target files (a description of plant organ weight and dimension according to plant topological structure) were established from the measured data required for GREENLAB parameterization. Parameter optimization was conducted using a generalized least square method for the entire growth cycles for all PPDs and years. Data from in situ plant digitization were used to establish geometrical symbol files for organs that were then applied to translate model output directly into 3-D representation for each time step of the model execution.
Key Results
The analysis indicated that the parameter values of organ sink variation function, and the values of most of the relative sink strength parameters varied little among years and PPDs, but the biomass production parameter, computed plant projection surface and internode relative sink strength varied with PPD. Simulations of maize plant growth based on the fitted parameters were reasonably good as indicated by the linearity and slopes similar to unity for the comparison of simulated and observed values. Based on the parameter values fitted from different PPDs, shoot (including vegetative and reproductive parts of the plant) and cob fresh biomass for other PPDs were simulated. Three-dimensional representation of individual plant and plant stand from the model output with two contrasting PPDs were presented with which the PPD effect on plant growth can be easily recognized.
Conclusions
This study showed that GREENLAB model has the ability to capture plant plasticity induced by PPD. The relatively stable parameter values strengthened the hypothesis that one set of equations can govern dynamic organ growth. With further validation, this model can be used for agronomic applications such as yield optimization.
Key words: Functional–structural plant model, GREENLAB, plant architecture, source–sink relationship, plant population density, maize (Zea mays), model parameterization
INTRODUCTION
Plant population density (PPD) influences plant growth greatly. Therefore, understanding how plants regulate their growth in response to PPD is of importance for a range of problems, such as determination of optimal sowing density and understanding crop-weed competition.
Models have been proved to be very useful tools in testing hypotheses on mechanisms of plant growth, and assessing potential of crop production. Many ecophysiological models have been developed for crop growth simulation (Carberry et al, 1989; Katawatin et al., 1996; Keating et al., 2003). The growth of different types of plant organs can be simulated based on source–sink concept (Marcelis, 1994; Heuvelink, 1996, 1999), and biomass partitioning among the shoot : root compartments can also be quantified (Reynolds and Thornley, 1982; Farrar, 1992). These models do not specify biomass allocation according to topological position of plant organs, and no feedback between plant structure and plant functioning is considered.
Plant architectural models can explicitly simulate changes of plant topology and 3-D geometry of individual organs (Prusinkiewicz et al., 1988; de Reffye et al., 1988; Smith et al., 1992; Sinoquet et al., 1998; Drouet, 2003). The resulting 3-D representation can be used for different applications, such as the simulation of radiative balance within the canopy (Chelle and Andrieu, 1998; Wang et al., 2006), or the simulation of competition between plants for space/resources (Andrieu et al., 2004). However, plant growth without considering biomass acquisition and partitioning within the architecture limits the biological and agronomic usefulness of such models.
Some researchers try to integrate plant architecture and function within the same model to quantify plant growth and development (Kurth and Sloboda, 1997; de Reffye et al., 1997, 1999; Perttunen et al., 1998). Specific functional–structural models, such as ADEL-maize (Fournier and Andrieu, 1999) and GRAAL (Drouet and Pagès, 2003) were developed to simulate individual organ growth of the maize plant. Organ growth was calculated from organ potential growth rate and plant carbon availability. These models can simulate feedback between individual organ growth and plant architecture during the vegetative phase of maize. However, simulation of reproductive growth of the plant is very important because plant yield can be simulated, thus providing guidelines for yield optimization and breeding of high yielding cultivars.
Recently, GREENLAB (Yan et al., 2004), an architectural, mathematical plant growth model was developed. The major feature of this model is to combine plant architecture and biomass partitioning dynamically to mimic plant morphogenesis and its plasticity. The environment defines the carbon supply available to the plant at a given time step. The plant is conceived at organ level (leaves, internodes, fruits, roots, etc.) and thus as a set of sinks competing for assimilates during growth. The optimization technique was used to fit parameter values for a given type of plant. Observed target files with detailed information on plant topology, organ size and weight were required for optimization of parameter values by using the model to track the source and sink dynamic processes of plant growth. The relevance of the model to deal with different species has already been tested on sunflower (Guo et al., 2003), wheat (Zhan et al., 2003), maize (Guo et al., 2006) and chrysanthemum (Kang et al., 2006). The model was recently implemented with a ‘multi-fitting’ technique using several target files to check the inherent stability of parameter values on maize (Ma et al., 2007). However, the ability of the model to deal with plant growth at different PPDs has not been tested yet.
The aim of this study is to assess the overall ability of GREENLAB to simulate the plasticity of maize plant growth at different PPDs. The study focuses on the case of one maize genotype grown over 2 years at three PPDs in each year. The experiments and the theory of the model were described in this paper. Parameter values were fitted by using a multi-fitting technique which permits simultaneous optimization for several target files. A detailed analysis of optimized parameter variability among years and PPDs and simulation of plant growth at other PPDs were also carried out.
MATERIALS AND METHODS
Field experiments and measurement on plants
Two field experiments were conducted on maize in 2005 and 2006 at the Quzhou experiment station (36°52′N, 115°1′E) located in the North China Plain, where the soil is a sandy clay loam.
Maize cultivar ND108 (Zea mays, DEA cultivar) seed was sown in north–south oriented rows with three PPDs. PPD plots were squares with a length of 20 m. Both plant and row space were 0·6 m at low PPD (LD, 2·8 plants m−2). The plant and row spaces were 0·3 m and 0·6 m, respectively, at regular PPD (RD, 5·6 plants m−2). These spacings resulted in a PPD of approx. 56 000 plants ha−1, which is commonly used by local farmers for this genotype. At high PPD, both plant and row spaces were 0·3 m (HD, 11·1 plants m−2). A PPD higher than 11 plants m−2 of this cultivar is of little interest for grain production. On the other hand, tillers may occur when the PPD is lower than 3 plants m−2 (Moulia et al., 1999). Plants emerged on 28 May in 2005 (expt 2005) and 12 May in 2006 (expt 2006). The plants used for measurement were tagged with plastic labels in order to identify the phytomer rank (the rank is counted from the bottom to the top of the plant, the lowest leaf being defined as belonging to phytomer 1). The number of phytomers of this cultivar at maturity ranged from 20 to 22. In the present experiments, several cobs appeared per plant, generally from the 13th to the 15th node. The last and largest cob was usually at the 15th node, contributing >90 % to total cob weight. Water and nutrients were supplied in order to maintain non-limiting conditions. Meteorological data needed to calculate potential evapotranspiration (daily mean, minimum and maximum air temperature, mean relative humidity, wind speed, actual sunshine hours) were acquired from a standard weather station located 10 km from the experimental field.
Nine plants located at the centre of each plot were chosen as reference for selecting the median plants to be dissected (Hillier et al., 2005). Throughout crop development, destructive sampling was done every 2 weeks on individual plants in order to characterize growth and organogenesis. Only above-ground organs were measured. At each date four plants were sampled to measure fresh weight and dimensions of individual organ [i.e. internodes, sheaths, blades, cobs and tassels (Table 3 in Guo et al., 2006)]. Blade area was measured using a LI-COR Model 3100 area meter (Lincoln, NB, USA). These measurements were done on all existing phytomers of the plants sampled.
At grain filling stage, an electromagnetic digitizer (3Space Fastrak Long Ranger; Polhemus, USA) was used to measure the 3-D co-ordinates of organs in situ (Sinoquet et al., 1998) for each treatment with 16 plants. These data were used to establish 3-D symbol files which described the geometrical shape of each organ type (Guo et al., 2006). They were then used to translate model output directly into 3-D representation for each time step.
GREENLAB model description
In previous papers (Guo et al., 2006; Ma et al., 2007), the climate effect on GREENLAB parameter values were studied with constant PPD for all treatments. In this paper, the effect of PPD on the parameter values was analysed. The same mathematical model was used with two new equations (eqns 2 and 3) introduced in this analysis to simulate the plant growth according to PPD. In order to allow this paper to ‘stand alone’ from others, a complete description of the model is given below.
GREENLAB is a functional–structural model that simulates plant development, growth and morphological plasticity. The model simulates individual organ production and expansion as a function of growth cycle (GC), which corresponds to the phyllochron (thermal time between the appearance of two consecutive leaves on the main stem) before the end of plant organogenesis for maize. Thermal time was computed as the accumulated sum of the daily mean air temperature minus a base temperature 8 °C (recommended for maize by Ritchie and NeSmith, 1991). During the plant growth, there were only 2 d on which the daily maximum air temperature was approx. 1 °C beyond maximal temperature for maize [40 °C used in Birch et al. (1998), beyond which development ceases]. Thus, maximal temperature was not considered in this study.
Plant organogenesis was controlled by GC; whereas, plant morphogenesis depends on its biomass production within a given environment and biomass allocation to a given number of expanding organs or competing sinks. Photosynthesis for fresh biomass production per plant is thus simplified according to the following mathematical equation:
 |
1 |
where Q(i) is the fresh biomass production during GC(i). E(i) is the average, potential biomass production during GC(i). In this study, the environment was quantified based on potential evapotranspiration, but it can be made responsive to other environmental variables as needed. n(i) is the number of green leaves presented during GC(i). Sm is the blade surface area of the mth leaf. r and λ are empirical parameters with r setting leaf size effects on transpiration per unit area and λ is analogous to the extinction coefficient of Beer–Lambert's Law. Here λ was set to 0·7 for all PPDs.
The projected surface area of the plants (Sp) can be computed according to PPD as follows:
| 2 |
where SL is the projected surface area corresponding to an isolated plant, a is a transition coefficient and d is number of plants m−2. This empirical formula makes Sp approximate to 1/d when PPD is high, and close to SL when PPD is low. The biomass production m−2 (Qu) is computed as:
 |
3 |
Organs receive an incremental allocation of biomass that is proportional to their relative sink strength. The relative sink strength for each type of organ was defined as a function of its age in terms of GCs:
 |
4 |
where o = indices for organ type (leaf blade, b; sheath, s; internode, e; cob, f; tassel, m). Po is the coefficient of sink strength associated with organs type o. For leaf blade, Pb = 1 is set as a normalized reference. fo(j) is an organ type-specific function of sink variation. A normalization constraint
 |
4A |
is set, with to being the maximum expansion duration for a certain type of organ o that depends on the organ position.
In the course of organ development, it was assumed that its relative sink strength varied according to a beta function fo which formulated as follows:
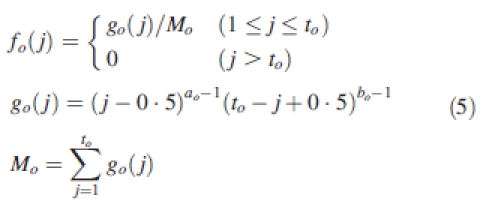 |
5 |
The parameters ao and bo vary with organ type. This function is flexible to describe the shape of the sink variation and can be fitted to data by optimization. Only one parameter (Bo) was optimized to define the beta function for each organ type, and the values of two parameters ao and bo in eqn (5) are subsequently derived from Bo using the constraints ao + bo = 5 and Bo = [ao/(ao + bo)].
At a given GC(i), the biomass increment of an organ aged jth GC is equal to:
 |
6 |
D(i) is the demand of all expanding organs at GC(i):
 |
7 |
Biomass accumulation for the organ is:
 |
8 |
Based on these equations, organ size can be simulated depending on resources and the number and strength of sinks that share these resources at a given time. Parameter optimization of the model uses the generalized least square method described by Zhan et al. (2003) and Guo et al. (2006).
During parameterization, relative sink strength for the first six short internodes Ke was not included because this parameter varied a lot compared with other parameters as described in Ma et al. (2007). Model validations are then conducted by comparing observed and simulated data between different PPDs in different years. The simulation of plant growth is illustrated by comparing the 3-D visualization of individual maize plants and canopies for two PPDs.
Statistical analysis
The ANOVA procedure in MatLab 7·0 was used to test for significant differences between means. Analysis of covariance (ANCOVA) was used to compare slope and intercept of the different linear relationships.
RESULTS AND DISCUSSION
Field observations
Regardless of PPDs and years, the maize variety used in this study produced nearly the same number of phytomers (20–22 at maturity, P > 0·27). There was a linear relationship between thermal time with a base temperature of 8 °C and the number of phytomers produced (Fig. 1). Plant development rate was almost the same at different PPDs (P > 0·29), confirming the stability of the rate of leaf emergence when expressed according to thermal time (Birch et al., 1998). Therefore, the same temperature sum was required for the emergence of a new phytomer.
Fig. 1.
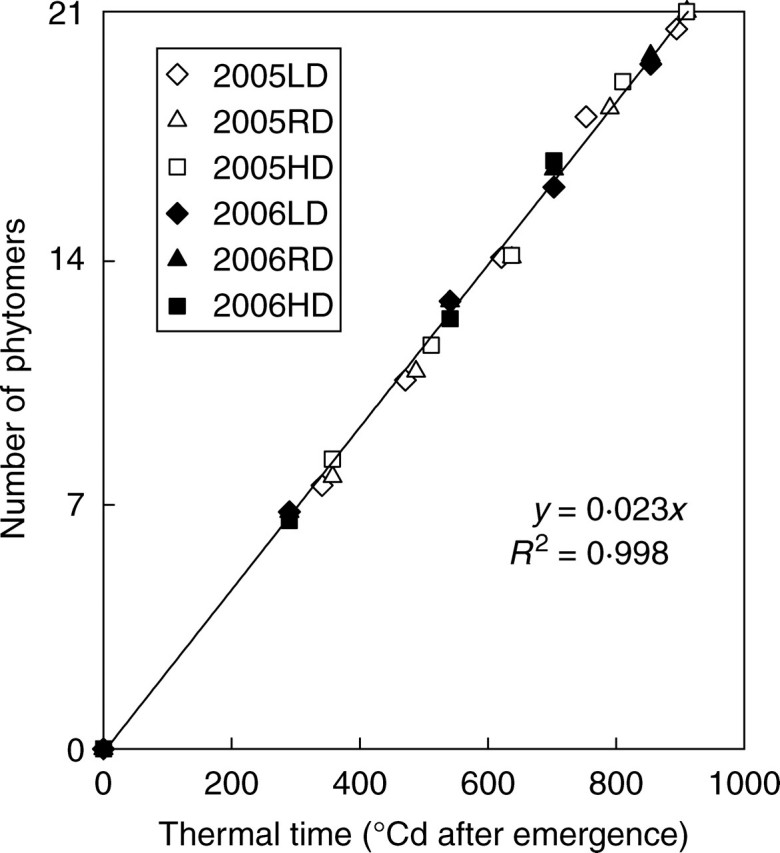
Number of phytomers as a function of thermal time with different plant population densities (LD, low density, RD, regular density, HD, high density) for expt 2005 and expt 2006.
Figure 2 illustrates the fresh biomass development observed at different PPDs. Shoot biomass production which included vegetative and reproductive parts of the plant was continuously increasing, whereas that for vegetative parts (without cobs and tassel) ceased when thermal time is about 1000 °Cd. Individual plant biomass increase over time is affected by PPD, which resulted in a reduction of single plant fresh weight as PPD increases. The same trend in maize was previously observed by several authors (Edmeades and Daynard, 1979; Tetio-Kagho and Gardner, 1988; Pagano and Maddonni, 2007) as well as in other crops (Gorham, 1979; Heuvelink, 1995).
Fig. 2.
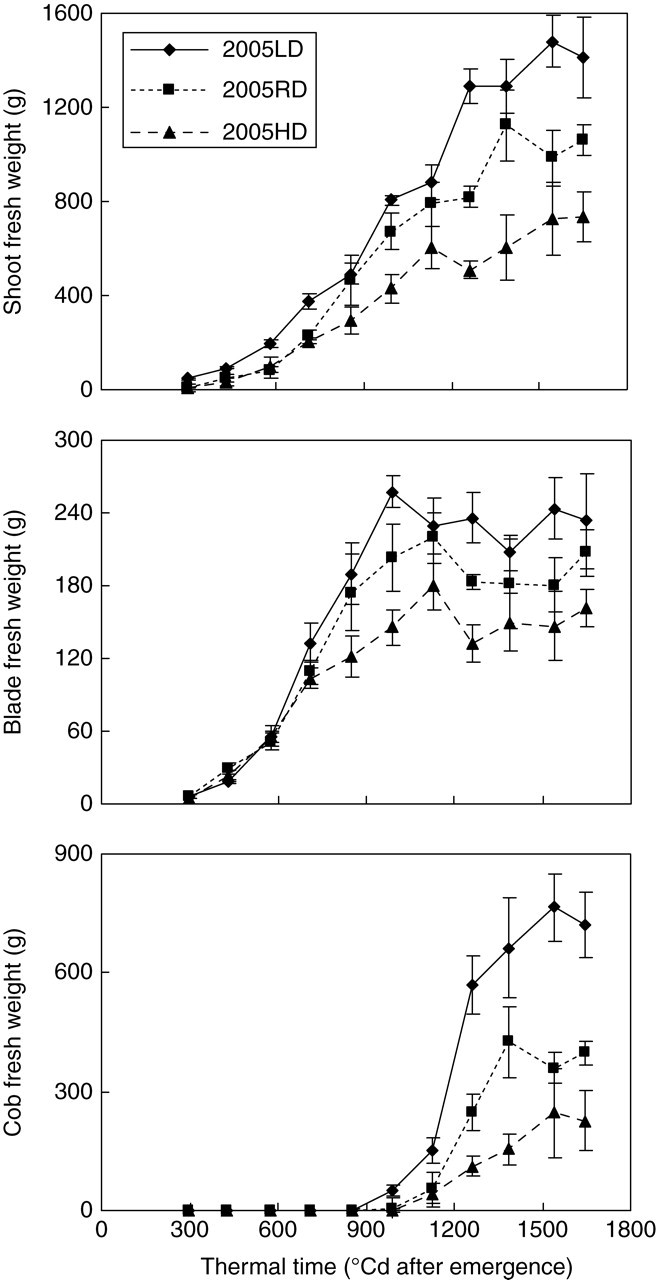
Observed cumulative fresh biomass dynamics of shoot and organ compartments per plant with mean ± s.e. of four replications for low, regular and high population densities (LD, RD and HD, respectively) for expt 2005. Shoot biomass is the sum of vegetative and reproductive part of the plant, and the same below. The trend for expt 2006 was similar (data not shown).
Field measurement and observation also showed that: (a) specific leaf area (SLA) based on biomass decreased with increasing PPD, but was similar for the same PPD between two years; (b) the observed leaf expansion duration (from leaf tip appearance to ligule appearance) increased for the lower leaves and decreased for the upper leaves at high PPD compared with low PPD [this result was consistent with Andrieu et al. (2004) and this variation of blade expansion duration is a major determinant of the response of maize blade length to PPD (Andrieu et al., 2006)]; (c) the average leaf functioning time (from the beginning leaf photosynthesis until 50 % leaf senescence) of the high PPD was 1–2 GC shorter than the regular and low PPDs.
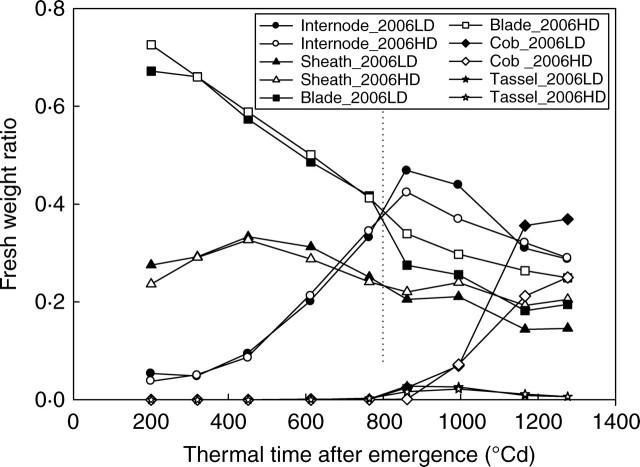
Figure 3 shows changes of fresh weight ratio (ratio of fresh weight for each organ type to total plant shoot weight) at different developmental stages for the low and high PPDs of expt 2006. The general pattern was the same in all treatments. During early vegetative stages, nearly 95 % of the total biomass was allocated to leaves (with 25 % to leaf sheath), internodes taking up the remaining part. The proportion of fresh weight allocated to internodes increased with plant growth. These proportions began to change (at approx. 800 °Cd) as the cob became a major sink.
Fig. 3.
Ratio of fresh weight for each organ type to plant shoot weight (fresh weight ratio) with low and high population densities for expt 2006. A similar trend existed for expt 2005 (data not shown).
Even if the allocation pattern was not modified by changing PPD, considerable change was observed in the time course of partitioning to different plant organs. Before 800 °Cd (the onset of grain filling stage), the ratios of fresh biomass allocated to internode, blade and sheath are nearly the same at high and low PPD plots, indicated by the dotted vertical line in Fig. 3. But after 800 °Cd, these ratios are different due to the increasing effects of inter-plant competition on light capture (Edmeades and Daynard, 1979; Maddonni and Otegui, 2006). The same trend was observed in 2005.
Model parameterization and variation analysis of parameter values
Model parameters were fitted by a multi-fitting technique (Guo et al., 2006) against a series of target files composed of five growth stages (8th, 11th, 18th, 24th and 30th GC) among years and all PPDs. Figure 4 shows multi-fitting results with the regular PPD data from expt 2005. To simplify the simulation, cob biomass was attributed to phytomer 15 only (Guo et al. 2006). The simulated curve for internode length has been extrapolated downwards, although the last two data points (length of 20th and 21st internodes) are not supporting this (Fig. 4A). It should be noted that the simulated curves in this figure were the results of the whole model optimization using the same set of parameters to fit all the target files, and not simply fitting curves to the observed data. Therefore, a certain degree of distortion is inevitable.
Fig. 4.
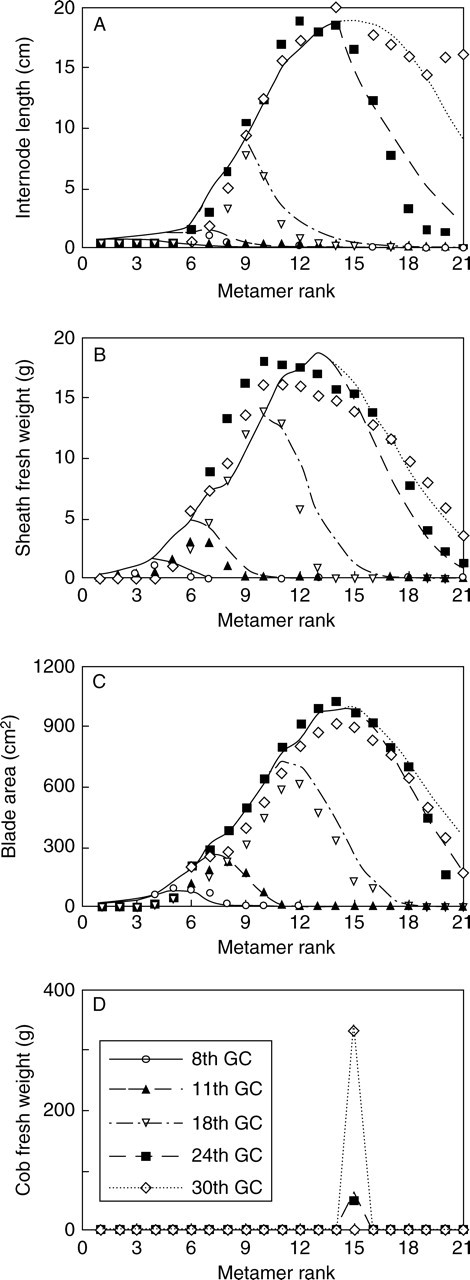
Results of a multi-fitting exercise using data of plants observed at five different developmental stages (8th, 11th, 18th, 24th and 30th growth cycles) from the regular density plot of expt 2005. Cobs were produced on several phytomers but those carried by phytomer 15 was the most productive, contributing >90% to total cob weight. To simplify simulation, cob production is attributed to phytomer 15 only.
Comparisons of parameter values, their respective standard deviation (s.d.) and coefficient of variation (CV) among PPDs and years are presented in Table 1. Seven out of 11 parameters show small variation across different PPDs and years (Pb was set to 1 for all PPDs during the parameter optimization, thus it was not included in Table 1). This involved the parameter Bo and almost all relative sink strength of organs except for internode (Pe) and cob (Pf), for which average values decreased by 22 % and 57 % from low PPD to high PPD, respectively. As the ratio of Pf to the demand of all expanding organs increase dramatically from the early filling stage, and reach 100 % after other organs had fully expanded, the small variation of Pf can be neglected. Parameter r increased with increasing PPD (increased by 26 %), which can be due to the changes of the orientation of leaves that will cause a decrease in transpiration of the plant. Sp decreased by 57 % with increasing PPD. This was reasonable because the leaf projection surface depended on the available surface area per plant. Narrow and short leaves, small plant leaf area and erectophile leaf were always promoted by the increase of PPD (Maddonni et al., 2001), which thus reduced the projected surface area of the plant.
Table 1.
Comparisons of parameter values and coefficient of variation (CV) among PPDs and years
| Parameters | Year |
Population density |
||||||||
|---|---|---|---|---|---|---|---|---|---|---|
| 2005 |
2006 |
Low density |
Regular density |
High density |
||||||
| Mean ± s.d. | CV | Mean ± s.d. | CV | Mean ± s.d. | CV | Mean ± s.d. | CV | Mean ± s.d. | CV | |
| Ps | 0·88 ± 0·02 | 2·3 | 0·87 ± 0·07 | 8·0 | 0·86 ± 0·01 | 1·2 | 0·93 ± 0·03 | 3·2 | 0·85 ± 0·04 | 4·7 |
| Pe | 1·82 ± 0·23 | 12·6** | 1·57 ± 0·21 | 13·4* | 1·94 ± 0·20 | 10·3 | 1·63 ± 0·16 | 9·8 | 1·51 ± 0·17 | 11·3 |
| Pf | 202·90 ± 95·16 | 46·9* | 182·20 ± 77·80 | 42·7** | 290·05 ± 28·14 | 9·7 | 162·18 ± 12·49 | 7·7 | 125·42 ± 3·39 | 2·7 |
| Pm | 1·39 ± 0·13 | 9·4 | 1·23 ± 0·11 | 8·9 | 1·42 ± 0·14 | 9·9 | 1·33 ± 0·09 | 6·8 | 1·19 ± 0·11 | 9·2 |
| Bb | 0·47 ± 0·02 | 4·3 | 0·55 ± 0·02 | 3·6 | 0·51 ± 0·05 | 9·8 | 0·53 ± 0·05 | 9·4 | 0·49 ± 0·05 | 10·2 |
| Bs | 0·70 ± 0·03 | 4·3 | 0·73 ± 0·01 | 1·4 | 0·71 ± 0·04 | 5·6 | 0·70 ± 0·03 | 4·3 | 0·73 ± 0·01 | 1·4 |
| Be | 0·85 ± 0·03 | 3·5 | 0·89 ± 0·02 | 2·2 | 0·86 ± 0·08 | 9·3 | 0·88 ± 0·01 | 1·1 | 0·87 ± 0·02 | 2·3 |
| Bf | 0·59 ± 0·03 | 5·1 | 0·57 ± 0·02 | 3·5 | 0·59 ± 0·03 | 5·1 | 0·58 ± 0·04 | 6·9 | 0·58 ± 0·02 | 3·4 |
| r | 295·82 ± 34·91 | 11·8** | 324·18 ± 35·66 | 11·0** | 275·13 ± 19·26 | 7·0 | 309·36 ± 20·42 | 6·6 | 345·52 ± 20·39 | 5·9 |
| Sp | 0·22 ± 0·09 | 40·9** | 0·24 ± 0·09 | 37·5** | 0·30 ± 0·03 | 10·0 | 0·23 ± 0·02 | 8·7 | 0·13 ± 0·01 | 7·7 |
Po is the coefficient of sink strength and Bo is parameter of the beta function for organ expansion, both associated with organs type o (leaf blade, b; sheath, s; internode, e; cob, f; tassel, m). Parameter r is an empirical parameter, setting leaf size effect on transpiration per unit area. Sp is the projected surface area of the plant.
Note: As Pb was set to 1 for all PPDs, data were not listed here.
** P < 0·01; * P < 0·05; all other values are not significantly different.
Model validation
Simulation of plant growth was carried out for different PPDs and years with corresponding environmental conditions (potential evapotranspiration). The parameter values used for model validation were fitted with data of the regular PPD from expt 2005, but linear fitting was used for the three changing parameters (r, Sp and Pe). Different organ expansion time, leaf functioning time and allometric relationships were used corresponding to PPD.
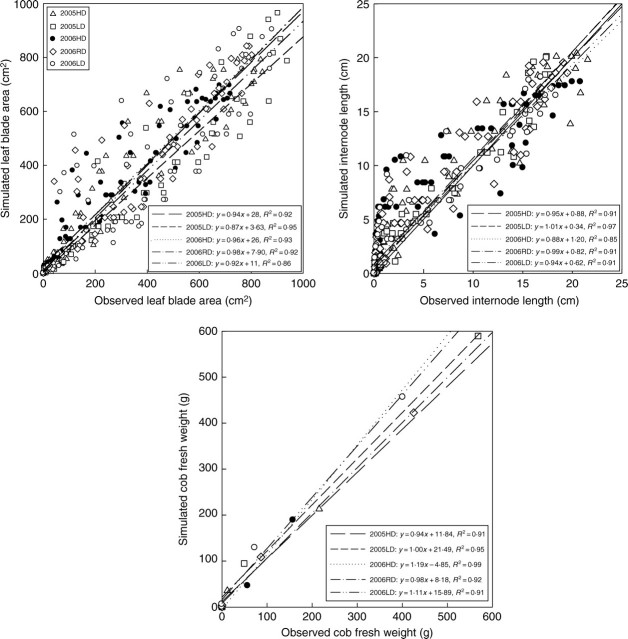
Comparison between simulated and measured organ biomass and dimensions for each phytomer rank were made for model validation. Simulation errors were generally small as indicated by the linearity and slopes similar to unity for the comparison of simulated and observed values (Fig. 5). Significant deviations (P < 0·05) from the simulated versus observed correlations from the 1 : 1 relationship were observed only for internode length in expts 2005LD and 2006HD. This was partly due to the allometric rule which cannot describe the relationship between internode biomass and geometry precisely.
Fig. 5.
Comparison of simulated and observed values of individual leaf blade area, internode length, and cob fresh weight at five developmental stages for expt 2005 and expt 2006 with parameter values fitted from expt 2005.
Optimization of maize stand growth
The relationship between Sp and d fitted from the three PPDs in expt 2005 is shown in Fig. 6A, and these two variables are linked through eqn 2. The fitted values of the projected surface area Sp and the transition coefficient a are 0·4 and 4·31, respectively. From Fig. 6A it can be seen that the plant can be considered as isolated for PPDs lower than 1 plant m−2 as the curve becomes asymptotic when 1/d is close to 1. As there are only three PPDs, extrapolation far from the low and high PPDs was unreliable. However, interpolation between them can be quite relevant.
Fig. 6.
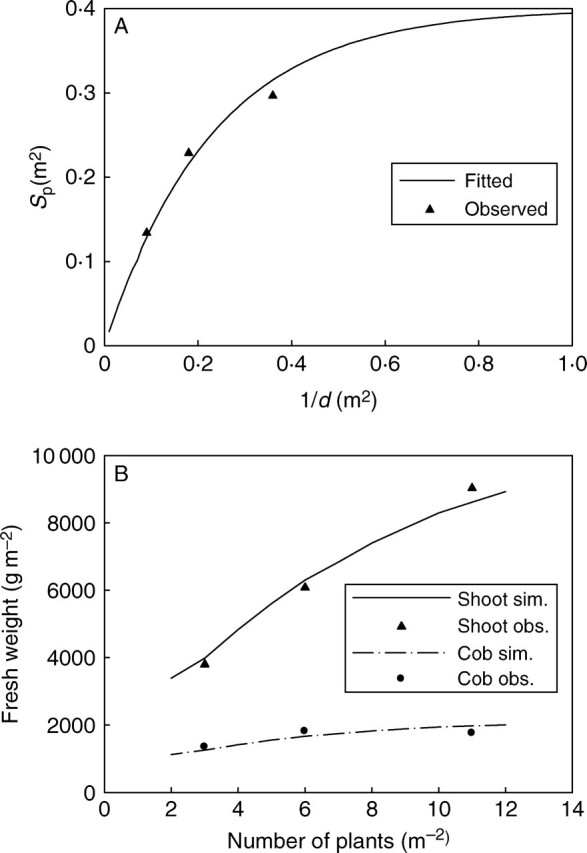
(A) The relationship of the projected surface of the plant (Sp) and population density (d) based on data of expt 2005. The values of parameter Sp were fitted using eqn 2 with generalized least square method. (B) Simulated shoot and cob fresh weight for population densities from 2 to 12 plants m−2 for expt 2006 based on the fitted parameter values of expt 2005.
Based on the parameter values fitted from different PPDs of expt 2005, the shoot and cob biomass growth can be simulated for other PPDs and years. Figure 6B shows the simulated results of shoot and cob fresh weight for PPDs from 2 to 12 plants m−2 in 2006. Results show that there was a large increase in the total biomass production m−2 from 2006LD to 2006HD (116 %), but the increment for the cob was relatively small (57 %).
Three-dimensional visualization of individual maize plant and plant stand
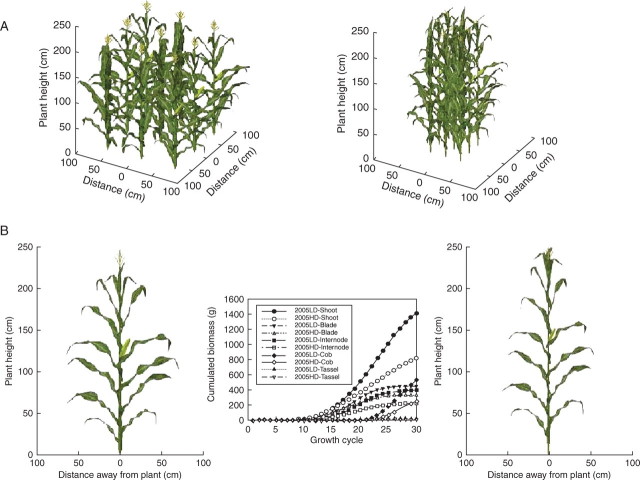
Using fitted parameter values, organ biomass at each growth cycle was computed. Then, organ size was computed with simulated organ fresh weight and corresponding allometric rules. The symbol files were randomly selected from the established database for each phytomer rank to create natural variability of appearance. Azimuthal orientations of plants are randomly distributed within a stand. Figure 7A is the three-dimensional visualization of a maize stand at low and high PPDs from expt 2005. Accordingly, the individual plant for each PPD can be extracted from those simulated stands (Fig. 7B), and the corresponding growth curves are also shown in this figure. From the figure it can be seen that the size of most plant organs was affected by PPD; the differences were particularly visible for leaf size and internode diameter, as well as for plant height and cob size.
Fig. 7.
(A) Three-dimensional visualization of a maize stand at low and high plant population densities from expt 2005. (B) Three-dimensional representation of individual plants for two PPDs from the simulated stand and corresponding growth curves. Left, low population density; right, high population density.
General discussion
GREENLAB is a mathematical and architectural model which uses one common set of parameters governing relative sink strength and expansion kinetics of organs to allocate biomass among individual organs (Yan et al., 2004; Guo et al., 2006), in contrast to non-architectural models that do not consider the demand functions generated by organogenetic processes (Dingkuhn et al., 1991).
This study showed that the GREENLAB model had the ability to capture plant plasticity induced by PPD. The relatively stable parameter values of Po (except for Pe) and Bo strengthened the hypothesis that one set of equations can govern organ growth kinetics of all plant organs throughout different developmental stages. The analysis on variations of Sp, r and Pe showed that their values are PPD-dependent. However, here, only fresh matter was used to analyse the variation of parameter values and simulate the growth of the maize plant. Comparison of parameter values based on fresh and dry weight is in progress.
With regards to agronomic applications emphasizing yield, simulation of maize growth at different PPDs was realised based on the fitted parameters. The results were reasonably good though some differences between simulated and observed data were noted. However, only three PPDs were studied, which maybe not fully represent the changes of parameter values with PPDs. Parameter values corresponding to a broad range of PPDs should be taken into account for further evaluation to the model.
Furthermore, as variations in SLA, time of organ expansion and leaf functioning induced by PPD were forced in this study according to the data observed. Obvious limitations occurred in the current version of GREENLAB which dynamically integrates plant growth response to PPD. Some studies have shown that SLA is affected by a variety of factors, such as light intensity, temperature, source : sink ratio and water status (Heuvelink and Marcelis, 1996; Tardieu et al., 1999; Shipley, 2002). Leaf senescence which determines the leaf functioning time can also be regulated at the whole-plant level by source: sink relationship in the plant (Christensen et al., 1981; Tollenaar and Daynard, 1982; Rajcan and Tollenaar, 1999). Therefore, quantitative relationships of SLA and leaf senescence with plant carbon balance should be established and introduced into GREENLAB in a future version.
CONCLUSIONS
This study aimed at evaluating the ability of GREENLAB, a mathematical and architectural plant growth model, to simulate plant plasticity encountered in a multi-density experiment.
The analysis of parameter values indicated that organ relative sink strength (except for Pe) and their sink variation had small variations among years and PPDs. However, parameters associated with biomass production (r and Sp) varied with PPD. On the basis of the fitted parameter values, plant growth and development was simulated. Comparison of simulated versus observed values was reasonably good as indicated by the linearity and slopes similar to unity. The morphological differences (such as plant height and organ size) between PPD treatments were observed from the simulation results by 3-D visualization of an individual maize plant and plant stand.
Based on the fitted parameter values, shoot and cob weight for other PPDs were also simulated. The results showed that cob production was increased due to PPD increasing under certain conditions. This can be used for optimization of sowing density for obtaining optimal yield. However, more management inputs should be considered, which requires further investigation.
ACKNOWLEDGEMENTS
This study was supported by the Hi-Tech Research and Development (863) program of China (2006AA10Z231), the Program for Changjiang Scholars and Innovative Research Team in the University (IRT0412). We thank Dr Albert Weiss and two anonymous reviewers for their helpful comments on the manuscript. Thanks also go to Dong Li, Bangyou Zheng and Lu Feng for their assistance in field measurements and data processing.
LITERATURE CITED
- Andrieu B, Moulia B, Maddonni G, Birch C, Sonohat G, Sohbi Y, et al. et al. Plasticity of plant architecture in response to density: using maize as a model. In: Godin C, editor. IVth International Workshop on Functional Structural Plant Models (FSMP04); 7–11 June 2004; 2004. pp. 141–145. Montpellier (FRA) [Google Scholar]
- Andrieu B, Hillier J, Birch C. Onset of sheath extension and duration of lamina extension are major determinants of the response of maize lamina length to plant density. Annals of Botany. 2006;98:1005–1016. doi: 10.1093/aob/mcl177. [DOI] [PMC free article] [PubMed] [Google Scholar]
- Birch CJ, Vos J, Kiniry JR, Bosb HJ, Elings A. Phyllochron responds to acclimation to temperature and irradiance in maize. Field Crops Research. 1998;59:187–200. [Google Scholar]
- Carberry PS, Muchow RC, McCown RL. Testing the CERES-Maize simulation model in a semi-arid tropical environment. Field Crops Research. 1989;20:297–302. [Google Scholar]
- Chelle M, Andrieu B. The nested radiosity model for the distribution of light within plant canopies. Ecological Modelling. 1998;111:75–91. [Google Scholar]
- Christensen LE, Below FE, Hageman RH. The effect of ear removal on senescence and metabolism of maize. Plant Physiology. 1981;68:1180–1185. doi: 10.1104/pp.68.5.1180. [DOI] [PMC free article] [PubMed] [Google Scholar]
- Dingkuhn M, Penning de Vries FWTT, DeDatta SK, van Laar HH. Direct seeded flooded rice in the tropics. Los Baños, The Philippines: International Rice Research Institute; 1991. Concepts for a new plant type for direct seeded flooded tropical rice; pp. 17–38. [Google Scholar]
- Drouet JL. MODICA and MODANCA: modelling the three-dimensional shoot structure of graminaceous crops from two methods of plant description. Field Crops Research. 2003;83:215–222. [Google Scholar]
- Drouet JL, Pagès L. GRAAL: a model of growth, architecture and carbon allocation during the vegetative phase of the whole maize plant – model description and parameterization. Ecological Modelling. 2003;165:147–173. [Google Scholar]
- Edmeades GO, Daynard TB. The development of plant-to-plant variability in maize at different planting densities. Canadian Journal of Plant Science. 1979;59:561–576. [Google Scholar]
- Farrar JF. The whole plant: carbon partitioning during development. In: Pollock CJ, Farrar JF, Gordon AJ, editors. Carbon partitioning within and between organisms. Oxford: BIOS Scientific Publishers; 1992. pp. 163–179. [Google Scholar]
- Fournier C, Andrieu B. ADEL-maize: an L-system based model for the integration of growth processes form the organ to the canopy. Application to regulation of morphogenesis by light availability. Agronomie. 1999;19:313–327. [Google Scholar]
- Gorham E. Shoot height, weight and standing crop in relation to density of monospecific stands. Nature. 1979;279:148–150. [Google Scholar]
- Guo Y, de Reffye P, Song YH, Zhan ZG, Dingkuhn M, Li BG. Modeling of biomass acquisition and partitioning in the architecture of sunflower. In: Hu BG, Jaeger M, editors. Proceedings of plant growth modeling and applications. Beijing: Tsinghua University Press/Springer-Verlag; 2003. pp. 271–284. [Google Scholar]
- Guo Y, Ma YT, Zhan ZG, Li BG, Dingkuhn M, Luquet D, de Reffye P. Parameter optimization and field validation of the functional–structural model GREENLAB for maize. Annals of Botany. 2006;97:217–230. doi: 10.1093/aob/mcj033. [DOI] [PMC free article] [PubMed] [Google Scholar]
- Heuvelink E. Effect of plant density on biomass allocation to the fruits in tomato (Lycopersicon esculentum Mill.) Scientia Horticulturae. 1995;64:193–201. [Google Scholar]
- Heuvelink E. Dry matter partitioning in tomato: validation of a dynamic simulation model. Annals of Botany. 1996;77:71–80. [Google Scholar]
- Heuvelink E. Evaluation of a dynamic simulation model for tomato crop growth and development. Annals of Botany. 1999;83:413–422. [Google Scholar]
- Heuvelink E, Marcelis LFM. Influence of assimilate supply on leaf formation in sweet pepper and tomato. Journal of Horticultural Science. 1996;71:405–414. [Google Scholar]
- Hillier J, Makowski D, Andrieu B. Maximum likelihood inference and bootstrap methods for plant organ growth via multi-phase kinetic models and their application to maize. Annals of Botany. 2005;96:137–148. doi: 10.1093/aob/mci159. [DOI] [PMC free article] [PubMed] [Google Scholar]
- Kang MZ, Heuvelink E, de Reffye P. Building virtual chrysanthemum based on sink–source relationships: preliminary results. Acta Horticulturae. 2006;718:129–136. [Google Scholar]
- Katawatin R, Crown PH, Grant RF. Simulation modelling of land suitability evaluation for dry season peanut cropping based on water availability in northeast Thailand: evaluation of the macros crop model. Soil Use and Management. 1996;12:25–32. [Google Scholar]
- Keating BA, Carberry PS, Hammer GL, Probert ME, Robertson MJ, Holzworth D, et al. An overview of APSIM, a model designed for farming systems simulation. European Journal of Agronomy. 2003:267–288. [Google Scholar]
- Kurth W, Sloboda B. Growth grammars simulating trees: an extension of L-systems incorporating local variables and sensitivity. Silva Fennica. 1997;31:285–295. [Google Scholar]
- Ma YT, Li BG, Zhan ZG, Guo Y, Luquet D, de Reffye P, et al. Parameter stability of the functional–structural plant model GREENLAB as affected by variation within populations, among seasons and among growth stages. Annals of Botany. 2007;99:61–73. doi: 10.1093/aob/mcl245. [DOI] [PMC free article] [PubMed] [Google Scholar]
- Maddonni GA, Otegui ME. Intra-specific competition in maize: contribution of extreme plant hierarchies to grain yield, grain yield components and kernel composition. Field Crops Research. 2006;97:155–166. [Google Scholar]
- Maddonni GA, Otegui ME, Cirilo AG. Plant population density, row spacing and hybrid effects on maize canopy architecture and light attenuation. Field Crops Research. 2001;71:183–193. [Google Scholar]
- Marcelis LFM. A simulation model for dry matter partitioning in cucumber. Annals of Botany. 1994;74:43–52. doi: 10.1093/aob/74.1.43. [DOI] [PubMed] [Google Scholar]
- Moulia B, Loup C, Chartier M, Allirand JM, Edelin C. Dynamics of architectural development of maize (Zea mays L.), in a non-limiting environment: the branched potential of modern maize. Annals of Botany. 1999;84:645–656. [Google Scholar]
- Pagano E, Maddonni GA. Intra-specific competition in maize: early established hierarchies differ in plant growth and biomass partitioning to the ear around silking. Field Crops Research. 2007;101:306–320. [Google Scholar]
- Perttunen J, Sievänen R, Nikinmaa EL. LIGNUM: a model combining the structure and the functioning of trees. Ecological Modeling. 1998;108:189–198. [Google Scholar]
- Prusinkiewicz P, Lindenmayer A, Hanan J. Developmental models of herbaceous plants for computer imagery purposes. Computer Graphics. 1988;22:141–150. [Google Scholar]
- Rajcan I, Tollenaar M. Source: sink ratio and leaf senescence in maize. I. Dry matter accumulation and partitioning during grain filling. Field Crops Research. 1999;60:245–253. [Google Scholar]
- de Reffye P, Edelin C, Francon J, Jaeger M, Puech C. Plant models faithful to botanical structure and development. Computer Graphics. 1988;22:151–158. [Google Scholar]
- de Reffye P, Fourcaud T, Blaise F, Barthelemy D, Houllier F. A functional model of tree growth and tree architecture. Silva Fennica. 1997;31:297–311. [Google Scholar]
- de Reffye P, Blaise F, Chemouny S, Jaffuel S, Fourcaud T, Houllier F. Calibration of a hydraulic architecture-based growth model of cotton plants. Agronomie. 1999;19:265–280. [Google Scholar]
- Reynolds JF, Thornley JHM. A shoot : root partitioning model. Annals of Botany. 1982;49:585–597. [Google Scholar]
- Ritchie JT, NeSmith DS. Temperature and crop development. In: Hanks RJ, Ritchie JT, editors. American Society of Agronomy Monograph No. 31. Madison, WI: 1991. pp. 5–29. Modeling plant and soil systems. [Google Scholar]
- Shipley B. Trade-offs between net assimilation rate and specific leaf area in determining relative growth rate: relationship with daily irradiance. Functional Ecology. 2002;16:682–689. [Google Scholar]
- Sinoquet H, Thaniswanyangkura S, Mabrouk H, Kasemsap P. Characterization of the light environment in canopies using 3D digitizing and image processing. Annals of Botany. 1998;82:203–212. [Google Scholar]
- Smith GS, Curtis JP, Edwards CM. A method for analysing plant architecture as it relates to fruit quality using three-dimensional computer graphics. Annals of Botany. 1992;70:265–269. [Google Scholar]
- Tardieu F, Granier C, Muller B. Modelling leaf expansion in a fluctuating environment: are changes in specific leaf area a consequence of changes in expansion rate? New Phytologist. 1999;143:33–43. [Google Scholar]
- Tetio-Kagho F, Gardner FP. Responses of maize to plant population density. II. Reproductive development, yield, and yield adjustments. Agronomy Journal. 1988;80:935–940. [Google Scholar]
- Tollenaar M, Daynard TB. Effect of source : sink ratio on dry matter accumulation and leaf senescence of maize. Canadian Journal of Plant Science. 1982;62:855–860. [Google Scholar]
- Wang XP, Guo Y, Li BG, Wang XY, Ma YT. Evaluating a three dimensional model of diffuse photosynthetically active radiation in maize canopies. International Journal of Biometeorology. 2006;50:349–357. doi: 10.1007/s00484-006-0032-0. [DOI] [PubMed] [Google Scholar]
- Yan HP, Kang MZ, de Reffye P, Dingkuhn M. A dynamic, architectural plant model simulating resource-dependent growth. Annals of Botany. 2004;93:591–602. doi: 10.1093/aob/mch078. [DOI] [PMC free article] [PubMed] [Google Scholar]
- Zhan ZG, de Reffye P, Houllier F, Hu BG. Fitting a functional–structural growth model with plant architectural data. In: Hu BG, Jaeger M, editors. Plant growth modeling and applications. Beijing: Tsinghua University Press/Springer-Verlag; 2003. pp. 236–249. [Google Scholar]


