

Abstract
Background and aims
During the development of multicellular organisms, cells are capable of interacting with each other through a range of biological and physical mechanisms. A description of these networks of cell–cell interactions is essential for an understanding of how cellular activity is co-ordinated in regionalized functional entities such as tissues or organs. The difficulty of experimenting on living tissues has been a major limitation to describing such systems, and computer modelling appears particularly helpful to characterize the behaviour of multicellular systems. The experimental difficulties inherent to the multitude of parallel interactions that underlie cellular morphogenesis have led to the need for computer models.
Methods
A new generic model of plant cellular morphogenesis is described that expresses interactions amongst cellular entities explicitly: the plant is described as a multi-scale structure, and interactions between distinct entities is established through a topological neighbourhood. Tissues are represented as 2D biphasic systems where the cell wall responds to turgor pressure through a viscous yielding of the cell wall.
Key Results
This principle was used in the development of the CellModeller software, a generic tool dedicated to the analysis and modelling of plant morphogenesis. The system was applied to three contrasting study cases illustrating genetic, hormonal and mechanical factors involved in plant morphogenesis.
Conclusions
Plant morphogenesis is fundamentally a cellular process and the CellModeller software, through its underlying generic model, provides an advanced research tool to analyse coupled physical and biological morphogenetic mechanisms.
Key words: Pattern formation, dynamic model, CellModeller, multicellular systems, morphogenesis, cell–cell interaction
INTRODUCTION
In most living organisms, the cell constitutes the elementary structural and functional unit of life. Cells are capable of synthesizing new proteins, thereby maintaining a large variety of specific cellular activities which in turn encode complex developmental processes. Though plant organisms are complex, the position and shapes of cells, tissues, meristems and organs bear repeated and regular relationships with one another. The spatial organization and regularity of patterns are apparent not only at a macroscopic level, but also in meristems and tissues, which contain repeated and predictable arrangements of cells of various types.
Patterning in plants is highly organized and the mechanisms of interaction and communication between cells are central to an understanding how cell activity is co-ordinated during development. Primitive modes of chemical interaction appear in bacterial quorum sensing, e.g. where the density-dependent bioluminescence of Vibro fischeri colonies is triggered by the perception of the AHL signalling molecules (Waters and Bassler, 2005). In higher plants, such mechanisms have evolved and morphogenesis is characterized by a large range of cell–cell signalling mechanisms. Diffusion of activating/inhibiting proteins is thought to be involved in the patterning of trichome differentiation (Glover, 2000; Schellmann and Hulskamp, 2005) and active polar transport of hormones is involved in the canalization and maintenance of growth in meristems (Benkova et al., 2003; Friml, 2003; Scarpella et al., 2006). These elaborate and co-ordinated behaviours underline the importance of studying intercellular communication and its role in the spatial and temporal co-ordination of cellular processes within plants.
Molecular genetics has provided great insight into the understanding of the nature of genetic interactions and their role in regulating cell development. However, genetic analysis is time consuming when the number of regulatory factors is large, and the use of computational techniques is becoming increasingly important for the identification of regulatory networks. Pioneering work by Turing (1952), further developed by Meinhardt (1994), has set a theoretical framework for pattern formation in biology. Since then, the use of computational methods for analysing development has grown considerably: image-analysis tools are being used to process microscopy images and quantify deformation in tissues (Dumais and Kwiatowaska, 2001; Barbier de Reuille et al., 2005; Bengough et al., 2006; Lee et al., 2006); reaction diffusion models have been used to describe the co-ordination of cell behaviour (Furusawa and Kaneko, 2003; Jönsson et al., 2006a); genetic regulatory networks have been used to model differentiation in the floral meristem (Espinosa-Soto et al., 2004); and feedback-regulated models for polar flux of auxin introduced by Mitchison (1980) have been used to predict canalization in vascular tissues (Feugier et al., 2005; Rolland-Lagan and Prusinkiewicz, 2005).
However, the computation of multicellular systems remains challenging in various aspects. The spatial and time scales involved in the biological processes are wide ranging from molecular to organismal phenomena. Modelling studies and biological data that remain have not been integrated into life-like multicellular plant systems. This study presents a new general model of cellular morphogenesis, based on a multi-scale description of cell architectures and molecular interactions. The model has been implemented in CellModeller, a system dedicated to multicellular computations. Three examples are developed to illustrate genetical, hormonal and mechanical patterning mechanisms.
GENERAL MORPHOGENETIC MODEL
Multi-scale spatial structure
Botanists have long recognized that plants are organized into units of various types and sizes, e.g. cells, tissues, organs, where mutual interactions explain a multitude of regulatory mechanisms (Sachs, 1991). Describing the architecture of relationships amongst the plant constituents is a crucial step prior to modelling interactions within those units. This can be formalized by defining the plant as a set of scales of description s ≤ S, where each entity within a given scale of description is of the same type (represented in parallel plane in Fig. 1). For example, walls are the entities described at scale 1 characterized by their properties (Wi), cells are objects described at scale 2 characterized by (Ci), and tissues are described at scale 3 characterized by (TIi).
Fig. 1.

(A) Plant cellular architecture can be broken down into entities at different scales, represented here on horizontal planes to describe plant structure and functioning. (B) The entities in each level of description establish interactions with other plant constituents, and it is possible to determine a topological neighbourhood for any entity: a cell is related to its neighbours according to h, but also within the organ it belongs to via v+ and the walls that define its boundaries via v−. (C) The evolution of such properties is relevant to autonomous processes, e.g. f21 function in cell X21, but is also due to interactions between entities in the topological neighbourhood, e.g. via f3+, f1– and f22 functions. (D) Changes in the network of interactions are due to growth mechanisms and can be broken down into birth and death operators: the division of the cell X21 results from the deletion of four walls, i.e. X11, Xh11, X51, Xh51, and the creation of ten new walls (eight subdivision from previous walls plus the two new walls separating the newly created cell). Entities associated with new walls are then defined through the inheritance function g1 and those associated with the two daughter cells through g2.
Because entities at different scales of description encapsulate different representations of the same plant, hierarchical relationships can be defined between these different structural entities: cells are made of walls, tissues are made of cells, etc. … These relationships are defined through incident or ‘vertical’ functions (Fig. 1A), denoted v− and v+, which describe the hierarchy of entities at different scales of description. The function v− assigns to a given entity of level s, e.g. an epidermal cell, the set of incident entities at level s − 1, e.g. the set of walls that define the cell boundaries. v+ is the function which assigns a given entity at scale s, the entity to which it belongs to at scale s + 1, e.g. the epidermis. For example, the set of walls that constitutes the boundaries of the ith cell can be written as Wv−i.
Certain factors that regulate cell behaviour in plants can be transported from cell to cell, e.g. hormones, transcription factors and secreted peptides. These signalling processes play an important role in the co-ordination of plant cell development and provide key positional information determining cell patterning and differentiation. Therefore, interactions between units of the same level need to be defined in order to complement the previous topological structure. Neighbouring relationships will be referred to as ‘horizontal’ in contrast to the previous definitions. The partition between two cells is double-walled, with each cell's wall having an independent composition, architecture and properties. Whi is therefore the neighbouring wall in contact with the ith wall. The neighbouring function can then be extended to higher levels of description by recurrence.
Dynamics of cellular properties
The previous section described a static network of connections (v+, v−, h) between a set of independent cellular objects characterized by their biological/physical properties, e.g. turgor pressure, concentration of transcription factors in a cell. However, plant functioning is highly dynamic, and even stationary patterns may result from motion and interaction of signalling molecules within the organism (Meinhardt, 1994).
Therefore, in this section, the dynamics of the cellular properties, e.g. Wi and Ci, are defined within the architecture of cells. The evolution of such variables with time cannot be encapsulated in isolated autonomous factors, but is influenced by the properties of other plant constituents. In real plant systems, processes of interaction such as diffusion of morphogens between adjacent cells/tissues, result from the proximity of cellular entities and can be expressed in models via a topological ‘neighbourhood’ defined by the functions v+, v−, h (Fig. 1C). For 1 < s < S, one such model may be defined as:
| 1 |
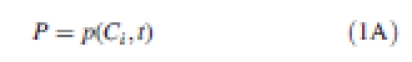
The first component P of the right-hand side is the cell internal production term:
 |
1A |
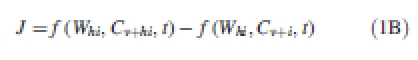
P expresses the rate of synthesis of the molecules at a cell level and the function p may encode complex gene regulatory networks and other biochemical dynamics. The second term J denotes the horizontal interactions between entities of the same types, e.g. transport of molecules between cells. The net influx J entering a particular entity can be broken down into individual contributions at each interface between elements i and hi at scale s − 1:
 |
1B |
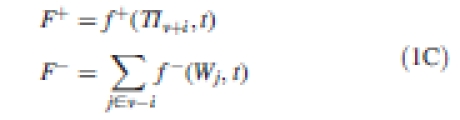
The flux from i to hi is therefore opposite to from hi to i, which is coherent with the conservation of quantities within the whole system. f may express simple diffusion, in which case f is expressed as D. Cv+i, or other types of molecular transport (Vieten et al., 2007). F+ represents the influence of processes from scale s + 1 and F− the integrated influence of entities at a lower scale:
 |
1C |
Similar equations can be written for each entity of the system. When s = 1, there is no influence from the lower scale and both J and F− are set to 0. Similarly when s = S, no influence from the higher scale is defined and F+ is set to 0.
Architectural dynamics
The changes induced by growth and cell proliferation mechanisms to the architecture of plant components must be considered. The dynamic systems outlined in the previous section described the evolution of the cellular properties in a fixed layout of cells which is equivalent to cellular development in the absence of cell proliferation.
Any change in the architecture of the system, inherent to events such as cell division or cell death, can be expressed as a combination of elementary creation and deletion operators at different scales of description. The deletion of an entity from the plant structure implies only the suppression of connections within the topology. Creation of an entity requires additionally the initiation of the new object properties Cd (Fig. 1D). At the time of creation, this will be defined through the inheritance function g so that:
 |
2 |
g may encode important biological concepts such as asymmetric division, lineage and other mitotic events. For example, the partitioning of a single cell C1 into two equal daughter cells Cd1 and Cd2 can be modelled by a simple g function: Cd1 = Cd2 = C1/2. After such an event, continuous dynamics resume with a new set of initial conditions and connectivity.
Biomechanics of growth
Plant cell expansion is generally believed to result from the yielding of cell walls maintained under tension by turgor pressure, and both of these factors are ultimately controlled by the plant genetic activity (Fig. 2). Experimental evidence from observations of the ultrastructure of cell walls (Taiz, 1984) and from observed expansion rates after imposition of shifts in turgor (Green et al., 1971) favours inelastic models for wall expansion. Here a quantitative model for cell wall physics has been incorporated by adopting a pure viscous model to relate turgor pressure to cell wall properties. A simple viscous model has the advantage of being described by a single parameter, the viscosity coefficient, which has a strong physical meaning and can be easily estimated from experimental work. A finite element beam model (Euler Bernoulli assumptions) has been adopted. At each increment in time, a forward-Euler finite difference scheme was applied to derive nodal displacement. The forces present within cell walls are determined a posteriori from nodal displacements using the viscous strain/stress relationships. A fuller description of the biomechanical model can be found in a previous publication (Dupuy et al., 2006).
Fig. 2.
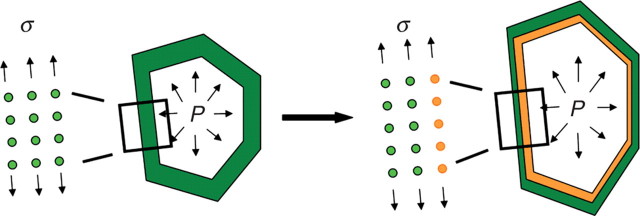
Biomechanical model for cell expansion in morphogenesis: cell wall response to turgor pressure through a viscous yielding of the cell wall, compensated at the same time by thickening to maintain a constant cross-section.
CellModeller, modelling system for multicellular computation
CellModeller, software environment for 2D multicellular computations, has been developed. The system was developed in C++ and is based on a hierarchical data structure representing the network of interactions described in previous sections. Plant object classes contain the cellular properties, such as spatial co-ordinates for the vertex class, and also corresponding references to other entities that build up the topology of the system, i.e. functions v+, v− and h. Member functions provide elementary geometrical tools (areas, normal vectors, axes of inertia), topological operators triggering architectural events (divide, ablate, neighbouring), and also built-in models (mechanical model, diffusion of morphogens).
The dynamic system presented in eqn (1) brakes down the interactions between plant entities as a linear combination of terms from entities at different scales, i.e. F−, P + J and, respectively, F+. This decomposition is convenient from a computational point of view, because the evolution functions fs in eqn (1) can be constructed iteratively by running through all the plant compartments once in a time step. In CellModeller, such evolution functions can be coded in scripts specific to a scale of description and operating on the C++ data structure. Two types of scripts (Fig. 3) are associated at each level of description. ‘Regular’ scripts are called at each time step of the simulation and encode user-defined evolution functions p, f, but can also trigger topological changes by making use of divide or ablate functions (Fig. 2). ‘Init’ scripts are called when a new object is created, e.g. functions g in eqn (2), to specify inheritance rules.
Fig. 3.
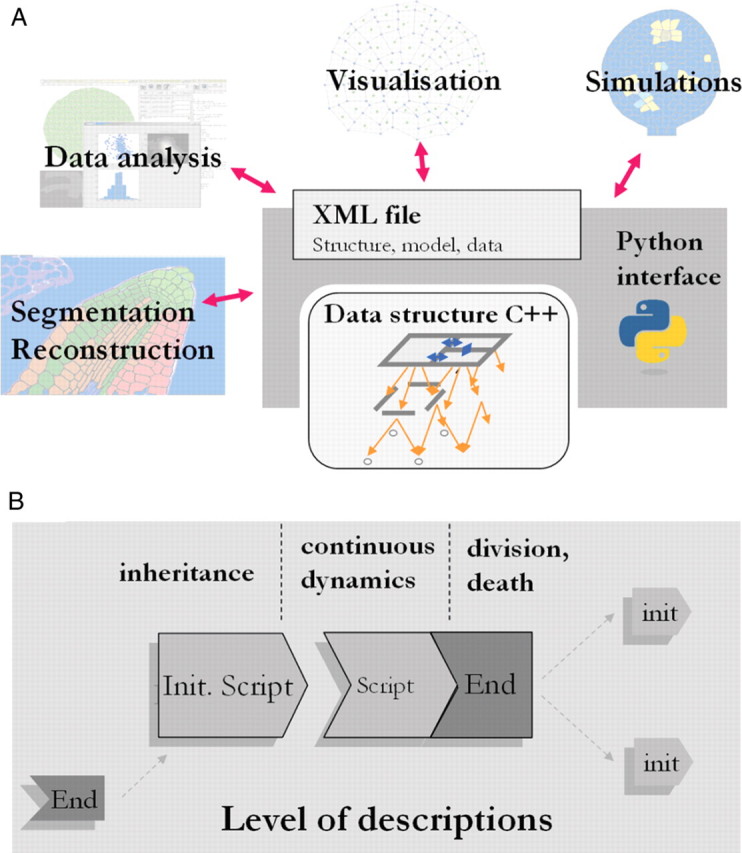
(A) In the CellModeller software, a C++ chained data structure was developed in order to define explicitly the topological neighbourhood of any entity. This data structure is wrapped in a Python interface and can be used for various types of applications (extraction and reconstruction of real cellular architectures, statistical analyses, visualization and simulations). (B) Models can therefore be programmed by an association of self-contained scripts, operating on a type of entity and containing a description of both autonomous processes and interactions within the architecture. For any level of description, one script is used to define inheritance rules (function gs), and the second script encodes the continuous dynamics of attributes (function fs). The latter script also controls proliferation rules (division and death) and triggers architectural changes in the system.
Scripts consist of user-defined functions that operate on the C++ cellular objects through a python interface. This architecture gives the users control of the topological data structure and, at the same time, provides a powerful and user friendly scripting language for designing models and extending the functions of CellModeller. CellModeller can also be used for the extraction and reconstruction of real cellular architectures by image analysis, for carrying out statistical analysis on cell architectures, and for visualization. More information can be found on the web site http://www.plantsci.cam.ac.uk/Haseloff/CellModeller2/index.html.
APPLICATION TO THREE STUDY SYSTEMS
In this section, the concepts developed previously are applied to three different types of patterning mechanisms, namely genetic regulation, hormonal signalling and mechanical interactions. These applications involve three levels of plant description: the wall level W, the cell level C, and the tissue level TI, for which the indexing of their respective entities will be omitted to simplify the notations.
Case 1: genetic regulation in the trichome patterning system
During leaf development, the differentiation of epidermal cells into trichomes (leaf hairs) occurs in precise patterns and frequencies. Recent work on the arabidopsis trichome system has identified the role of various genes involved in the regulation of trichome patterning (Schellmann and Hulskamp, 2005). GL1 (GLABRA1) and TTG1 (TRANSPARENT TESTA GLABRA1) are two transcription factors required for the formation of trichomes. GL3 is a positive regulator of trichome fate which associates with GL1 and TTG1 to form a complex that activates genes associated with trichome fate (Pesch and Hulskamp, 2004) which is reduced here to the single GL2 gene. The lateral movement of inhibitors regulates the activity of this complex. In non-trichome cells, the inhibiting proteins TRY (TRIPTYCHON) and CPC (CAPRICE) compete with GL1 and an inactive complex is formed (TRY or CPC/GL3/TTG1) (Schellmann et al., 2002).
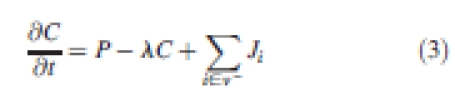
In this example, a simplified plausible regulatory network has been studied (Fig. 4), representing interactions between these regulatory genes. The evolution of the concentration of the different gene products (CGL3, CTRY, CCPC, CGL2) is defined by classical rate equations (Jönsson et al., 2006a; Smith et al., 2006), driven by an internal production rate, a degradation coefficient and an influx term:
 |
3 |
Fig. 4.
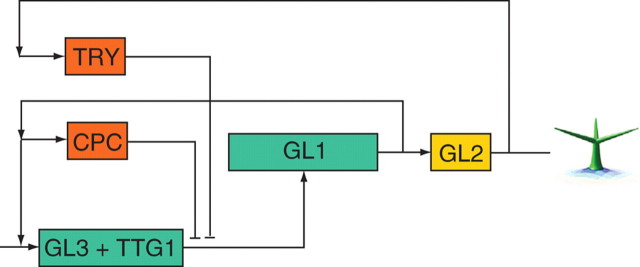
The generation of the spacing patterns of trichomes in arabidopsis, results from a group of activators (in green) and inhibitors (in red). GL3 is a positive regulator of trichomes which associate with GL1 and TTG1 to form a complex that activates the trichome developmental genes which are reduced here to the single GL2 gene. In trichome cells, levels of the inhibitors increase and diffuse into neighbouring cells, where they block the activity of the activating complex, and in turn the trichome fate.
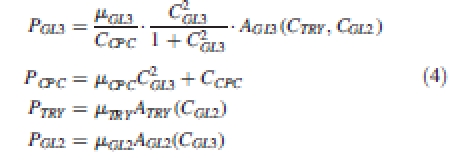
P is the production rate, λ the decay constant and these first two terms constitute the net production term defined in eqn (1). Ji is the net influx from wall i and encodes the f function as seen in eqn (1). The production terms of the different gene products encapsulate the interactions between the different genes shown in Fig. 4 as follows:
 |
4 |
In this reduced genetic regulatory network, GL1 and TTG1 are always present and no rate equation is defined: the concentration of GL3 in the cell determines directly the formation of the positive-reinforcing complex GL1/TTG1/GL3 which in turn activates GL2. The regulation of GL3 is the result of the interactions between TRY and CPC. GL3 and CPC are the classical activator inhibitor couple defined by Meinhardt (1994; its application to the trichome patterning system was also carried out by Benitez et al., 2007) and these act upstream of GL2. The second inhibitor TRY is activated downstream of GL2, as indicated in experimental studies (Srinivas, 2004). Once a trichome is initiated in a cell, it represses trichome formation in neighbouring cells.
Activation of genes is expressed through a combination of elementary sigmoid threshold functions:
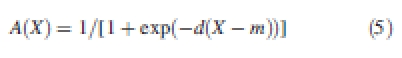 |
5 |
where m indicates the level of input under which the entity is not active, and d denotes the sharpness of the transition (d is given a large value to obtain clear on/off activation states). The activation function AGL3 encodes the inhibition of TRY on GL3 and the irreversibility of the trichome developmental process (repression is inefficient if GL2 has been activated). In this case, the activation function equals A = 1 − Ai(X)Aj(−Y) (see Table 1 for the parameter values).
Table 1.
Parameters of the model for the trichome patterning system
| μ | c | λ | D | mi (*) | mj (*) | |
|---|---|---|---|---|---|---|
| GL3 | 0·04 | – | 0·3 | 0·035 | 0·05 | −0·5 |
| CPC | 0·20 | 0·01 | 0·6 | 0·60 | – | – |
| TRY | 2 | – | 1·3 | 0·60 | 0·5 | – |
| GL2 | 1 | – | 0·01 | 0·00 | 0·5 | – |
Gene product can diffuse between cells. The net influx J going through the wall i of length l with a diffusion coefficient D therefore equals
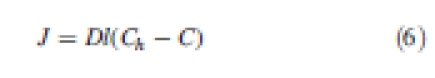 |
6 |
Initial conditions for the simulations consisted of three cells immobilized and three active cells on the top of them, where the genetic script operates. Cells are initiated with a small amount of GL1 (random uniform distribution [0, 0·05]). A degree of noise was introduced at division to prevent identical neighbour cells. Focusing on the adaxial surface of the leaf, a plane layout of cells was represented. Trichome formation is inhibited on edge cells in order to avoid modelling the remaining epidermal cells.
The execution of this model reproduced the expected patterns of gene expression seen during trichome development (Fig. 5). When GL3 in the cell increases significantly by depletion of CPC inhibitor, GL2 is expressed and a trichome is initiated. TRY and CPC are both generated at the site of trichome development and diffuse to inhibit laterally the emergence of new trichomes in the neighbourhood. Most importantly, this model could be mutated and the phenotypes of virtual mutants analysed (Fig. 6). The cpc mutant showed an increase in trichome density as observed experimentally (Schellmann et al., 2002). The try virtual mutants had clusters of trichomes. Real try phenotypes also generate clusters of trichomes (Schnittger et al., 1998), although generally made of two cells in real mutants (Schellmann et al., 2002). GL3 overexpression increased trichome density as observed experimentally (Payne et al., 2000).
Fig. 5.

Patterns of gene expression obtained from the genetic regulatory network described in Fig. 4: (A) concentration of the GL1/TTG/GL3 complex; (B) concentration of TRY; (C) concentration of CPC; (D) concentration of GL2 in the cells (see Supplementary Information Video ‘Trichome-1’ available online).
Fig. 6.

The modelled genetic regulatory network described in Fig. 3 can be mutated by preventing expression of particular genes or by imposing a constant rate of synthesis in a particular gene product. Phenotypes of such mutated regulatory networks exhibited similar properties as real mutant as seen in the distribution of the GL1/TTG/GL3 complex: the wild-type phenotype showed sparse distribution in initiation sites (A), the CPC mutant phenotype had a higher density of trichome cells (B), the TRY mutant phenotype exhibited clusters of trichome (C) and gl3 overexpression increased the density of trichomes (D) (see Supplementary Information Video ‘Trichome-2’ available online).
The system constituted up to 300 cells and 1600 walls. Computational time was 6 min (on a Pentium M processor 2·00 GHz, 1 GB of RAM) using built-in mechanical and diffusion modes for 4000 time increments.
Case 2: hormonal control of primordium localization
The emergence of new organs in plants may be initiated by localized concentrations of hormones, which trigger differential growth and cell fate. In the shoot apical meristem of arabidopsis, carrier molecules AUX1 and PIN1 are thought to direct the flux of auxin and control the positioning of new primordia. The AUX1 influx carrier distributed on the cell wall membranes of the surface layer of the meristem, act to concentrate auxin in the surface layer (Reinhardt et al., 2003). The distribution of PIN1 is polarized and directs the flux of auxin towards peaks of concentration, where auxin accumulates and new primordia emerge (Heisler et al., 2005). In interior cells, PIN1 is generally oriented inward and acts to transport auxin towards deeper vascular tissues (Benkova et al., 2003).
This ‘reverse fountain’ circulation of auxin has been investigated (Fleming, 2006; Swarup and Bennet, 2006), based on elementary active transport mechanisms. In this model, the production of each cell constituent, e.g. PIAA (auxin), PAUX1, PPIN1_L1 (PIN1 in L1 layer) and PPIN1_V (PIN1 in deeper tissues), is independent of the others:
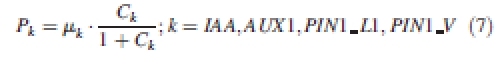 |
7 |
The production terms are independent of each other and regulate the production of auxin and auxin transporters uniformly in all cells throughout the system. (Table 2) The dynamic allocation of carrier molecules PIN1 and AUX1 is defined in additional rate equations attached to wall entities:
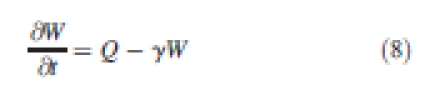 |
8 |
Table 2.
Parameters of the model of polar auxin transport and allocation of the AUX/PIN molecules
| μ | λ | ν | γ | D | T | m | |
|---|---|---|---|---|---|---|---|
| IAA | 0·5 | 0·2 | – | – | 1 | 1 | 0·4 |
| AUX1 | 0·8 | 0·2 | 10 | 0·1 | 0·5 | 5 | – |
| PIN1_L1 | 0·1 | 0·2 | 10 | 0·1 | 0·3 | 2·5 | – |
| PIN1_V | 0·4 | 0·2 | 10 | 0·1 | 0 | 2·5 | – |
| Viscosity | – | – | – | – | – | – | −0·4 |
γ denotes the decay constant on the cell wall. Q is the rate of allocation of molecules on cell membranes, which decompose as for each wall of the system:
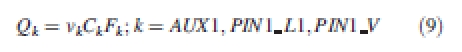 |
9 |
F encodes the different feedbacks that reinforce the patterns of carrier protein localization on cell membranes (Fig. 7). For AUX1 transport, the auxin concentration in the cell, noted IAA for simplicity, regulates the localization of the carrier: FAUX = IAA. There are tissue-specific features in PIN1 auxin transport patterns as described by Reinhardt et al. (2003) and Vieten et al. (2007). The canalization of fluxes (Sachs, 1991) in sub-epidermal layers of cells does not seem to respond to the same feedback rules as those observed in epidermal cells driving fluxes to converge towards leaf primordia. To date there are no molecular models or data explaining this behaviour. Therefore it was assumed for simplicity that the model of PIN1 allocation is tissue specific. The allocation of the PIN1 carrier in the L1 layer is reinforced by the concentration in the neighbouring cell FPIN_L1 = IAAh (Barbier de Reuille et al., 2006; Jönsson et al., 2006b). The localization of PIN1 in deeper tissues is reinforced by a positive feedback with auxin flux: FPIN_V = JIAA. Readers may refer to Feugier et al. (2005) or Rolland-Lagan et al. (2005) for a more complete overview of auxin canalization models.
Fig. 7.
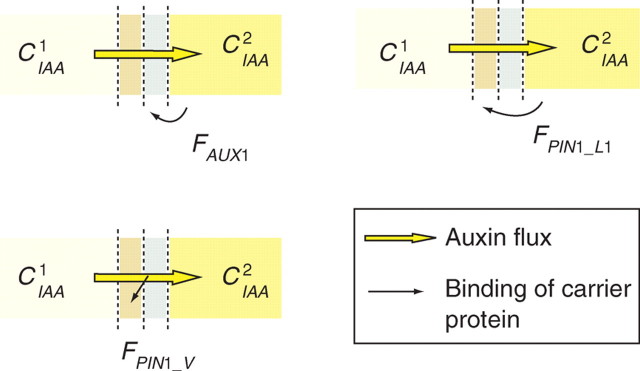
In the primordia, influx and efflux carriers are thought to direct auxin flows and maintain regions of higher concentrations. The localization of the carrier molecules that maintain such patterns are inherent to feedbacks with the levels of auxin concentration and fluxes in cells. In AUX1 transport, the feedback F is inherent to the concentration of auxin in the cell. In PIN1 in the L1 layer, the rate of allocation is positively correlated with the concentration of auxin in the neighbouring cell. The canalization of the flux of auxin by PIN1 deeper in the tissue is induced by the flux of auxin through the cell wall.
Once attached to cell wall membranes, a carrier molecule has the ability to convey auxin against a gradient of concentration. Classically, this is expressed in specific transport equations, for each carrier molecule W associated to a wall of length l:
 |
10 |
where JIAA is the contribution to the total flux of auxin due to a given influx carrier W. T is a constant transport coefficient specific to the carrier molecule. In the case of efflux transport, the relationship is inversed.
High auxin concentration induces high rates of cell expansion (deformation remains slow with comparison to biochemical aspect though). A simple empirical relationship between the wall viscosity coefficient and the auxin concentration was used:
 |
11 |
The initial conditions for the simulations consisted of a brick of 11 × 3 cells. The vertical displacement of the bottom/top faces and all the displacements of the interior cells and left face were fixed. To initiate the converging flow of auxin on the middle cell, PIN1 is initiated symmetrically around the horizontal axis on the L1 layer.
The model was used to analyse the resulting patterns of auxin flows and concentration. During the simulation, a transient phase was observed during which flows of auxin were progressively conveyed towards the central epidermal cell where a peak of auxin concentration was formed as described by Heisler et al. (2005). The flux is then redirected downward due to the positive feedback between PIN1 and auxin flux in sub-epidermal cells, as observed during the emergence of leaf primordia (Reinhardt et al., 2003). The nature of the feedback between auxin concentration and carrier allocation (eqn 9) reinforced and maintained this circulation in a quasi steady state. At this stage, the model also reproduced the schemes of PIN1 and AUX1 distribution observed at the early stage of young primordia. (Fig. 8). Simulations took 4 min for structures of up to 70 cells, 280 walls and for a total of 2000 time increments using user-specific Python functions for wall and cell entities.
Fig. 8.

Establishment of the ‘reverse fountain’ cycling of auxin: (A) initial conditions, (B) direction of flux towards the local maxima of auxin concentration; (C) redirection and canalization of the flux towards deeper tissues. The transport of auxin is mediated by carrier molecules distributed heterogeneously on cell walls: (D) AUX1 influx carrier conveys auxin to the L1 layer, (E) PIN1 efflux carrier directs the flux towards the site of maximum concentration in the L1 layer, (F) canalization process by PIN1 in deeper cells redirects the flux downwards (see Supplementary Information Video ‘Fountain’ available online).
Case 3: mechanical interactions in the formation of an outgrowth
Further, cell–cell mechanical interactions were chose for illustration by simulating a simple case of an outgrowth. In the shoot apical meristem, for example, initiations of primordia are accompanied by cell proliferation under the L1 layer in which the primordia are initiated. Expanding cells remain largely adherent to surrounding tissues, and the mechanical behaviour of all tissues influences the kinematics of expansion in the emerging meristem.
According to Selker et al. (1992), a possible way for the meristem to develop a localized bulge is for a localized pressure and/or a wall to soften the epidermal cells in which the primordia are initiated. This was modelled by a simple architecture of cells consisting of three different tissues: the first tissue constituted one layer of cells and represented the L1 layer (blue in Fig. 9). The second tissue was composed of three layers of cells under the L1 layer (orange). At the beginning of the simulation, four cells of the second tissue enter a proliferation stage (third tissue in green). The wall properties (viscosities and moment of inertia) are set at the level of the tissue:
 |
12 |
Fig. 9.

The influence of mechanical interactions and tissue morphogenesis was illustrated by the simulation of an outgrowth generated by three tissues expanding at different rates. A fast-growing tissue (green) is adherent to two slowly growing surrounding tissues (blue, orange): (A–C) different stages of the development of the outgrowth; (D) strain rate distribution in cell walls (10−1 h−1); (E) areal strain rate (10−1 h−1) (see Supplementary Information Video ‘Outgrowth’ available online).
The properties of each tissue (TI) are constant with time. The proliferating cells have the same turgor pressure and radial expansion of walls is due to 50–100 times lower viscosity of cell walls. All cells have the same wall viscosities in the radial direction (Table 3). Cell type and therefore wall properties are inherited at division.
Table 3.
Mechanical parameters of the mechanical model of interacting tissues
| Viscosity (GPa s−1) | Moment of inertia (μm4) | Pressure (MPa) | |
|---|---|---|---|
| L1 – long axis | 1·104 | 5·101 | 1 |
| L1 – short axis | 1·106 | 5·102 | 1 |
| Proliferating | 1·104 | 5·100 | 1 |
| Interior – long axis | 1·104 | 5·101 | 1 |
| Interior – short axis | 5·105 | 5·101 | 1 |
The model predicted an increase in tensile stresses in the epidermis as it is observed generally at the surface of meristems (Dumais and Steele, 2000). Small regions of compression stresses were generated on the sides of the outgrowth and these are consistant with experimental observations by Kwiatkowska and Dumais (2003). The mapping of the cell's deformation state (volumetric strain and principal strain rate components; cf. Fig. 9), indicated limited correlations between tissue type and expansion rate. The overall behaviour of the model observed during the simulations showed gradual deformations taking place across the different tissues. These deformations are driven by the proliferating cells of the third tissues, but mechanical forces are propagated to neighbouring cells through the extracellular matrix continuum. Calculation time was about 50 s for 450 time steps, 90 cells and 400 walls.
DISCUSSION
Improved multicellular computational systems
Considerable progress has been made in the modelling of multicellular genetic systems, and different computational tools have been developed in the plant scientific community. Continuous representation of tissues has been employed to investigate patterning mechanisms in static contexts and these were applied notably to the trichome regulatory system and the canalization of auxin in the leaf (Fujita and Mochizuki, 2006; Benitez et al., 2007). These simulation schemes can easily be programmed using standard numerical packages, but remain limited when dealing with growth and cellularity. Models with explicit descriptions of cells have been developed recently and applied to the root (Chavarria-Krauser and Schurr, 2004; Swarup et al., 2005) and the shoot apical meristem (Barbier de Reuille et al., 2006; Jönsson et al., 2006b; Smith et al., 2006). Cell growth has been represented using repulsive spring forces between the centres of neighbouring cells and these systems could be applied to predict the placing of primordia in different phyllotactic patterns (Jönsson et al., 2006b).
To date, however, most of these modelling tools have been designed for the analysis of specific experimental systems (SAM/RAM). A popular approach, also developed in animal sciences, is based on the Cellular Potts Models (Merks and Glazier, 2005). These systems cannot be ported into other fields of application without a significant investment in software development. Also, the description of growth kinematics is heavily limited due to the simplification of the physics of wall expansion and cell–cell mechanical interactions. The CellModeller system presented in this paper has overcome some of these shortcomings in several ways.
CellModeller is a generic system that addresses inter-cellular plant dynamics (no sub-cellular resolution). Cell populations of over 1000 cells can be simulated on a standard PC machine, and larger systems can be analysed with the sacrifice of interactivity and if new algorithms are used to take advantage of the parallel and multi-scale functioning of plant systems.
Scripts are used to encode the behaviour of any type of entity within the system. This is a modular approach to the programming of cellular dynamics, and this facilitates the reuse of parts of an existing model.
The system provides a formal description of the architecture of interactions within the plant structure. Based on the network of connections between the entities of the architecture, it is possible to encode models with a large variety of patterning mechanisms and save them in XML file format.
CellModeller provides a finer description of the spatial structure, and incorporates a more precise biophysical model. The mechanics of cell–cell interaction are specific to plant systems: tissues are represented as 2D biphasic objects where a fluid (represented by the turgor pressure in each cell), interacts with the closed network of deformable cell walls.
Future prospects for plant morphogenesis
Plant form arises from the multitude of genetic and physical interactions that occur within a growing assembly of cells. Although molecular techniques are now providing large amounts of information about the behaviour of cells and their functioning, still little is known about how those processes integrate within whole plant tissues and organs. Genetic analysis is time consuming when the number of interacting factors is large and it is becoming extremely complicated to identify the networks underlying the regulation of cell activity. Although the models were based on qualitative data from biological experiments, they have emphasized how computer models can provide essential information for understanding the functioning of cell–cell co-ordination during cellular morphogenesis.
Differentiation, an intrinsically cell autonomous process, was illustrated by the simple and well-characterized trichome genetic system (Guimil and Dunand, 2006). The simulation of the regulatory network predicting the trichome initiation sites have demonstrated the efficiency of numerical simulations to analyse different networks and help to test probable biological hypotheses. A simple regulatory network made of only two different types of inhibitors produced a range of plausible phenotypes, i.e. no clustering and regular spacing of initiation sites. Also, it was seen that variations in the topology of the network induced drastic changes in phenotypes, i.e. modification of density and appearance of clusters. Hormonal signalling also plays a central role in the regulation of local cell proliferation and cell differentiation (Fleming, 2006). The model of auxin polar transport showed that the dynamic allocation of carrier molecules is sufficient to maintain the gradients of hormone concentration in the primordia (Benkova et al., 2003). Finally, growth and form in plants are intimately related to the regulation of the cell physical properties (Cosgrove, 2001). However, measuring the action of genes on the cell physical properties is particularly difficult within the 3D architecture of higher plants, and numerical mechanical analysis can be particularly helpful for investigating the behaviour of such composite structures.
Cell-based simulation approaches are becoming crucial tools for understanding the genetic regulation of plant development, and it is critical in the future that computational systems allow for the analysis of the plant as a system rather than as separate components. The development of the CellModeller software, which facilitates the construction of morphogenetic models on different types of cellular entities, is a step towards more adaptive genetic/physical simulation systems for studying plant morphogenesis.
SUPPLEMENTARY INFORMATION
ACKNOWLEDGEMENTS
This research was supported jointly by the Biotechnology and Biological Sciences Research Council and Engineering and Physical Sciences Research Council research grant (BBS/B/16720, BEP/17053).
LITERATURE CITED
- Barbier de Reuille P, Bohn-Courseau I, Godin C, Traas J. A protocol to analyse cellular dynamics during plant development. The Plant Journal. 2005;44:1045–1053. doi: 10.1111/j.1365-313X.2005.02576.x. [DOI] [PubMed] [Google Scholar]
- Barbier de Reuille P, Bohn-Courseau I, Ljung K, Morin H, Carraro N, Godin C. Computer simulations reveal properties of the cell–cell signaling network at the shoot apex in Arabidopsis. Proceedings of the National Academy of Sciences of the USA. 2006;103:1627–1632. doi: 10.1073/pnas.0510130103. [DOI] [PMC free article] [PubMed] [Google Scholar]
- Bengough AG, Bransby MF, Hans J, McKenna SJ, Roberts TJ, Valentine TA. Root responses to soil physical conditions: growth dynamics from field to cell. Journal of Experimental Botany. 2006;57:437–447. doi: 10.1093/jxb/erj003. [DOI] [PubMed] [Google Scholar]
- Benitez M, Espinosa-Soto C, Padilla-Longoria P, Diaz J, Alvarez-Buylla ER. Equivalent genetic regulatory networks in different contexts recover contrasting spatial cell patterns that resemble those in Arabidopsis root and leaf epidermis: a dynamic model. International Journal of Developmental Biology. 2007;51:139–155. doi: 10.1387/ijdb.062183mb. [DOI] [PubMed] [Google Scholar]
- Benkova E, Michniewicz M, Sauer M, Teichmann T, Seifertova D, Jurgens G, et al. Local, efflux-dependent auxin gradients as a common module for plant organ formation. Cell. 2003;115:591–602. doi: 10.1016/s0092-8674(03)00924-3. [DOI] [PubMed] [Google Scholar]
- Chavarria-Krauser A, Schurr U. A cellular growth model for root tips. Journal of Theoretical Biology. 2004;230:21–32. doi: 10.1016/j.jtbi.2004.04.007. [DOI] [PubMed] [Google Scholar]
- Cosgrove DJ. Wall structure and wall loosening: a look backwards and forwards. Plant Physiology. 2001;125:131–134. doi: 10.1104/pp.125.1.131. [DOI] [PMC free article] [PubMed] [Google Scholar]
- Dumais J, Kwiatkowska D. Analysis of surface growth in shoot apices. The Plant Journal. 2001;31:229–241. doi: 10.1046/j.1365-313x.2001.01350.x. [DOI] [PubMed] [Google Scholar]
- Dumais J, Steele CR. New evidence for the role of mechanical forces in the shoot apical meristem. Journal of Plant Growth Regulation. 2000;19:7–18. doi: 10.1007/s003440000003. [DOI] [PubMed] [Google Scholar]
- Dupuy L, Mackenzie J, Haseloff J. A biomechanical model for the study of plant morphogenesis. In: Salmén L., editor. Choleocheate orbicularis, a 2D study species. In; Proceedings of the 5th Plant Biomechanics Conference; Stockholm, Sweden. 2006. [Google Scholar]
- Espinosa-Soto C, Padilla-Longoria P, Alvarez-Buylla ER. A gene regulatory network model for cell-fate determination during Arabidopsis flower development that is robust and recovers experimental gene expression profiles. The Plant Cell. 2004;16:2923–2939. doi: 10.1105/tpc.104.021725. [DOI] [PMC free article] [PubMed] [Google Scholar]
- Feugier FG, Mochizukic A, Iwasa Y. Self-organization of the vascular system in plant leaves: inter-dependent dynamics of auxin flux and carrier proteins. Journal of Theoretical Biology. 2005;21:366–375. doi: 10.1016/j.jtbi.2005.03.017. [DOI] [PubMed] [Google Scholar]
- Fleming AJ. Plant signalling: the inexorable rise of auxin. Trends in Cell Biology. 2006;16:398–402. doi: 10.1016/j.tcb.2006.06.005. [DOI] [PubMed] [Google Scholar]
- Friml J. Auxin transport – shaping the plant. Current Opinion in Plant Biology. 2003;6:7–12. doi: 10.1016/s1369526602000031. [DOI] [PubMed] [Google Scholar]
- Fujita H, Mochizuki A. Pattern formation of leaf veins by the positive feedback regulation between auxin flow and auxin efflux carrier. Journal of Theoretical Biology. 2006;241:541–551. doi: 10.1016/j.jtbi.2005.12.016. [DOI] [PubMed] [Google Scholar]
- Furusawa C, Kaneko K. Robust development as a consequence of generated positional information. Journal of Theoretical Biology. 2003;224:413–435. doi: 10.1016/s0022-5193(03)00189-9. [DOI] [PubMed] [Google Scholar]
- Glover BJ. Differentiation in plant epidermal cells. Journal of Experimental Botany. 2000;51:497–505. doi: 10.1093/jexbot/51.344.497. [DOI] [PubMed] [Google Scholar]
- Green PB, Erickson RO, Buggy J. Metabolic and physical control of cell elongation rate. Plant Physiology. 1971;47:423–430. doi: 10.1104/pp.47.3.423. [DOI] [PMC free article] [PubMed] [Google Scholar]
- Guimil S, Dunand C. Patterning of Arabidopsis epidermal cells: epigenetic factors regulate the complex epidermal cell fate pathway. Trends in Plant Science. 2006;11:601–609. doi: 10.1016/j.tplants.2006.10.001. [DOI] [PubMed] [Google Scholar]
- Heisler MG, Ohno C, Das P, Sieber P, Reddy GV, Long JA, et al. Patterns of auxin transport and gene expression during primordium development revealed by live imaging of the Arabidopsis inflorescence meristem. Current Biology. 2005;15:1899–1911. doi: 10.1016/j.cub.2005.09.052. [DOI] [PubMed] [Google Scholar]
- Jönsson H, Heisler MG, Reddy VG, Agrwal V, Gor V, Shapiro BE, et al. Modelling the organization of the WUSCHEL expression domain in the shoot apical meristem. Bioinformatics. 2006;a 21 doi: 10.1093/bioinformatics/bti1036. [DOI] [PubMed] [Google Scholar]
- Jönsson H, Heisler MG, Shapiro BE, Meyerowitz EM, Mjolsness E. An auxin-driven polarized transport model for phylotaxis. Proceedings of the National Academy of Sciences of the USA. 2006;b 105 doi: 10.1073/pnas.0509839103. [DOI] [PMC free article] [PubMed] [Google Scholar]
- Kwiatkowska D, Dumais J. Growth and morphogenesis at the vegetative shoot apex of Anagallis arvensis L. Journal of Experimental Botany. 2003;54:1585–1595. doi: 10.1093/jxb/erg166. [DOI] [PubMed] [Google Scholar]
- Lee K, Avondo J, Morrison H, Blot L, Stark M, Sharpe J, et al. Visualizing plant development and gene expression in three dimensions using optical projection tomography. The Plant Cell. 2006;18:2145–2156. doi: 10.1105/tpc.106.043042. [DOI] [PMC free article] [PubMed] [Google Scholar]
- Meinhardt H. Biological pattern formation: new observations provide support for theoretical predictions. BioEssay. 1994;16:627–632. doi: 10.1002/bies.950160906. [DOI] [PubMed] [Google Scholar]
- Merks RMH, Glazier JA. A cell-centered approach to developmental biology. Physica A: Statistical Mechanics and its Applications. 2005;352:113–130. [Google Scholar]
- Mitchison GJ. A model for vein formation in higher plants. Proceedings of the Royal Society of London B. 1980;207:79–109. [Google Scholar]
- Payne CT, Zhang F, Lloyd AM. GL3 encodes a bHLH protein that regulates trichome development in Arabidopsis through interaction with GL1 and TTG1. Genetics. 2000;156:1349–1362. doi: 10.1093/genetics/156.3.1349. [DOI] [PMC free article] [PubMed] [Google Scholar]
- Pesch M, Hulskamp M. Creating a two-dimensional pattern de novo during Arabidopsis trichome and root hair initiation. Current Opinion in Genetics and Development. 2004;14:422–427. doi: 10.1016/j.gde.2004.06.007. [DOI] [PubMed] [Google Scholar]
- Reinhardt D, Pesce E-R, Stieger P, Mandel T, Baltensperger K, Bennett M, et al. Regulation of phyllotaxis by polar auxin transport. Nature. 2003;426:255–260. doi: 10.1038/nature02081. [DOI] [PubMed] [Google Scholar]
- Rolland-Lagan A-G, Prusinkiewicz P. Reviewing models of auxin canalization in the context of leaf vein pattern formation in Arabidopsis. The Plant Journal. 2005;44:854–865. doi: 10.1111/j.1365-313X.2005.02581.x. [DOI] [PubMed] [Google Scholar]
- Sachs T. Pattern formation in plant tissues. Cambridge: Cambridge University Press; 1991. [Google Scholar]
- Scarpella E, Marcos D, Friml J, Berleth T. Control of leaf vascular patterning by polar auxin transport. Genes and Development. 2006;20:1015–1027. doi: 10.1101/gad.1402406. [DOI] [PMC free article] [PubMed] [Google Scholar]
- Schellmann S, Hulskamp M. Epidermal differentiation: trichomes in Arabidopsis as a model system. International Journal of Developmental Biology. 2005;49:579–584. doi: 10.1387/ijdb.051983ss. [DOI] [PubMed] [Google Scholar]
- Schellmann S, Schnittger A, Kirik V, Wada T, Okada K, Beermann A, et al. TRIPTYCHON and CAPRICE mediate lateral inhibition during trichome and root hair patterning in Arabidopsis. The EMBO Journal. 2002;21:5036–5046. doi: 10.1093/emboj/cdf524. [DOI] [PMC free article] [PubMed] [Google Scholar]
- Schnittger A, Jurgens G, Hulskamp M. Tissue layer and organ specificity of trichome formation are regulated by GLABRA1 and TRIPTYCHON in Arabidopsis. Development. 1998;125:2283–2289. doi: 10.1242/dev.125.12.2283. [DOI] [PubMed] [Google Scholar]
- Selker JML, Steucek GL, Green PB. Biophysical mechanisms for morphogenetic progressions at the shoot apex. Developmental Biology. 1992;153:29–43. doi: 10.1016/0012-1606(92)90089-y. [DOI] [PubMed] [Google Scholar]
- Smith RS, Guyomarch S, Mandel T, Reinhardt D, Kuhlemeier C, Prusinkiewicz P. A plausible model of phyllotaxis. Proceedings of the National Academy of Sciences of the USA. 2006;103:1301–1306. doi: 10.1073/pnas.0510457103. [DOI] [PMC free article] [PubMed] [Google Scholar]
- Srinivas BP. Understanding the function of the Arabidopsis GLABRA2 gene in trichome patterning, morphogenesis and differentiation. Cologne, Germany: PhD Thesis, Faculty of Mathematics and Natural Sciences, University of Cologne; 2004. [Google Scholar]
- Swarup R, Bennet M. Auxin transport: the fountain of life in plants? Developmental Cell. 2006;5:824–826. doi: 10.1016/s1534-5807(03)00370-8. [DOI] [PubMed] [Google Scholar]
- Swarup R, Kramer EM, Perry P, Knox K, Leyser HMO, Haseloff J, et al. Root gravitropism requires lateral root cap and epidermal cells for transport and response to a mobile auxin signal. Nature Cell Biology. 2005;7:1057–1065. doi: 10.1038/ncb1316. [DOI] [PubMed] [Google Scholar]
- Taiz L. Plant cell expansion: regulation of cell wall mechanical properties. Annual Review of Plant Physiology. 1984;35:385–657. [Google Scholar]
- Turing AM. The chemical basis of morphogenesis. Philosophical Transactions Royal Society B. 1952;237:37–72. [Google Scholar]
- Vieten A, Sauer M, Brewer PB, Friml J. Molecular and cellular aspects of auxin-transport-mediated development. Trends in Plant Science. 2007;12:160–168. doi: 10.1016/j.tplants.2007.03.006. [DOI] [PubMed] [Google Scholar]
- Waters CM, Bassler BL. Quorom sensing: cell-to cell communication in bacteria. Annual Reviews Cell and Developmental Biology. 2005;21:319–346. doi: 10.1146/annurev.cellbio.21.012704.131001. [DOI] [PubMed] [Google Scholar]