

Abstract
Parcellation according to function (e.g., visual, somatosensory, auditory, motor) is considered a fundamental property of sensorimotor cortical organization, traditionally defined from cytoarchitectonics and mapping studies relying on peak evoked neuronal activity. In the adult rat, stimulation of single whiskers evokes peak activity at topographically appropriate locations within somatosensory cortex and provides an example of cortical functional specificity. Here, we show that single whisker stimulation also evokes symmetrical areas of suprathreshold and subthreshold neuronal activation that spread extensively away from peak activity, effectively ignoring cortical borders by spilling deeply into multiple cortical territories of different modalities (auditory, visual and motor), where they were blocked by localized neuronal activity blocker injections and thus ruled out as possibly caused by “volume conductance.” These symmetrical activity spreads were supported by underlying border-crossing, long-range horizontal connections as confirmed with transection experiments and injections of anterograde neuronal tracer experiments. We found such large evoked activation spreads and their underlying connections regardless of whisker identity, cortical layer, or axis of recorded responses, thereby revealing a large scale nonspecific organization of sensorimotor cortex based on a motif of large symmetrical activation spreads. Because the large activation spreads and their underlying horizontal connections ignore anatomical borders between cortical modalities, sensorimotor cortex could therefore be viewed as a continuous entity rather than a collection of discrete, delineated unimodal regions, an organization that could coexist with established specificity of cortical organization and that could serve as a substrate for associative learning, direct multimodal integration and recovery of function after injury.
Keywords: whiskers, somatosensory cortex, barrel, extracellular recordings, local field potentials, action potential
Introduction
Territorial parcellation of sensory cortex has been traditionally inferred by colocalizing cyto- or mylo-architectonic markers with peak suprathreshold (action potentials) neuronal activity evoked by a sensory stimulus (Kaas and Collins, 2001; Rosa and Tweedale, 2005; Zeki, 2005). However, such studies do not typically consider the spatiotemporal spread of suprathreshold responses away from the location of peak response, or any evoked subthreshold (synaptic) responses. Recently, the latter responses have been shown to play a role in cortical processing, integration, and perception (Ganguly and Kleinfeld, 2004; Jancke et al., 2004; Bair, 2005; Scherberger et al., 2005; Benison et al., 2006; Liu and Newsome, 2006) and also to constitute a dominant underlying source of common functional imaging methods such as functional magnetic resonance imaging (fMRI), voltage-sensitive dye imaging, and intrinsic signal optical imaging (Logothetis et al., 2001; Grinvald and Hildesheim, 2004; Niessing et al., 2005) used for mapping functional cortical organization. Therefore, investigating the entire spatiotemporal spread of both suprathreshold and subthreshold responses evoked by a sensory stimulus and their relationship to cortical structure is essential for understanding cortical functional organization.
To that end, we exploited the unique advantages of the rodent's sensory cortex including its lissencephalic (lack of convolution) nature and the opportunity for clear visualization of anatomical representations of the entire flattened cortex using postmortem layer IV cytochrome oxidase (CO) staining, delineating somatosensory (SCx), auditory (ACx), visual (VCx), and motor (MCx) cortices and their borders (Wallace, 1987). SCx can be further subdivided into individual representations of each of the large facial whiskers, known as “barrels” (Woolsey and Van der Loos, 1970), each constituting the main input area from its corresponding whisker to the cortex. This detailed structural map is ideally suited for studying cortical structure-function relationships because the results of electrophysiological mapping (both subthreshold and suprathreshold) can be directly superimposed over the anatomical map of the flattened cortex obtained within the same animal. We used electrode array recordings guided by functional imaging (intrinsic signal optical imaging) to study the spread of activity away from peak activity location evoked by individually stimulating three large whiskers. Next, we superimposed the electrophysiological findings on the flattened layer-IV histological map of the same animal. Finally, to elucidate potential underlying mechanisms for such activity spreads, we used a combination of anterograde tracer injections, localized neuronal activity blocking experiments, and localized cortical transections that altogether revealed a large-scale functional and anatomical motif for primary sensory cortex.
Materials and Methods
All procedures were in compliance with National Institutes of Health guidelines and approved by University of California, Irvine Animal Care and Use Committee.
Subjects and procedures.
Male Sprague Dawley rats (315–550 g) were anesthetized and maintained with sodium pentobarbital, and imaged with intrinsic signal optical imaging as described previously (Chen-Bee et al., 2007). We imaged the activity evoked by whiskers C2, A2 and E2 whose barrels are located within barrel cortex either toward the center, the border near auditory cortex, or the border near the rest of the body somatosensory representation, respectively (Fig. 1A). Imaging was performed to identify the location of peak optical activity evoked by suprathreshold mechanical stimulation of either C2, A2, or E2 as a means to locate their respective barrels (Masino et al., 1993; Brett-Green et al., 2001). After imaging, the skull region and underlying dura were removed. Before electrophysiology recording, the cisterna magnum was drained of CSFs to minimize edema and brain pulsation, and the exposed cortex covered with silicon oil. Then, an array of eight Tungsten microelectrodes (∼1.5 MΩ impedance) were used to study neuronal activity and each electrode was independently inserted into the exposed cortex such that the first electrode entered perpendicular to the location of peak optical activity and the remaining electrodes (spaced 0.5 mm apart) independently lowered into the cortex so that the last electrode sampled neuronal activity 3.5 mm away from peak optical activity. Whisker stimulation protocol (9° rostral-caudal deflections, 5 Hz for 1 s) during electrophysiology recording was the same as that used during imaging except trials started every 2 s. Simultaneous recordings of both suprathreshold [single units (SUs)] and subthreshold [local field potentials (LFPs)] evoked neuronal activity were obtained from each electrode at two cortical depths: ∼300–400 μm and ∼600–700 μm below surface for supragranular and granular layers, respectively, as measured from the cortical surface while the electrode penetrated the cortex using a micropositioner with 1 μm resolution steps (EPS, Alpha-Omega). The aligned electrodes were directed out of barrel cortex toward cortical regions of a different sensory modality such as ACx, VCx or MCx, or directed within barrel cortex (SCx; Figs. 1B, 2A–C, 3). Recording ended with small electrolytic lesions (10 μA, 10 s) made in layer IV as verified by postmortem cytochrome oxidase of layer IV to confirm the recording locations of the 8 electrodes. Recordings were obtained from 5 sets of experiments across 43 rats: n = 12 for whisker C2, two layers (supra vs gran), two directions (within SCx vs outside SCx toward ACx); n = 12 for A2, supra versus gran, within SCx versus toward ACx; n = 11 for C2, supra versus gran, one direction (toward VCx); n = 5 for E2, supra versus gran, two directions (toward MCx vs toward VCx); and n = 3 for C2, three layers (supra vs gran vs infragranular ∼1100 μm), one direction toward ACx. In a subset of rats, lidocaine (1 μl, 10%; Sigma) was microinjected between electrodes 7 and 8 at ∼100–150 μm depth via a 10 μl syringe over 1 min, preceded by identical injection of saline. In another subset, transections were performed with minimal bleeding via a sharp blade created from a 26-gauge hypodermic needle. In additional rats, imaging of whisker C2 or A2 was instead followed by pressure microinjection of the anterograde tracer BDA (10–15 nL, 10%, BDA 10,000; Invitrogen) at ∼250–400 μm below location of peak imaging activity. In a last set of rats, instead of imaging, dural and cortical blood vessels viewed through the thinned skull were used to guide BDA injection into whisker A or C rows. Afterward, all rats were killed with sodium pentobarbital and perfused intracardially with saline followed by paraformaldehyde in phosphate buffer; their brains flattened, postfixed, cryoprotected with 30% sucrose, and sliced into 30-μm-thick tangential sections or 50 μm thick coronal sections; and brain sections stained for either CO, Nissl, and/or BDA histochemistry according to described protocols (Wong-Riley and Welt, 1980; Reiner et al., 2000).
Figure 1.
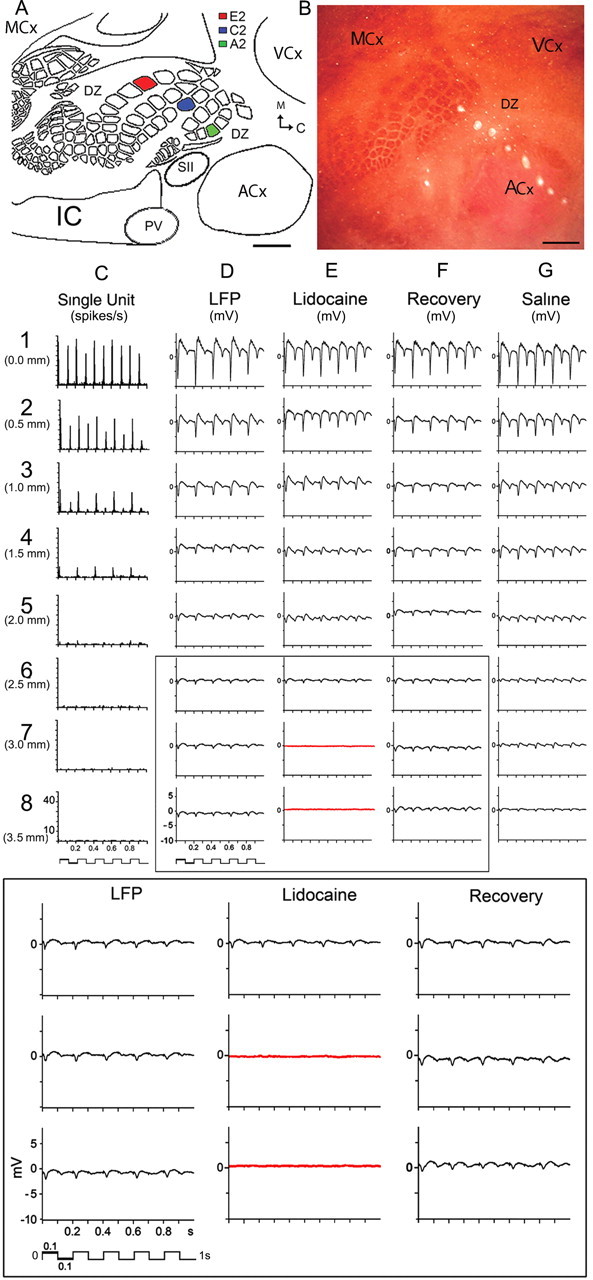
Representative case of evoked SU and LFP responses recorded by the 8-electrode array after whisker A2 stimulation. A, Schematic based on flattened layer IV CO-stained brain slice illustrating main cortical modalities, their borders, and color-coded barrels of the 3 whiskers studied. B, Lesions produced by the 8-electrode array. Note electrode #1 lesion is localized at A2 barrel and electrodes 4–8 span almost the entire ACx. Scale bars, 1000 μm. C, Evoked SUs decay over cortical distance and completely disappear after electrode 4. D, LFPs also decay over distance but are still present at the last electrode 8. E, LFPs are abolished in electrodes 7–8 (red traces) after lidocaine injection between electrodes 7 and 8, with full recovery after 45 min (F). G, Saline injection had no effect. Bottom, Magnification of boxed traces.
Figure 2.
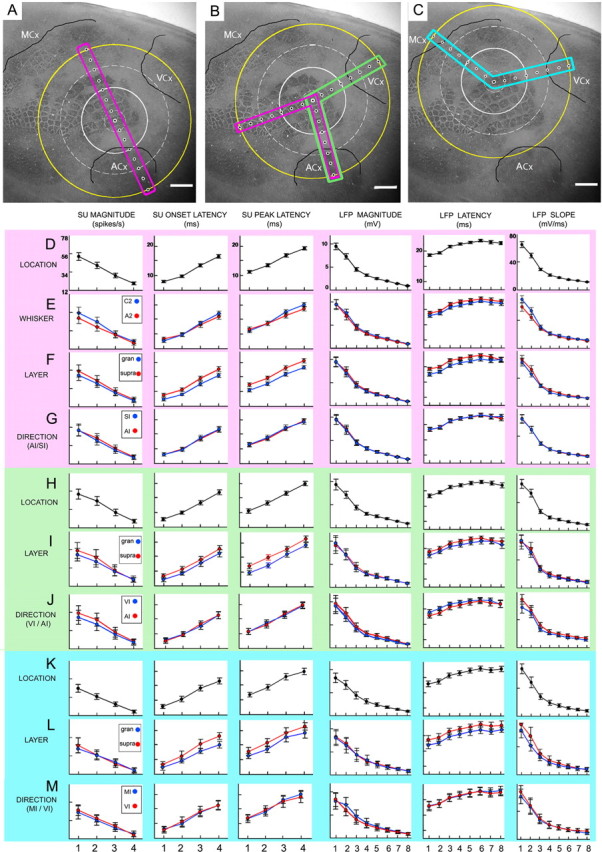
Change in evoked responses across location is similar regardless of whisker, layer, or direction. A–C, Schemes of recording locations whose first electrode registered with whisker A2 (A), C2 (B), or E2 (C) barrels. Boxes are color-coded to indicate Data A (pink), B (green), or C (blue). Extrapolated white circles are based on percentage of rats with evoked SU at a given distance: 100% = small, dashed; >50% = medium, solid; and farthest electrode with measurable SU = large, dashed. Extrapolated yellow circle is based on 100% of rats exhibiting evoked LFP at the farthest location. Scale bars, 1 mm. D–G, Detailed plots of SU and LFP response properties are provided for Data A, across location (D) and then subdivided by whisker (E), layer (F), or direction (G). Note expected latency differences between layers (F). H–M, Except for subdivision by whisker, respective plots for Data B (H–J) and C (K–M) are provided.
Figure 3.

Examples of lesions from the 8-electrode array showing recording locations on a flattened layer IV CO-stained cortex. Scale bars, 1000 μm. The array alignment was directed out of barrel cortex toward either VCx (A) or ACx (B), or directed within SI (C, D), where the first electrode registered with either C2 (A, C) or A2 (B, D) barrel.
Electrophysiological analysis.
Recorded signals were amplified and bandpass (1–3000 Hz) filtered to allow simultaneous capture of multiple units and LFPs, and then digitized at 24 kHz rate (Alpha Map). Real-time traces and multiunit PSTHs were generated from each electrode to monitor quality and consistency of recordings. All off-line analysis was performed using Spike 2 (CED). Collected data were digitally filtered at 1–300 Hz or 300–3000 Hz to extract LFP or multiple units, respectively. LFP: For each recording location of each electrode, data were averaged across the 128 collected trials and then three LFP response properties measured: absolute value of negative peak (magnitude); time to negative peak (latency); and rate of change to negative peak (slope). SU: Multiple units obtained from each electrode were separated into single-unit spike trains via template-matching spike sorting (up to 3 neurons per electrode). For each separated unit, a PSTH with 1 ms bins was constructed from the 128 collected trials and then three SU response properties were measured: mean evoked firing rate determined from a 50 ms time epoch beginning 7 ms after stimulus onset minus mean spontaneous firing rate determined from a 300 ms time epoch beginning 350 ms before stimulus onset (magnitude); time point of first 1 ms bin to contain a significant evoked response (p < 0.01) after stimulus onset (Abeles, 1982) (onset latency); and time point of the 1 ms bin with peak firing rate (peak latency). Values of SU response properties were then averaged across neurons such that there was only one magnitude, onset latency, and peak latency average SU value associated with each recording location of each electrode. All plotting (means and error bars indicating 95% confidence intervals) and statistics were then performed on LFP and SU response properties using Systat 11 (Systat Software).
Statistics.
LFP data were available for analysis across all 8 electrodes. For SU statistical analysis was restricted to data from the first 4 electrodes, which permitted addressing the same statistical hypotheses as those for LFP analysis while still comprising a majority of rats (30 of 40, or 75%). For each LFP and SU response property, data were grouped accordingly: Data A: first and second set of experiments (same sample size) were analyzed together to simultaneously compare across recording location (LOCATION, locations 1–8), cortical layer (LAYER, supragranular vs granular), whisker identity (WHISKER, C2 vs A2), and direction of electrode array alignment (DIRECTION, array directed out of vs into barrel cortex); Data B: first and third set (similar sample size) to compare across a different combination of directions (out of barrel cortex toward either ACx vs VCx) while holding whisker identity constant (C2) but otherwise still comparing across LOCATION and LAYER; and Data C: fourth set with n = 5 to compare across yet another combination of directions (out of barrel cortex toward either VCx vs MCx) while still comparing across LOCATION and LAYER but for a third type of whisker (E2). All subdivided data were then first natural-log transformed to better satisfy the assumptions of a repeated-measures ANOVA and inferential statistics performed on each SU and LFP response property for each of Data A–C. When a given ANOVA p value differed by >10% from its corresponding Huynh-Feldt p value, suggesting compound symmetry (repeated-measures ANOVA assumption) has failed, then its corresponding multivariate ANOVA p value was used when available or otherwise the Huynh-Feldt p value was used. Alpha level was set conservatively to 0.001 for Data A, B to account for the large degree of repeated sampling from each rat (8 locations × 2 layers × 2 directions) and was returned to 0.05 for Data C because of the smaller sample size. In the additional 5 rats that underwent cortical transections, only LFP magnitude data were natural-log transformed and analyzed with a repeated-measures ANOVA to address all possible main effects and interactions of transection condition (TRANSECTION, 3 levels corresponding to before vs side vs center) as well as LOCATION and LAYER. Alpha level was set to 0.01 to account for the smaller sample size but high degree of repeated sampling from each rat (3 transection conditions × 8 locations × 2 layers). Follow-up specific contrasts were performed to determine whether significant differences existed between transection conditions for specifically recording locations 4–8, and Bonferroni adjustment made to the α level to account for multiple contrasts (0.01 divided by 10 contrasts for an adjusted α level of 0.001).
Histology.
Series of digital images at ×1.25, ×4 and ×20 magnification were collaged from tracer (at layers 2–3, 5) and CO-stained (layer 4) sections. Axons and vasculature were outlined from each 20× collages. Schemes of barrels and cortical boundaries based on corresponding CO-stained sections were overlapped with axon outlines by matching their vasculature patterns. Because electrophysiological findings regarding the spread of activity were similar at different cortical depths, tracing neuronal connections over cortical distance was achieved by overlapping 2 or more consecutive cortical slices to obtain a more comprehensive picture of long-range connectivity originating from different layers.
Results
Large spread of evoked activity
A representative example of evoked activity for whisker A2 stimulation with the electrode array directed toward ACx is provided in Figure 1, with the locations of the recording electrodes shown in Figure 1B. Location of peak activity for both suprathreshold and subthreshold responses was confirmed to coregister with the appropriate whisker barrel. Suprathreshold activity (SU) was found to spread beyond the location of peak activity, decaying with distance (electrodes 1–4) and disappearing by electrode 5 (between 1.5 and 2 mm away) (Fig. 1C). Note that weak suprathreshold evoked neuronal responses were still recorded in electrode 4, an electrode that was localized within the CO-defined area of ACx. In some rats, suprathreshold responses to A2 stimulation could be found even deeper within ACx, 2.5 mm away or approximately midway into ACx (Fig. 2; Table 1) demonstrating that even the spread of suprathreshold activity need not respect borders of different modalities, as previously suggested (Brett-Green et al., 2001). In contrast, although also spreading and decaying over distance away from peak activity location, subthreshold evoked activity (LFPs) was still present at the farthest recording location 3.5 mm away (Fig. 1D, electrode 8) near the opposite ACx border and, collectively with electrodes 4–7, spanned across most of ACx (Fig. 1B) and thus extensively beyond any potential multisensory integration areas at the borders of ACx and SCx (Di et al., 1994; Wallace et al., 2004; Menzel and Barth, 2005). To assess whether this subthreshold activity was locally generated, in 4 additional rats lidocaine (sodium channel blocker that temporarily blocks neuronal activity) was locally injected between the two farthest recording locations (3 and 3.5 mm away) and a transient disappearance of subthreshold activity was observed specifically at these two recording locations (Fig. 1E) showing a full return ∼45 min after injection (Fig. 1F), ruling out passive volume conductance as a potential explanation (Nunez and Srinivasan, 2006). These representative findings of suprathreshold and subthreshold activity evoked at far distances from peak activity were obtained regardless of which whisker (C2, A2, or E2), direction of electrode array alignment (away from barrel cortex toward ACx, VCx, MCx, or toward barrel cortex), or cortical depth (supragranular, granular, or infragranular) was investigated. Results from quantitative analysis of various response properties for both suprathreshold (peak magnitude, latency to first significant response, latency to peak response, percentage distribution of farthest evoked response) and subthreshold (magnitude of negative peak, latency to negative peak, and slope) activity (Tables 1, 2) (see Materials and Methods) further verified that, for any given response property, changes in evoked activity across distance of electrode locations (LOCATION, Fig. 2D,H,K) is symmetrical regardless of whisker identity (WHISKER, Fig. 2E), array direction (DIRECTION, Fig. 2G,J,M), or cortical layer (LAYER, Fig. 2F,I,L).
Table 1.
Cumulative frequency distribution of SU-responsive rats by recording location
| 1 (0.0 mm) | 2 (0.5 mm) | 3 (1.0 mm) | 4 (1.5 mm) | 5 (2.0 mm) | 6 (2.5 mm) | 7 (3.0 mm) | 8 (3.5 mm) | |
|---|---|---|---|---|---|---|---|---|
| n = 12 rats | ||||||||
| out, supra | 100 | 100 | 91.7 | 83.3 | 50 | 33.3 | 0 | 0 |
| out, gran | 100 | 100 | 91.7 | 83.3 | 50 | 33.3 | 0 | 0 |
| in, supra | 100 | 100 | 91.7 | 83.3 | 50 | 33.3 | 0 | 0 |
| in, gran | 100 | 100 | 91.7 | 83.3 | 50 | 33.3 | 0 | 0 |
| n = 12 rats | ||||||||
| out, supra | 100 | 100 | 83.3 | 66.7 | 33.3 | 16.7 | 0 | 0 |
| out, gran | 100 | 100 | 83.3 | 66.7 | 33.3 | 16.7 | 0 | 0 |
| in, supra | 100 | 100 | 83.3 | 75.0 | 41.7 | 16.7 | 0 | 0 |
| in, gran | 100 | 100 | 83.3 | 75.0 | 41.7 | 16.7 | 0 | 0 |
| n = 11 rats | ||||||||
| VCx, supra | 100 | 100 | 90.9 | 81.8 | 45.5 | 27.3 | 0 | 0 |
| VCx, gran | 100 | 100 | 90.9 | 81.8 | 45.5 | 27.3 | 0 | 0 |
| n = 5 rats | ||||||||
| MCx, supra | 100 | 100 | 100 | 100 | 60.0 | 40.0 | 0 | 0 |
| MCx, gran | 100 | 100 | 100 | 100 | 60.0 | 40.0 | 0 | 0 |
| VCx, supra | 100 | 100 | 100 | 100 | 60.0 | 40.0 | 0 | 0 |
| VCx, gran | 100 | 100 | 100 | 100 | 60.0 | 40.0 | 0 | 0 |
In contrast to evoked LFP responses being present for all rats (100%) at all 8 recording locations, the percentage of rats with the presence of evoked SU responses decreased with distance of the recording location. Provided here is the cumulative frequency distribution of total rats that exhibit evoked SU responses by recording location for 4 sets of experiments: n = 12 for rats with whisker C2 studied, electrode array aligned in two directions (in vs out of barrel cortex), and two layers (supra vs gran); n = 12 for rats with the same data collection paradigm as the first set of rats except whisker A2 was studied; n = 11 for rats with the same paradigm as the first set except electrode array was aligned in only one direction (towards VCx); and n = 5 for rats with the same paradigm as the first set except whisker E2 was studied (see Materials and Methods). The first frequency distribution for each set of rats was used as a representative distribution for that set and Kolmogorov–Smirnov two-sample tests were performed between all possible pairs of representative distributions except that of the last rat set (size of n = 5 is small and less than half of the other 3 sets). Within each set of experiments, the cumulative frequency distribution was very similar if not identical irrespective of the electrode array direction or cortical layer, and no significant difference in distribution was found between any pair of experiments compared (p values >0.95), suggesting that the frequency distribution of evoked SU responses across recording locations is the same between different whiskers or different electrode array directions.
Table 2.
LFP and SU inferential statistics
| LFP | Magnitude | p value | Latency | p value | Slope | p value |
|---|---|---|---|---|---|---|
| Data A | ||||||
| Location (1–8) | F(7,154) = 1299.3 | 1 × 10⁻¹⁵ | F(7,154) = 385.8 | 1 × 10⁻¹⁵ | F(7,154) = 1581.6 | 1 × 10⁻¹⁵ |
| Layer (supra vs gran) | F(1,22) = 5.9 | 0.023 | F(1,22) = 42.7 | 1 × 10⁻⁶ | F(1,22) = 11.7 | 0.002 |
| Direction (in vs out) | F(1,22) = 0.5 | 0.477 | F(1,22) = 0.0 | 0.846 | F(1,22) = 0.4 | 0.556 |
| Whisker (C2 vs A2) | F(1,22) = 0.2 | 0.693 | F(1,22) = 1.3 | 0.262 | F(1,22) = 1.0 | 0.336 |
| Data B | ||||||
| Location (1–8) | F(7,147) = 1030.7 | 1 × 10⁻¹⁵ | F(7,147) = 190.2 | 1 × 10⁻¹⁵ | F(7,147) = 1079.9 | 1 × 10⁻¹⁵ |
| Layer (supra vs gran) | F(1,21) = 0.7 | 0.409 | F(1,21) = 9.4 | 0.006 | F(1,21) = 6.5 | 0.018 |
| Direction (ACx vs VCx) | F(1,21) = 0.6 | 0.458 | F(1,21) = 1.6 | 0.222 | F(1,21) = 2.1 | 0.167 |
| Data C | ||||||
| Location (1–8) | F(7,28) = 348.7 | 1 × 10⁻¹⁵ | F(7,28) = 161.2 | 6 × 10⁻⁷ | F(7,28) = 380.4 | 6 × 10⁻¹⁴ |
| Layer (supra vs gran) | F(1,4) = 0.6 | 0.48 | F(1,4) = 110.3 | 5 × 10⁻⁴ | F(1,4) = 4.8 | 0.09 |
| Direction (VI vs MI) | F(1,4) = 6.3 | 0.07 | F(1,4) = 0.3 | 0.60 | F(1,4) = 1.1 | 0.36 |
| SU | Magnitude | p value | Onset latency | p value | Peak latency | p value |
|---|---|---|---|---|---|---|
| Data A | ||||||
| Location (1–8) | F(3,45) = 438.1 | 1 × 10⁻¹⁵ | F(3,45) = 423.2 | 1 × 10⁻¹⁵ | F(3,45) = 246.8 | 1 × 10⁻¹⁵ |
| Layer (supra vs gran) | F(1,15) = 9.4 | 0.008 | F(1,15) = 55.3 | 2 × 10⁻⁶ | F(1,15) = 67.2 | 6 × 10⁻⁷ |
| Direction (in vs out) | F(1,15) = 12.1 | 0.003 | F(1,15) = 0.0 | 0.962 | F(1,15) = 0.0 | 0.855 |
| Whisker (C2 vs A2) | F(1,15) = 0.3 | 0.588 | F(1,15) = 0.0 | 0.900 | F(1,15) = 1.1 | 0.312 |
| Data B | ||||||
| Location (1–8) | F(3,48) = 573.2 | 1 × 10⁻¹⁵ | F(3,14) = 103.1 | 9 × 10⁻¹⁰ | F(3,48) = 186.5 | 1 × 10⁻¹⁵ |
| Layer (supra vs gran) | F(1,16) = 4.4 | 0.052 | F(1,16) = 23.1 | 2 × 10⁻⁴ | F(1,16) = 58.9 | 1 × 10⁻⁶ |
| Direction (ACx vs VCx) | F(1,16) = 0.4 | 0.527 | F(1,16) = 0.0 | 0.994 | F(1,16) = 0.0 | 0.972 |
| Data C | ||||||
| Location (1–8) | F(3,2) = 87.0 | 0.01 | F(3,12) = 100.7 | 9 × 10⁻⁹ | F(3,2) = 844.2 | 1 × 10⁻³ |
| Layer (supra vs gran) | F(1,4) = 0.0 | 0.94 | F(1,4) = 7.0 | 0.06 | F(1,4) = 5.4 | 0.08 |
| Direction (VCx vs MCx) | F(1,4) = 0.6 | 0.49 | F(1,4) = 0.0 | 0.90 | F(1,4) = 0.0 | 0.95 |
Top half: Repeated-measures ANOVA was performed to investigate all possible main effects and interactions for LFP data (magnitude, latency, and slope) from each of Data A–C (see Materials and Methods). Alpha level was set to 0.001 for Data A–B and 0.05 for Data C. Only statistics for the main effects are summarized here, with significant statistics in bold, as the majority (>90%) of the two-, three-, and four-way interactions were not found significant, and the few interactions found significant were likely attributable to the high degree of sampling from each rat as they identified subtle differences (<10% relative to the substantial differences observed for the main effects) and are beyond the scope of the present study. See Materials and Methods for more details. Bottom half: To address the same main effects and interactions as those for the LFP analysis, only rats with evoked SU responses for at least recording locations 1–4 were included (75% of total rats), and repeated measures ANOVA was performed in the same manner for SU data (magnitude, onset latency, and peak latency) from only recording locations 1–4. Not surprisingly, Location main effect was highly significant for all LFP and SU response properties, and Layer main effect was highly significant for most LFP and SU latency properties. More noteworthy is the lack of significant results for either the main effect Whisker or Direction, or their interaction with Location, suggesting that the significant Location results were reproducible irrespective of whisker identity or electrode array direction.
Collectively, the results show that stimulation of a single whisker evokes peak activity colocalizing with the appropriate barrel, congruent with established specificity of cortical functional organization. In contrast, regardless of its barrel location within SCx, it activates a symmetrical suprathreshold cortical area up to 19.6 mm2 in size and an even larger subthreshold area of 38.5 mm2 (Fig. 2A–C) as estimated from the maximum observed radius of 2.5 or 3.5 mm, respectively (Table 1), indicating that there also exists a large scale and nonspecific aspect to the functional organization of sensorimotor cortex. Such activity spreads would dictate the degree of overlap within and between different cortical modalities. For example, an activity spread originating from a specific peak response can strongly overlap with spreads originating from closer peaks (or closer whiskers; e.g., C2 and A2) (Fig. 2), but such overlap will decrease with increasing distance between the peaks (or whiskers, e.g., A2 and E2) (Fig. 2). Likewise, whisker activity spread whose peak response is near a cortical territory of another modality (e.g., whisker A2 peak is near ACx) spans much deeper into that territory compared with one with a peak farther away (e.g., whisker E2). This is illustrated in Figure 2 in which a single whisker A2 is capable of activating SCx and the entire ACx including primary auditory cortex (Fig. 2A), whisker C2 can activate SCx and parts of ACx and VCx (Fig. 2B), and whisker E2 can activate SCx and parts of VCx and MCx (Fig. 2C), suggesting multimodal processing may already occur even deep inside sensory regions traditionally viewed as being strictly unimodal.
Cortical long-range horizontal connections underlying large activity spread
In additional experiments (n = 5), transections (Fig. 4A, inset) were performed to determine whether cortical horizontal connections play a role in such long-range subthreshold activation. For each rat, neuronal recordings were obtained from both supragranular and granular layers before and after a transection [∼1.5–2 mm length by 1.65 mm deep through the depth of gray matter; (Staba et al., 2005)] first along the side of the electrode array to serve as a control, and after an identical transection perpendicular to the electrode array and centered between electrodes 4 and 5, as verified by postmortem Nissl staining. Confirming the role of horizontal connections in long-range activation, the transection between electrodes 4 and 5 decreased subthreshold magnitude by 67.5 ± 2.9% (mean ± SEM), 69.4 ± 3.7, 60.3 ± 3.2 and 54.6 ± 6.6 at electrodes 5, 6, 7, and 8, respectively (Fig. 4A); differences were significant for electrodes 5–7, whereas no significant changes were seen after the control, side transection (Table 3). Post-transection activity level at electrodes 5–8 was reduced to 6–7% of electrode 1, even lower than the 11% observed at electrode 8 before transection.
Figure 4.
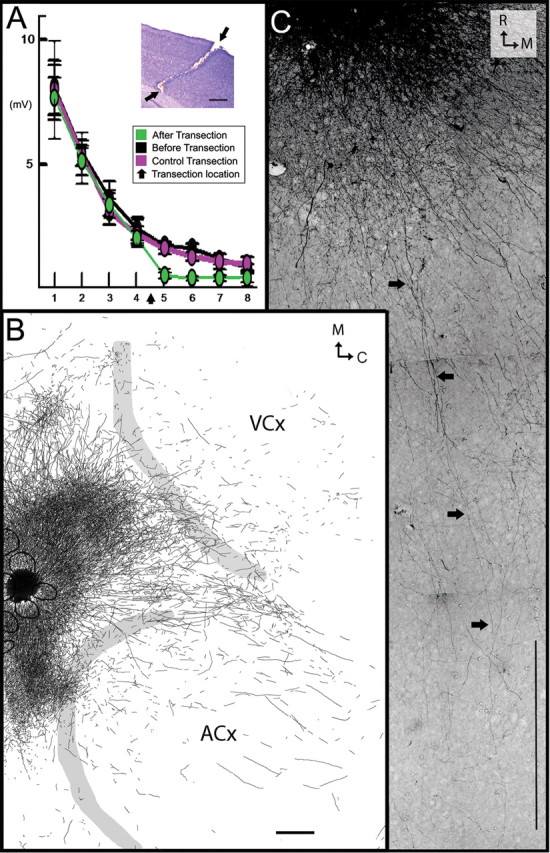
Long-range horizontal connections underlying long-range LFP responses. A, Evoked LFPs over cortical distance after whisker C2 stimulation (black) were almost abolished at electrodes 5–8 after cortical transection between electrodes 4 and 5 (green), an effect not observed after an earlier transection parallel to the electrode array (purple). Inset, Nissl-based micrograph of transection (arrows). B, C, Representative example of labeled border-crossing, long-range horizontal connections after BDA microinjection roughly above A2 barrel and surrounding septa. B, Delineated axons from three consecutive cortical slices from layers 2–3 superimposed on the corresponding layer IV scheme containing barrels (black) and cortical borders (gray). C, Photomicrograph from the same BDA injection illustrating several long-range axons radiating at least 2500 μm away from the injection site, spanning across VCx (arrows highlight one of the axons). Scale bars, 500 μm.
Table 3.
LFP magnitude inferential statistics for the transection experiments
| p value | ||
|---|---|---|
| Main effects | ||
| Transection (BT vs ST vs CT) | F(2,8) = 73.3 | 1 × 10⁻⁵ |
| Location (1–8) | F(7,28) = 191.0 | 1 × 10⁻¹⁵ |
| LAYER (supra vs gran) | F(1,4) = 1.2 | 0.34 |
| Specific contrasts | ||
| Location 4 | ||
| Contrast 1 | F(1,4) = 2.1 | 0.221 |
| Contrast 2 | F(1,4) = 0.3 | 0.591 |
| Location 5 | ||
| Contrast 1 | F(1,4) = 174.3 | 2 × 10⁻⁴ |
| Contrast 2 | F(1,4) = 0.8 | 0.421 |
| Location 6 | ||
| Contrast 1 | F(1,4) = 120.4 | 4 × 10⁻⁴ |
| Contrast 2 | F(1,4) = 9.0 | 0.040 |
| Location 7 | ||
| Contrast 1 | F(1,4) = 191.2 | 2 × 10⁻⁴ |
| Contrast 2 | F(1,4) = 0.8 | 0.426 |
| Location 8 | ||
| Contrast 1 | F(1,4) = 31.0 | 0.005 |
| Contrast 2 | F(1,4) = 1.4 | 0.297 |
Repeated measures ANOVA was performed to investigate all possible main effects and interactions for LFP data obtained from a group of rats (n = 5) in which whisker C2 was studied, electrode array was aligned in only one direction, and recordings were obtained in two cortical layers before any transection (BT), after a side transection (ST) alongside the electrode array, and after a center transection (CT) between recording locations 4 and 5 (- - - - -). The ANOVA was followed by specific contrasts using C-matrix for, specifically, locations 4–8 to test differences between Transection conditions, whether the average of before transection and side transection is the same as center transection (Contrast 1), and whether before transection is the same as side transection (Contrast 2). Alpha level was set to 0.01, and Bonferroni adjustment applied to the alpha level to account for multiple testing with specific contrasts (adjusted alpha level = 0.001), with significant statistics in bold. Statistics for the main effects are summarized here but not for interactions because none were found significant except between Transection and Location (F(14,56) = 22.5, p = 2 × 10⁻¹³). See Materials and Methods for more details. As expected, the main effect Location was highly significant. More importantly, the main effect Transection was also highly significant. Complementary to the interaction found between Transection and Location, the specific contrasts were able to identify that differences existed specifically between center transection versus the average of before transection and side transection (Contrast 1) for recording locations 5–7. LFP magnitude for locations 5–7 after center transection was reduced to 6–7% of electrode 1, rendering LFP latency and slope determination unreliable under this condition and thus not analyzed further for the transection experiments.
To further confirm the existence of long-range horizontal connections, in another group (n = 8) the anterograde tract tracer biotinylated dextran amine (BDA) was microinjected into barrel cortex, toward either the central whisker C2 barrel (central injection) (Fig. 5B) or the border whisker A2 barrel (near border injection) (Figs. 4B,C, 5A). Confirming previous studies, for both injections we found dense projections targeting specific cortical areas such as SII (White and DeAmicis, 1977; Welker et al., 1988; Koralek and Killackey, 1990; Fabri and Burton, 1991; Kim and Ebner, 1999; Hoffer et al., 2003); dysgranular (Chapin et al., 1987; Hoeflinger et al., 1995; Kim and Ebner, 1999); perirhinal (Welker et al., 1988; Koralek and Killackey, 1990; Fabri and Burton, 1991) and motor cortex (Welker et al., 1988; Izraeli and Porter, 1995; Hoffer et al., 2003; Chakrabarti and Alloway, 2006; Ferezou et al., 2007). Moreover, congruent with previous reports (Bernardo et al., 1990; Hoeflinger et al., 1995; Aroniadou-Anderjaska and Keller, 1996; Keller and Carlson, 1999; Kim and Ebner, 1999; Hoffer et al., 2003), we found anisotropy in the distribution of axons and varicosities within barrel cortex, in which a higher density of varicosities was observed along the row of the injected barrels (data not shown). Besides the labeling found in the above mentioned known output areas (i.e., considered specific projections because of their targeting specific cortical areas), central injections labeled a progressively sparser gradient of long-range horizontal fibers surrounding the injection site whose distribution did not appear anisotropic and were considered nonspecific because they crossed the dysgranular area separating SCx from ACx and VCx, and entered into ACx and VCx (spanning >3 mm; Fig. 5B). Near border injections labeled a similar pattern of nonspecific fibers, also spanning >3 mm away from the injection site, but now observed deeper within ACx and VCx (Figs. 4B, 5A). Note for both whiskers the similarity between the extension and location of the spread of nonspecific fibers (Fig. 5) and that of recorded LFPs (Fig. 2). From the tracer experiments it can be concluded that sparse, nonspecific long-range horizontal axons originating from barrel cortex exist; they do not target main output areas, but rather cross and therefore ignore traditionally defined sensorimotor borders.
Figure 5.

Examples of border-crossing, long-range horizontal connections after BDA injections localized above A2 (A), C2 (B) barrels including part of their surrounding septa. Axons outlined were overlapped from 4 consecutive, 30 μm flattened brain slices of layers 2–3 (A) or from 4 consecutive slices from layers 2–3 and one of layer 5 (B) and superimposed on a layer IV scheme obtained from the same animal, showing barrels (black or gray small ellipses), and cortical borders (gray). Axons are shown relative to circles centered at the respective barrel and are similar to those shown in Figure 2. Circles were extrapolated based on percentage of rats with evoked SU at a given distance: 100% (smallest circle, = small dashed in Fig. 2); >50% (second smallest, = medium, solid in Fig. 2); and farthest electrode with measurable SU (second largest, = large, dashed in Fig. 2). Extrapolated largest circle is based on 100% of rats exhibiting evoked LFP at the farthest location (yellow, solid in Fig. 2). Scale bars, 500 μm.
Together, results from both transection and tracer experiments indicate the presence of long-range horizontal connections and their role in the long-range activation reported in the present study. These results further suggest that the spatial distribution of the horizontal connections is similar to the maximal size of the activated area.
Discussion
Characterizing the organization of sensorimotor cortex
Historically, the definition of cortical territories and the borders that separate them relied on cyto- or mylo-architectonic markers and were later complemented by combining evoked potentials and single unit recording techniques. In recent years, the pursuit of parcellating cortical organization has branched into two different research directions regarding the classical concepts of borders and parcellation of cortex. One direction continues to further parcellate traditionally defined unimodal cortical areas based on the use of new markers such as neurotransmitter receptors, (for review, see Zilles et al., 2004). The other, using neuronal recordings, focuses on the borders that separate neighboring unimodal areas, in which neurons have shown to respond to complementary multimodal stimulation (e.g., respond to both somatosensory and auditory stimuli at the border area between both modalities) (Wallace et al., 2004; Menzel and Barth, 2005), supporting the notion that such borders can be better described as smooth transition areas rather than demarcating lines between cortical modalities. Our findings, based on recording the entire area of evoked suprathreshold and subthreshold activation, introduce yet a third direction of research, one that puts forth the notion that beyond the well delineated, highly specific cytoarchitectonic organization of inputs to the cortex there can coexist large scale nonspecific activity spreads. Accordingly, the spatiotemporal relationship of rat somatosensory cortex could be described in the following manner: layer IV cytoarchitectonic map dictates the topography (somatotopy) of early and peak evoked cortical responses, whereas long-range horizontal connections emanating from peak activity location support the long-range symmetrical spread of subsequent evoked cortical activity, a spread that is not constrained by layer IV anatomical map. We therefore propose that functional long-range symmetry of cortical activity spreads also be considered a fundamental property of sensorimotor cortex. If so, two organizational rules seem to dictate the large scale functional organization of sensorimotor cortex: (1) somatotopy of peak activity; and (2) large-scale symmetrical spread surrounding such peak. Therefore, if our findings in somatosensory cortex can be generalized to other cortical modalities, with respect to activity spreading away from peak activity, the large scale organization of sensorimotor cortex could be described as one continuous functional sheet instead of a parceled entity.
We want to emphasize that such large scale nonspecific spread in activation need not negate the known specific organization of cortical function. Indeed, in optical imaging studies, specificity in evoked activity (e.g., specific barrel column responding to a specific whisker) could be extracted from large scale nonspecific activation simply by differential data processing of nonspecific but contrasting activation spreads (e.g., subtracting/dividing between the activation elicited by a single whisker vs by surrounding whiskers) in the same way that optical imaging of visual cortex in higher mammals enables visualization of ocular-dominance or orientation columns (i.e., subtracting one eye activation by the other, vertical-by-horizontal gratings, or other similar methods). In other words, large activation spreads (a.k.a. “global signal”) have already been reported for the visual cortex and it should be stressed that it is the difference (a.k.a. “mapping signal”) between contrasting large activation spreads that allows for the visualization of specific cortical organization such as dominance or orientation columns (Grinvald et al., 1986; Frostig et al., 1990; Ts'o et al., 1990). This is applicable even for regions of visual cortex exhibiting only subthreshold activation (Das and Gilbert, 1995). Therefore, specific mapping information is already contained within the large activation spreads, whose extraction requires additional steps such as subtraction between orthogonal stimuli (or similar techniques) or Fourier analysis using periodic stimulus delivery (Kalatsky and Stryker, 2003). We would also like to note that if we had studied only peak cortical responses, we would have obtained results clearly supporting the specificity in cortical functional organization, and the overall implication of the present study would have been quite different. Indeed, we have previously investigated only peak cortical responses (using high activity thresholds) and reported findings describing how barrel cortex exhibit classical structure-function relationship that also respect borders separating the different sensory cortices (Masino et al., 1993). By explicitly considering all evoked neuronal responses instead of only peak responses, here we are able to report large activity spreads for rat barrel cortex, regardless of whisker identity. Along with those reported for visual cortex (known for its functional specificity), the large activity spreads reported in the present study further support that a motif of large scale activation spreads is a fundamental principle of cortical functional organization. Furthermore, together with our anatomical findings, the large activity spreads reported here as well as by others support the notion that cortical organization can be both specific (e.g., topography of peak responses; projections to targeted areas) and nonspecific (e.g., large activation spreads; long-range horizontal projections that cross cytoarchitectonic borders). The coexistence of specific and nonspecific cortical organization is likely an underlying reason for the historically continuous and still ongoing debate between supporters of strong “localization” versus supporters of a more “holistic” organization of cortical functions (Finger, 1994).
The very large activation spreads described here are an extended example of Ramon y Cajal's “law of neuronal avalanche” in the transmission of a sensory stimulus from periphery to cortex, where “the number of neurons concerned in the conduction increases progressively from the periphery to the cerebrum” (Cajal, 1937), a law that was based on his observation of local collaterals originating from pyramidal cells in the cortex (Douglas and Martin, 2007). Expanding Cajal's view even further, lesion-induced degeneration studies in the visual cortex of monkeys showed the existence of a constant pattern of long-range projections (up to 5–6 mm) regardless of the lesion's location within the visual cortex. Further, when lesions were placed near the border between different cytoarchitectonic visual areas (e.g., areas 17, 18 in monkeys and cats) the same pattern of long-range projections was detected again and it clearly crossed the borders between these areas, findings that are similar to ours but still limited to one sensory modality (visual) rather than between different sensory modalities as is our case (Fisken et al., 1975). Although our large radial spread of suprathreshold evoked activity away from peak activity was somewhat variable between animals (Table 1; Fig. 2), the even larger radial spread of subthreshold activity remained surprisingly constant regardless of whisker identity, recording direction, or cortical layer (Table 1; Fig. 2), roughly corresponding in size to the underlying spread of horizontal connections. However, it should be noted that the constancy in size and symmetry need not rule out the potential for modulation. Although primarily focused on nearby evoked activation surrounding peak activity, previous studies have demonstrated that the area evoked by stimulation of a single whisker is dynamic and can be modulated by multiple factors including stimulus strength and frequency, interactions between simultaneously activated spreads, behavioral state of the animal, and history of whisker use, (for review, see Frostig, 2006). Thus, it remains to be elucidated which of these factors could also modulate the very large spread of subthreshold activity reported here.
Accumulated evidence using multiple techniques (intracellular and extracellular recordings; optical imaging based on voltage-sensitive dyes, optical imaging based on intrinsic signals, evoked potential mapping) have demonstrated large, frequently symmetric, areas of activation within barrel cortex after single whisker stimulation (Orbach et al., 1985; Grinvald et al., 1986; Armstrong-James and Fox, 1987; Kleinfeld and Delaney, 1996; Moore and Nelson, 1998; Ghazanfar and Nicolelis, 1999; Zhu and Connors, 1999; Brecht and Sakmann, 2002; Castro-Alamancos, 2002; Brecht et al., 2003; Derdikman et al., 2003; Devor et al., 2003, 2005; Higley and Contreras, 2003, 2005; Masino, 2003; Petersen et al., 2003; Ferezou et al., 2006, 2007; Chen-Bee et al., 2007); these findings are consistent with up to 3 mm long-range horizontal connections found within barrel cortex (Keller and Carlson, 1999). In some cases evoked activity by a single whisker could even extend beyond the borders of barrel cortex (Di et al., 1994; Brett-Green et al., 2001, 2003; Menzel and Barth, 2005). Our current findings expand on these previous reports by demonstrating that even suprathreshold activation can spread into cortical territories of other modalities, and that subthreshold activation is so large that it can spread deeply and simultaneously into those territories, a spread that seems to correspond in size to the underlying spread of long-range horizontal projections into multiple cortical territories of different modalities. It remains to be determined how these large areas of activation integrate with cortical activation based on feedforward and feedback projections through white matter that connect to subcortical areas, higher cortical areas and the contralateral hemisphere.
Potential implications of organizing sensorimotor cortex based on a motif of large, symmetrical, overlapping activity spreads
Because the distance between peak locations of neighboring activity spreads is much smaller relative to the extent of radial activity spread away from peak activity (e.g., peaks above neighboring barrels separated by 0.4 vs 3.5 mm radius of the subthreshold activation area) (Fig. 2), a high degree of spatial overlap can exist between activity spreads, an overlap decreasing with increasing distance between peak locations. Organizing sensorimotor cortex according to a motif of overlapping activity spreads, even between those from different modalities, could prove advantageous in several ways. There is growing evidence in recent years suggesting multimodal integration occurring already at early levels of cortical sensorimotor processing including primates and humans (for review, see Calvert et al., 2004; Schroeder and Foxe, 2005; Bulkin and Groh, 2006; Ghazanfar and Schroeder, 2006; Macaluso, 2006). The overlap of activity spreads between different modalities as reported here would offer a means through which such multimodal interactions can occur. Overlapping activity spreads could also provide a widespread scaffold for recovery and reorganization of cortical function following peripheral or central damage. For example, within a cortical area, the shutting down of input from a damaged peripheral area could subsequently “unmask” activity evoked by inputs from intact peripheral areas. Reciprocally, input from a given peripheral area that can no longer evoke activity in a damaged cortical area still has the opportunity to evoke activity in neighboring intact cortical areas. Overlapping activity spreads could also provide an underlying mechanism for plasticity and associative learning, assuming that a larger overlap implies higher probability, or opportunity, for interactions. Accordingly, the overlap of activity spreads would allow functional interactions between them, with a decreasing gradient for the probability of interactions with increasing separation of activity spreads because of decreasing overlap. Nevertheless, the very large size of activity spreads would ensure that even two activity spreads far apart (within or between modalities) have some degree of overlap and should therefore offer small probability of interaction that could be strengthened under the right conditions.
Interestingly, the notion of activity spreads as a potential underlying mechanism for plasticity and associative learning is reminiscent of Pavlov's original speculation regarding the spread of cortical excitation as the mechanism underlying associative learning. Pavlov observed that, when a particular conditioned stimulus (CS; e.g., pure tone or circumscribed tactile stimulus) had been associated to a conditioned response, animals also responded to other stimuli similar to the CS (e.g., other pure tones or tactile stimuli). Pavlov speculated that the effectiveness of any given stimulus in eliciting such response declined in proportion to its cortical distance from the representation of the trained stimulus, a phenomenon known as “stimulus-generalization gradient.” By assuming that every stimulus produces excitation in a particular cortical area and that similar stimuli activate physically adjacent cortical areas, he explained his results using the concept of “automatic irradiation.” He posited that when a CS is presented and paired with an unconditioned stimulus (US), excitation in the brain area corresponding to the CS irradiates to adjacent brain locations representing similar CS, causing a gradient of generalized associations, which will become progressively weaker with increasing distance from the center of excitation (Pavlov, 1927). Our large activity spreads, decaying over cortical distance, could provide a mechanism underlying such “automatic irradiation.” More research is required to establish and refine our understanding on the relationship between cortical excitatory gradients and their behavioral correlates.
In conclusion, our results suggest another level of organization for sensorimotor cortex, one characterized by large-scale highly overlapping symmetrical activation spreads radiating in a decreasing gradient away from peak activity locations and ignoring functional and anatomical borders. These activity spreads correspond approximately in size to the underlying spread of horizontal connections emanating from peak activity locations. This organizational motif of sensorimotor cortex, one that can coexist with more specific cortical organization, could subserve several functions. Activity spreads within a sensory modality could explain stimulus generalization, whereas overlap of activity spreads from different modalities could support early multimodal integration. Furthermore, modulation of activity spreads could allow associative learning. Finally, activity spreads could provide a widespread scaffold for recovery and reorganization of cortical function after peripheral or central injury.
Footnotes
This work was supported by the National Institute of Neurological Disorders and Stroke–National Institutes of Health Grants NS-43165, NS-48350, and NS-055832. We thank Drs. R. Metherate and K. Cramer for use of their equipment, Drs. T. Carew and N. Weinberger for critical reading of this manuscript, T. Agoncillo for assistance with imaging, and D. Phan, L. Mai, N. Tran, P. Dang, C. Chan, and D. Quach for assistance with histology.
References
- Abeles M. Quantification, smoothing, and confidence limits for single-units' histograms. J Neurosci Methods. 1982;5:317–325. doi: 10.1016/0165-0270(82)90002-4. [DOI] [PubMed] [Google Scholar]
- Armstrong-James M, Fox K. Spatiotemporal convergence and divergence in the rat S1 “barrel” cortex. J Comp Neurol. 1987;263:265–281. doi: 10.1002/cne.902630209. [DOI] [PubMed] [Google Scholar]
- Aroniadou-Anderjaska V, Keller A. Intrinsic inhibitory pathways in mouse barrel cortex. Neuroreport. 1996;7:2363–2368. doi: 10.1097/00001756-199610020-00017. [DOI] [PubMed] [Google Scholar]
- Bair W. Visual receptive field organization. Curr Opin Neurobiol. 2005;15:459–464. doi: 10.1016/j.conb.2005.07.006. [DOI] [PubMed] [Google Scholar]
- Benison AM, Ard TD, Crosby AM, Barth DS. Temporal patterns of field potentials in vibrissa/barrel cortex reveal stimulus orientation and shape. J Neurophysiol. 2006;95:2242–2251. doi: 10.1152/jn.01034.2005. [DOI] [PubMed] [Google Scholar]
- Bernardo KL, McCasland JS, Woolsey TA, Strominger RN. Local intra- and interlaminar connections in mouse barrel cortex. J Comp Neurol. 1990;291:231–255. doi: 10.1002/cne.902910207. [DOI] [PubMed] [Google Scholar]
- Brecht M, Sakmann B. Dynamic representation of whisker deflection by synaptic potentials in spiny stellate and pyramidal cells in the barrels and septa of layer 4 rat somatosensory cortex. J Physiol. 2002;543:49–70. doi: 10.1113/jphysiol.2002.018465. [DOI] [PMC free article] [PubMed] [Google Scholar]
- Brecht M, Roth A, Sakmann B. Dynamic receptive fields of reconstructed pyramidal cells in layers 3 and 2 of rat somatosensory barrel cortex. J Physiol. 2003;553:243–265. doi: 10.1113/jphysiol.2003.044222. [DOI] [PMC free article] [PubMed] [Google Scholar]
- Brett-Green B, Fifková E, Larue DT, Winer JA, Barth DS. A multisensory zone in rat parietotemporal cortex: intra- and extracellular physiology and thalamocortical connections. J Comp Neurol. 2003;460:223–237. doi: 10.1002/cne.10637. [DOI] [PubMed] [Google Scholar]
- Brett-Green BA, Chen-Bee CH, Frostig RD. Comparing the functional representations of central and border whiskers in rat primary somatosensory cortex. J Neurosci. 2001;21:9944–9954. doi: 10.1523/JNEUROSCI.21-24-09944.2001. [DOI] [PMC free article] [PubMed] [Google Scholar]
- Bulkin DA, Groh JM. Seeing sounds: visual and auditory interactions in the brain. Curr Opin Neurobiol. 2006;16:415–419. doi: 10.1016/j.conb.2006.06.008. [DOI] [PubMed] [Google Scholar]
- Cajal SR. Recollections of my life. Philadelphia: American Philosophical Society; 1937. [Google Scholar]
- Calvert GA, Spence C, Stein BE. The handbook of multisensory processes. Cambridge, MA: MIT; 2004. [Google Scholar]
- Castro-Alamancos MA. Role of thalamocortical sensory suppression during arousal: focusing sensory inputs in neocortex. J Neurosci. 2002;22:9651–9655. doi: 10.1523/JNEUROSCI.22-22-09651.2002. [DOI] [PMC free article] [PubMed] [Google Scholar]
- Chakrabarti S, Alloway KD. Differential origin of projections from SI barrel cortex to the whisker representations in SII and MI. J Comp Neurol. 2006;498:624–636. doi: 10.1002/cne.21052. [DOI] [PubMed] [Google Scholar]
- Chapin JK, Sadeq M, Guise JL. Corticocortical connections within the primary somatosensory cortex of the rat. J Comp Neurol. 1987;263:326–346. doi: 10.1002/cne.902630303. [DOI] [PubMed] [Google Scholar]
- Chen-Bee CH, Agoncillo T, Xiong Y, Frostig RD. The triphasic intrinsic signal: implications for functional imaging. J Neurosci. 2007;27:4572–4586. doi: 10.1523/JNEUROSCI.0326-07.2007. [DOI] [PMC free article] [PubMed] [Google Scholar]
- Das A, Gilbert CD. Long-range horizontal connections and their role in cortical reorganization revealed by optical recording of cat primary visual cortex [see comments] Nature. 1995;375:780–784. doi: 10.1038/375780a0. [DOI] [PubMed] [Google Scholar]
- Derdikman D, Hildesheim R, Ahissar E, Arieli A, Grinvald A. Imaging spatiotemporal dynamics of surround inhibition in the barrels somatosensory cortex. J Neurosci. 2003;23:3100–3105. doi: 10.1523/JNEUROSCI.23-08-03100.2003. [DOI] [PMC free article] [PubMed] [Google Scholar]
- Devor A, Dunn AK, Andermann ML, Ulbert I, Boas DA, Dale AM. Coupling of total hemoglobin concentration, oxygenation, and neural activity in rat somatosensory cortex. Neuron. 2003;39:353–359. doi: 10.1016/s0896-6273(03)00403-3. [DOI] [PubMed] [Google Scholar]
- Devor A, Ulbert I, Dunn AK, Narayanan SN, Jones SR, Andermann ML, Boas DA, Dale AM. Coupling of the cortical hemodynamic response to cortical and thalamic neuronal activity. Proc Natl Acad Sci U S A. 2005;102:3822–3827. doi: 10.1073/pnas.0407789102. [DOI] [PMC free article] [PubMed] [Google Scholar]
- Di S, Brett B, Barth DS. Polysensory evoked potentials in rat parietotemporal cortex: combined auditory and somatosensory responses. Brain Res. 1994;642:267–280. doi: 10.1016/0006-8993(94)90931-8. [DOI] [PubMed] [Google Scholar]
- Douglas RJ, Martin KA. The butterfly and the loom. Brain Res Rev. 2007;55:314–328. doi: 10.1016/j.brainresrev.2007.04.011. [DOI] [PubMed] [Google Scholar]
- Fabri M, Burton H. Ipsilateral cortical connections of primary somatic sensory cortex in rats. J Comp Neurol. 1991;311:405–424. doi: 10.1002/cne.903110310. [DOI] [PubMed] [Google Scholar]
- Ferezou I, Bolea S, Petersen CC. Visualizing the cortical representation of whisker touch: voltage-sensitive dye imaging in freely moving mice. Neuron. 2006;50:617–629. doi: 10.1016/j.neuron.2006.03.043. [DOI] [PubMed] [Google Scholar]
- Ferezou I, Haiss F, Gentet LJ, Aronoff R, Weber B, Petersen CC. Spatiotemporal dynamics of cortical sensorimotor integration in behaving mice. Neuron. 2007;56:907–923. doi: 10.1016/j.neuron.2007.10.007. [DOI] [PubMed] [Google Scholar]
- Finger S. Origins of neuroscience. New York: Oxford UP; 1994. [Google Scholar]
- Fisken RA, Garey LJ, Powell TP. The intrinsic, association and commissural connections of area 17 on the visual cortex. Philos Trans R Soc Lond B Biol Sci. 1975;272:487–536. doi: 10.1098/rstb.1975.0099. [DOI] [PubMed] [Google Scholar]
- Frostig RD. Functional organization and plasticity in the adult rat barrel cortex: moving out-of-the-box. Curr Opin Neurobiol. 2006;16:445–450. doi: 10.1016/j.conb.2006.06.001. [DOI] [PubMed] [Google Scholar]
- Frostig RD, Lieke EE, Ts'o DY, Grinvald A. Cortical functional architecture and local coupling between neuronal activity and the microcirculation revealed by in vivo high-resolution optical imaging of intrinsic signals. Proc Natl Acad Sci U S A. 1990;87:6082–6086. doi: 10.1073/pnas.87.16.6082. [DOI] [PMC free article] [PubMed] [Google Scholar]
- Ganguly K, Kleinfeld D. Goal-directed whisking increases phase-locking between vibrissa movement and electrical activity in primary sensory cortex in rat. Proc Natl Acad Sci U S A. 2004;101:12348–12353. doi: 10.1073/pnas.0308470101. [DOI] [PMC free article] [PubMed] [Google Scholar]
- Ghazanfar AA, Nicolelis MA. Spatiotemporal properties of layer V neurons of the rat primary somatosensory cortex. Cereb Cortex. 1999;9:348–361. doi: 10.1093/cercor/9.4.348. [DOI] [PubMed] [Google Scholar]
- Ghazanfar AA, Schroeder CE. Is neocortex essentially multisensory? Trends Cogn Sci. 2006;10:278–285. doi: 10.1016/j.tics.2006.04.008. [DOI] [PubMed] [Google Scholar]
- Grinvald A, Hildesheim R. VSDI: a new era in functional imaging of cortical dynamics. Nat Rev Neurosci. 2004;5:874–885. doi: 10.1038/nrn1536. [DOI] [PubMed] [Google Scholar]
- Grinvald A, Lieke E, Frostig RD, Gilbert CD, Wiesel TN. Functional architecture of cortex revealed by optical imaging of intrinsic signals. Nature. 1986;324:361–364. doi: 10.1038/324361a0. [DOI] [PubMed] [Google Scholar]
- Higley MJ, Contreras D. Nonlinear integration of sensory responses in the rat barrel cortex: an intracellular study in vivo. J Neurosci. 2003;23:10190–10200. doi: 10.1523/JNEUROSCI.23-32-10190.2003. [DOI] [PMC free article] [PubMed] [Google Scholar]
- Higley MJ, Contreras D. Integration of synaptic responses to neighboring whiskers in rat barrel cortex in vivo. J Neurophysiol. 2005;93:1920–1934. doi: 10.1152/jn.00917.2004. [DOI] [PubMed] [Google Scholar]
- Hoeflinger BF, Bennett-Clarke CA, Chiaia NL, Killackey HP, Rhoades RW. Patterning of local intracortical projections within the vibrissae representation of rat primary somatosensory cortex. J Comp Neurol. 1995;354:551–563. doi: 10.1002/cne.903540406. [DOI] [PubMed] [Google Scholar]
- Hoffer ZS, Hoover JE, Alloway KD. Sensorimotor corticocortical projections from rat barrel cortex have an anisotropic organization that facilitates integration of inputs from whiskers in the same row. J Comp Neurol. 2003;466:525–544. doi: 10.1002/cne.10895. [DOI] [PubMed] [Google Scholar]
- Izraeli R, Porter LL. Vibrissal motor cortex in the rat: connections with the barrel field. Exp Brain Res. 1995;104:41–54. doi: 10.1007/BF00229854. [DOI] [PubMed] [Google Scholar]
- Jancke D, Chavane F, Naaman S, Grinvald A. Imaging cortical correlates of illusion in early visual cortex. Nature. 2004;428:423–426. doi: 10.1038/nature02396. [DOI] [PubMed] [Google Scholar]
- Kaas JH, Collins CE. The organization of sensory cortex. Curr Opin Neurobiol. 2001;11:498–504. doi: 10.1016/s0959-4388(00)00240-3. [DOI] [PubMed] [Google Scholar]
- Kalatsky VA, Stryker MP. New paradigm for optical imaging: temporally encoded maps of intrinsic signal. Neuron. 2003;38:529–545. doi: 10.1016/s0896-6273(03)00286-1. [DOI] [PubMed] [Google Scholar]
- Keller A, Carlson GC. Neonatal whisker clipping alters intracortical, but not thalamocortical projections, in rat barrel cortex. J Comp Neurol. 1999;412:83–94. doi: 10.1002/(sici)1096-9861(19990913)412:1<83::aid-cne6>3.0.co;2-7. [DOI] [PubMed] [Google Scholar]
- Kim U, Ebner FF. Barrels and septa: separate circuits in rat barrels field cortex. J Comp Neurol. 1999;408:489–505. [PubMed] [Google Scholar]
- Kleinfeld D, Delaney KR. Distributed representation of vibrissa movement in the upper layers of somatosensory cortex revealed with voltage-sensitive dyes [published erratum appears in J Comp Neurol 378:594] J Comp Neurol. 1996;375:89–108. doi: 10.1002/(SICI)1096-9861(19961104)375:1<89::AID-CNE6>3.0.CO;2-K. [DOI] [PubMed] [Google Scholar]
- Koralek KA, Killackey HP. Callosal projections in rat somatosensory cortex are altered by early removal of afferent input. Proc Natl Acad Sci U S A. 1990;87:1396–1400. doi: 10.1073/pnas.87.4.1396. [DOI] [PMC free article] [PubMed] [Google Scholar]
- Liu J, Newsome WT. Local field potential in cortical area MT: stimulus tuning and behavioral correlations. J Neurosci. 2006;26:7779–7790. doi: 10.1523/JNEUROSCI.5052-05.2006. [DOI] [PMC free article] [PubMed] [Google Scholar]
- Logothetis NK, Pauls J, Augath M, Trinath T, Oeltermann A. Neurophysiological investigation of the basis of the fMRI signal. Nature. 2001;412:150–157. doi: 10.1038/35084005. [DOI] [PubMed] [Google Scholar]
- Macaluso E. Multisensory processing in sensory-specific cortical areas. Neuroscientist. 2006;12:327–338. doi: 10.1177/1073858406287908. [DOI] [PubMed] [Google Scholar]
- Masino SA. Quantitative comparison between functional imaging and single-unit spiking in rat somatosensory cortex. J Neurophysiol. 2003;89:1702–1712. doi: 10.1152/jn.00860.2002. [DOI] [PubMed] [Google Scholar]
- Masino SA, Kwon MC, Dory Y, Frostig RD. Characterization of functional organization within rat barrel cortex using intrinsic signal optical imaging through a thinned skull. Proc Natl Acad Sci U S A. 1993;90:9998–10002. doi: 10.1073/pnas.90.21.9998. [DOI] [PMC free article] [PubMed] [Google Scholar]
- Menzel RR, Barth DS. Multisensory and secondary somatosensory cortex in the rat. Cereb Cortex. 2005;15:1690–1696. doi: 10.1093/cercor/bhi045. [DOI] [PubMed] [Google Scholar]
- Moore CI, Nelson SB. Spatio-temporal subthreshold receptive fields in the vibrissa representation of rat primary somatosensory cortex. J Neurophysiol. 1998;80:2882–2892. doi: 10.1152/jn.1998.80.6.2882. [DOI] [PubMed] [Google Scholar]
- Niessing J, Ebisch B, Schmidt KE, Niessing M, Singer W, Galuske RA. Hemodynamic signals correlate tightly with synchronized gamma oscillations. Science. 2005;309:948–951. doi: 10.1126/science.1110948. [DOI] [PubMed] [Google Scholar]
- Nunez PL, Srinivasan R. Electric fields of the brain: the neurophysics of EEG. Ed 2. Oxford: Oxford UP; 2006. [Google Scholar]
- Orbach HS, Cohen LB, Grinvald A. Optical mapping of electrical activity in rat somatosensory and visual cortex. J Neurosci. 1985;5:1886–1895. doi: 10.1523/JNEUROSCI.05-07-01886.1985. [DOI] [PMC free article] [PubMed] [Google Scholar]
- Pavlov IP. London: Oxford UP; 1927. Conditioned reflexes: an investigation of the physiological activity of the cerebral cortex. [DOI] [PMC free article] [PubMed] [Google Scholar]
- Petersen CC, Grinvald A, Sakmann B. Spatiotemporal dynamics of sensory responses in layer 2/3 of rat barrel cortex measured in vivo by voltage-sensitive dye imaging combined with whole-cell voltage recordings and neuron reconstructions. J Neurosci. 2003;23:1298–1309. doi: 10.1523/JNEUROSCI.23-04-01298.2003. [DOI] [PMC free article] [PubMed] [Google Scholar]
- Reiner A, Veenman CL, Medina L, Jiao Y, Del Mar N, Honig MG. Pathway tracing using biotinylated dextran amines. J Neurosci Methods. 2000;103:23–37. doi: 10.1016/s0165-0270(00)00293-4. [DOI] [PubMed] [Google Scholar]
- Rosa MG, Tweedale R. Brain maps, great and small: lessons from comparative studies of primate visual cortical organization. Philos Trans R Soc Lond B Biol Sci. 2005;360:665–691. doi: 10.1098/rstb.2005.1626. [DOI] [PMC free article] [PubMed] [Google Scholar]
- Scherberger H, Jarvis MR, Andersen RA. Cortical local field potential encodes movement intentions in the posterior parietal cortex. Neuron. 2005;46:347–354. doi: 10.1016/j.neuron.2005.03.004. [DOI] [PubMed] [Google Scholar]
- Schroeder CE, Foxe J. Multisensory contributions to low-level, ‘unisensory’ processing. Curr Opin Neurobiol. 2005;15:454–458. doi: 10.1016/j.conb.2005.06.008. [DOI] [PubMed] [Google Scholar]
- Staba RJ, Ard TD, Benison AM, Barth DS. Intracortical pathways mediate nonlinear fast oscillation (>200 Hz) interactions within rat barrel cortex. J Neurophysiol. 2005;93:2934–2939. doi: 10.1152/jn.01101.2004. [DOI] [PubMed] [Google Scholar]
- Ts'o DY, Frostig RD, Lieke EE, Grinvald A. Functional organization of primate visual cortex revealed by high resolution optical imaging. Science. 1990;249:417–420. doi: 10.1126/science.2165630. [DOI] [PubMed] [Google Scholar]
- Wallace MN. Histochemical demonstration of sensory maps in the rat and mouse cerebral cortex. Brain Res. 1987;418:178–182. doi: 10.1016/0006-8993(87)90977-2. [DOI] [PubMed] [Google Scholar]
- Wallace MT, Ramachandran R, Stein BE. A revised view of sensory cortical parcellation. Proc Natl Acad Sci U S A. 2004;101:2167–2172. doi: 10.1073/pnas.0305697101. [DOI] [PMC free article] [PubMed] [Google Scholar]
- Welker E, Hoogland PV, Van der Loos H. Organization of feedback and feedforward projections of the barrel cortex: a PHA-L study in the mouse. Exp Brain Res. 1988;73:411–435. doi: 10.1007/BF00248234. [DOI] [PubMed] [Google Scholar]
- White EL, DeAmicis RA. Afferent and efferent projections of the region in mouse SmL cortex which contains the posteromedial barrel subfield. J Comp Neurol. 1977;175:455–482. doi: 10.1002/cne.901750405. [DOI] [PubMed] [Google Scholar]
- Wong-Riley MT, Welt C. Histochemical changes in cytochrome oxidase of cortical barrels after vibrissal removal in neonatal and adult mice. Proc Natl Acad Sci U S A. 1980;77:2333–2337. doi: 10.1073/pnas.77.4.2333. [DOI] [PMC free article] [PubMed] [Google Scholar]
- Woolsey TA, Van der Loos H. The structural organization of layer IV in the somatosensory region (SI) of mouse cerebral cortex. The description of a cortical field composed of discrete cytoarchitectonic units. Brain Res. 1970;17:205–242. doi: 10.1016/0006-8993(70)90079-x. [DOI] [PubMed] [Google Scholar]
- Zeki S. The Ferrier Lecture 1995 behind the seen: the functional specialization of the brain in space and time. Philos Trans R Soc Lond B Biol Sci. 2005;360:1145–1183. doi: 10.1098/rstb.2005.1666. [DOI] [PMC free article] [PubMed] [Google Scholar]
- Zhu JJ, Connors BW. Intrinsic firing patterns and whisker-evoked synaptic responses of neurons in the rat barrel cortex. J Neurophysiol. 1999;81:1171–1183. doi: 10.1152/jn.1999.81.3.1171. [DOI] [PubMed] [Google Scholar]
- Zilles K, Palomero-Gallagher N, Schleicher A. Transmitter receptors and functional anatomy of the cerebral cortex. J Anat. 2004;205:417–432. doi: 10.1111/j.0021-8782.2004.00357.x. [DOI] [PMC free article] [PubMed] [Google Scholar]