Abstract
Objective
To test the hypothesis that tooth location affected the microbial composition of supragingival plaque beyond the effect due to plaque mass as reflected by total DNA probe count.
Methods
Supragingival plaque samples were taken from the mesiobuccal aspect of each tooth in 187 subjects at baseline (N samples = 4,745). All samples were individually analyzed for their content of 40 bacterial species using checkerboard DNA-DNA hybridization. Significance of differences in mean species counts and proportions were determined among tooth surfaces and 6 tooth type categories: molars, bicuspids, incisors/canines in the mandible and maxilla separately using the Kruskal Wallis test. Stepwise multiple linear regression was employed to examine the relationship between species proportions and total DNA probe count, tooth location, periodontal and smoking status, age and gender.
Results
All species differed significantly among tooth types and among the 6 tooth categories. Higher plaque levels were seen at molars and lower incisors. Some differences observed between tooth types could be partially explained by the level of plaque. Teeth with high plaque mass exhibited high levels of Capnocytophaga gingivalis, Actinomyces naeslundii genospecies 2, Campylobacter rectus and Campylobacter showae. However, certain species such as Veillonella parvula and Streptococcus sanguinis differed significantly at different tooth locations despite similarities in plaque mass. Twenty of the test species exhibited a significant association with tooth location after adjusting for total DNA probe count and subject level factors.
Conclusion
While plaque mass was associated with differences in proportions of many species in supragingival biofilms, tooth location also was strongly associated with species proportions in both univariate and multivariate analyses.
Keywords: Bacteria, supragingival plaque, tooth type, plaque mass
Introduction
Even casual inspection of the human oral dentition reveals that there are marked differences in the amount of supragingival plaque that may be observed in different intraoral locations. In part this may be due to the ability and desire of subjects to clean their most visible teeth, the upper anteriors, and their inability to adequately clean molar segments in both the mandible and maxilla. The amount of plaque on these surfaces may also be influenced by proximity to the orifice of salivary gland ducts and by the effect of chewing and the movements of the soft tissues. In previous publications we described the detection of microbial complexes in supragingival biofilms (1) and the relationship of plaque mass to the composition of supragingival biofilms (2). The question arose as to whether tooth location would influence the composition of the colonizing species in supragingival biofilms and whether this was due to the total biofilm mass at the sampled site. The purpose of the present investigation was to test the hypothesis that tooth location affected the microbial composition of supragingival plaque beyond the effect due to plaque mass as reflected by total DNA probe count.
Material and Methods
Subject population, clinical monitoring and microbiological assessment
The subject population, clinical monitoring, sample taking and microbial enumeration were described previously (2). In brief, 187 subjects ranging in age from 22 – 74 years who were considered to be periodontally healthy (N = 38) or with evidence of prior periodontal attachment loss (N = 149) were selected for study. The study was approved by The Forsyth Institute Institutional Review Board and all subjects provided signed informed consent. All subjects were clinically monitored at baseline. Plaque accumulation (0/1), overt gingivitis (0/1), bleeding on probing (0/1), probing pocket depth and probing attachment level were measured at 6 sites per tooth (mesiobuccal, buccal, distobuccal, distolingual, lingual and mesiolingual) at all teeth excluding third molars.
Supragingival biofilm samples were taken by either of 2 calibrated examiners from the mesial surface of each tooth (excluding third molars) using individual sterile Gracey curettes and analyzed for their content of 40 bacterial species using checkerboard DNA-DNA hybridization (3, 4). A total of 4,745 supragingival biofilm samples were evaluated.
Data analysis
Available microbiological data included the counts and proportions of each of 40 test species from 4,745 supragingival plaque samples obtained at a baseline visit from 187 subjects (mean 25.4 samples per subject). The data were subset according to tooth categories: upper molars, upper bicuspids, upper incisors/canines, lower molars, lower bicuspids, lower incisors/canines. Data for each species for each tooth type category were averaged within a subject and then across subjects for each tooth type category separately. Significance of differences of mean species counts and proportions among tooth categories was determined using the Kruskal Wallis test and adjusted for 40 comparisons (5). The samples were also subset into 3 groups at the quartiles of the total DNA probe counts. The data for each species for each quartile group were averaged within a subject and then across subjects in each quartile category separately. The significance of differences among the mean proportions of each of the test species among the 3 plaque mass groups was compared in each tooth category separately. The mean counts and proportions at each of the 14 maxillary and 14 mandibular sample sites were computed and the data summarized graphically.
Clinical parameters were averaged within a subject for each tooth type category and then averaged across subjects for the 6 tooth type categories separately. The significance of differences in mean clinical parameters among the 6 tooth type categories was determined using the Kruskal Wallis test. In addition, the mean clinical features were compared at sampled sites subset according to the total DNA probe count quartile groups for each of the 6 tooth type categories separately.
Stepwise multiple linear regression was used to examine the relationship between the outcome variable, species proportions, and the predictor variables total DNA probe count, tooth location, (described by 0/1 dummy variable for tooth type category), age, gender, smoking status (current or non smoker), periodontal status (health or periodontitis). The data were averaged for each tooth category in each subject prior to stepwise multiple linear regression analysis.
Results
Species counts at different teeth
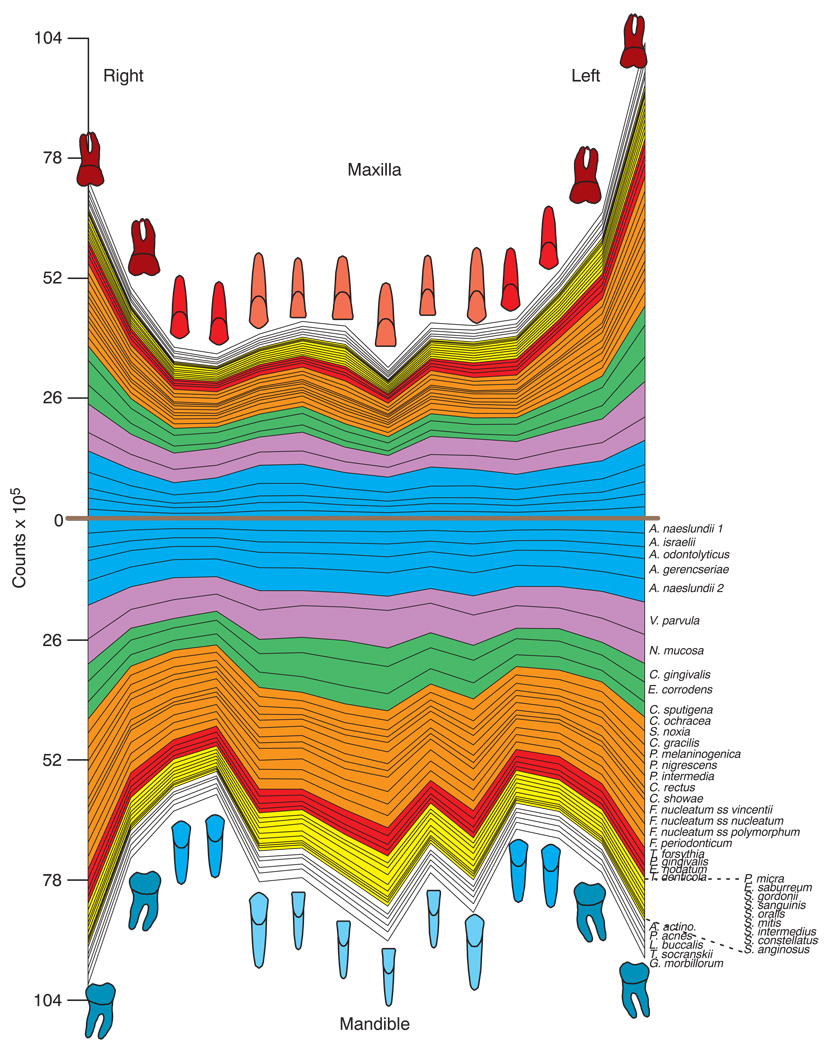
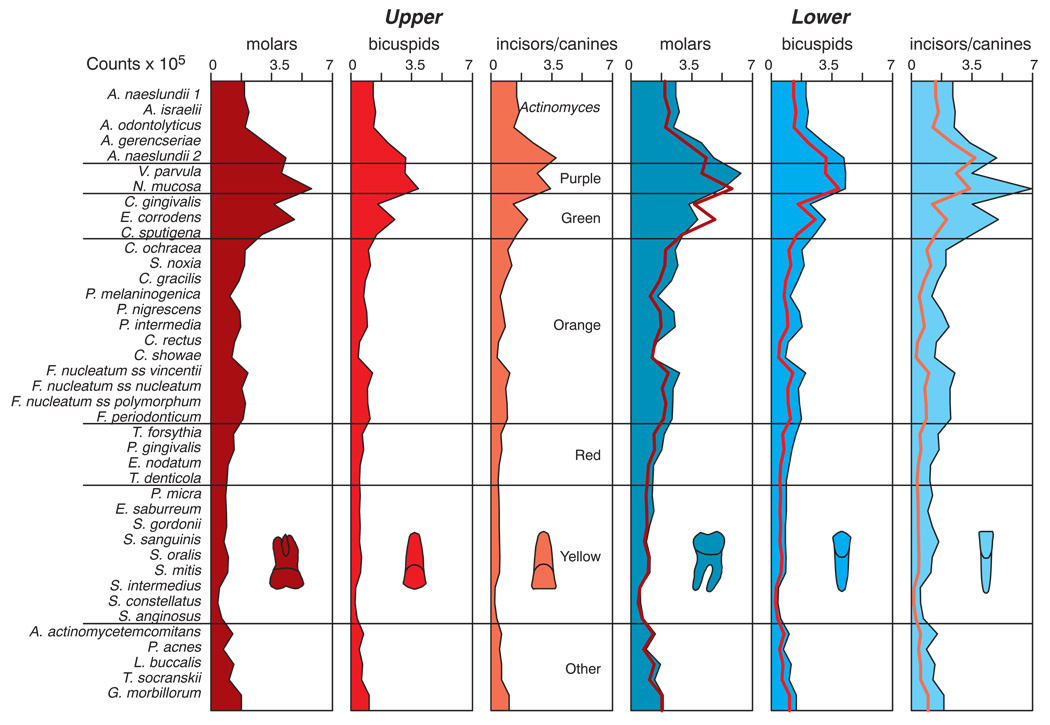
The mean counts of each of the 40 test species at each tooth site are presented in Fig. 1. All species counts differed significantly across tooth types. Higher mean counts were found for virtually all of the test species in samples from teeth in the lower jaw compared with samples from the corresponding upper teeth. The highest mean total counts were found at the lower molar and lower incisor/canine sites as well as the upper left molar sites. The mean counts (× 105) of the 40 test species at the 6 tooth type categories are presented in Fig. 2. All species differed significantly among tooth type categories even after adjusting for 40 comparisons (p < 0.001). In the upper jaw, mean counts were higher at molar sites and lowest at incisor/canine sites. In the lower jaw, counts were more comparable among the tooth type categories. In general, purple and green complex species and Actinomyces species were in the highest mean counts irrespective of sample location. Red and orange complex species were in higher mean counts at upper and lower molar sites as well as at the lower incisors/canines. When comparing the same tooth types in the upper and lower jaws, it was found that mean counts of all 40 test species were significantly higher (p < 0.001) in samples from lower bicuspids and lower incisors/canines compared with samples from the same upper tooth type. The differences in mean species counts were less marked in samples from upper and lower molars where 23/40 test species were significantly different between groups (p < 0.05).
Fig 1.
Mean counts (× 105) of 40 test species in supragingival biofilm samples from the mesiobuccal surface of each tooth of 187 subjects. The upper panel represents the maxilla and the lower panel the mandible. Species counts were averaged across subjects for each tooth separately. All species differed significantly among teeth at p < 0.001 (Kruskal Wallis test) after adjusting for 40 comparisons (5). The species were ordered and color-coded according to supragingival microbial complexes (1). In this cumulative plot, the total height at each sample location provides the mean total DNA probe count at that site. The cartoons of each tooth are presented to depict the location of each tooth sample. The full genus and species names of the 40 taxa listed in the Fig. are as follows: Actinomyces naeslundii genospecies 1, Actinomyces israelii, Actinomyces odontolyticus, Actinomyces gerencseriae, Actinomyces naeslundii genospecies 2, Veillonella parvula, Neisseria mucosa, Capnocytophaga gingivalis, Eikenella corrodens, Capnocytophaga sputigena, Capnocytophaga ochracea, Selenomonas noxia, Campylobacter gracilis, Prevotella melaninogenica, Prevotella nigrescens, Prevotella intermedia, Campylobacter rectus, Campylobacter showae, Fusobacterium nucleatum subspecies vincentii, Fusobacterium nucleatum subspecies nucleatum, Fusobacterium nucleatum subspecies polymorphum, Fusobacterium periodonticum, Tannerella forsythia, Porphyromonas gingivalis, Eubacterium nodatum, Treponema denticola, Parvimonas micra, Eubacterium saburreum, Streptococcus gordonii, Streptococcus sanguinis, Streptococcus oralis, Streptococcus mitis, Streptococcus intermedius, Streptococcus constellatus, Streptococcus anginosus, Aggregatibacter actinomycetemcomitans, Propionibacterium acnes, Leptotrichia buccalis, Treponema socranskii, Gemella morbillorum.
Fig 2.
Mean counts (× 105) of 40 test species in supragingival biofilm samples for teeth categorized according to intra-oral location. The species were averaged for each tooth type category in each subject and then averaged across subjects in each tooth category separately. Significance of differences among tooth type categories for each of the test species was determined using the Kruskal Wallis test and adjusted for 40 comparisons. All species differed significantly among tooth categories (p < 0.001). The species were ordered according to supragingival microbial complexes (1). To aid in comparing upper and lower tooth profiles, the microbial profiles of the upper tooth categories are depicted as red lines superimposed on the panels of the corresponding lower tooth types (last 3 panels).
Relation of total DNA probe count and tooth type category to periodontal parameters
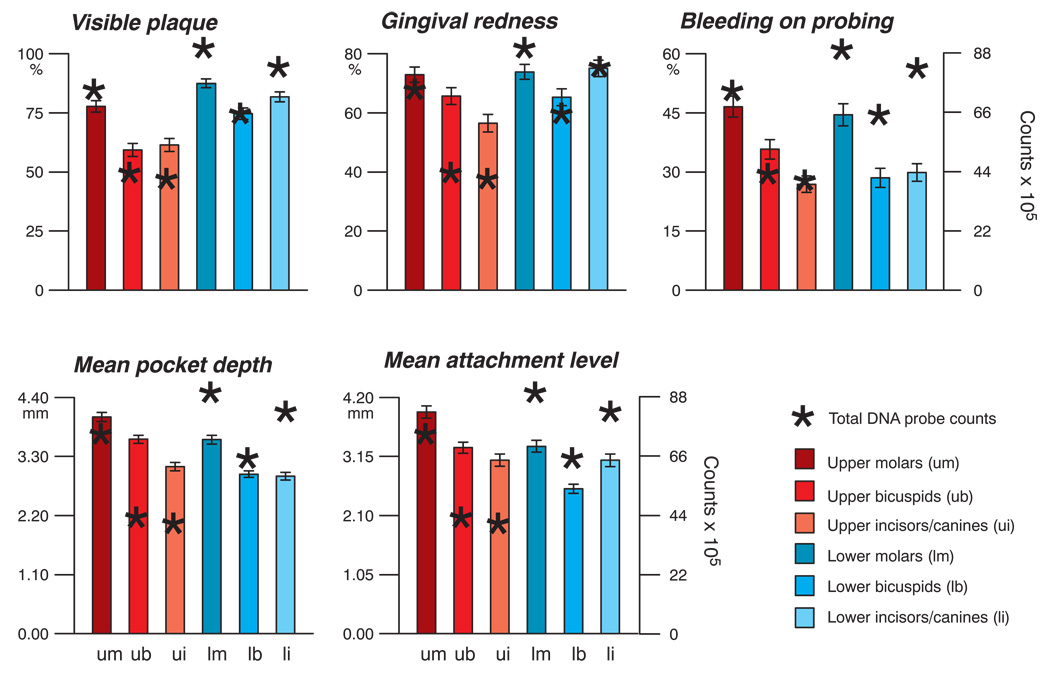
The mean total DNA probe counts (× 105, ± 95%CI) were for: upper molars 73.1 ± 8.6; upper bicuspids 41.7 ± 6.5; upper incisors/canines 39.1 ± 7.0; lower molars 88.2 ± 9.2; lower bicuspids 63.8 ± 8.0; lower incisors/canines 80.9 ± 9.3 (p < 0.0001). Fig. 3 presents the mean total DNA probe counts and mean clinical parameters in the different tooth type categories. In general, the molar teeth exhibited the highest mean values for all clinical parameters examined, while the lower bicuspids exhibited the lowest mean clinical values. The mean total DNA probe counts were strongly related to % of sites with visible plaque and % of sites with gingival redness. Regression analysis of mean total DNA probe counts at the 6 tooth categories with % of sites with visible plaque or % of sites with gingival redness provided highly significant correlations of r = 0.99 (p < 0.001) and r = 0.84 (p < 0.05) respectively. The relationship of total DNA probe counts to the other 3 clinical parameters was not as strong. For example, the mean pocket depth at upper bicuspids was greater than at lower incisors/canines although the mean total DNA probe counts at the upper bicuspids were significantly lower than at the lower incisor/canine sites. Bleeding on probing was comparable at upper and lower incisor/canine sites, but total DNA probe counts differed markedly. Mean attachment levels were lower in the lower bicuspid region than at the upper bicuspid teeth, but the total DNA probe counts were higher at the lower than upper bicuspids.
Fig 3.
Mean clinical characteristics (± SEM) at the 6 tooth type categories. Data for each parameter were averaged within each tooth category in a subject and then across subjects for each tooth type category separately. Differences among tooth type categories were significant for each clinical parameter (p < 0.001, Kruskal Wallis test). Mean total DNA probe counts (× 105) for each tooth type category are depicted as asterisks. Total DNA probe counts differed significantly among tooth type categories (p < 0.001, Kruskal Wallis test). The left y-axis represents the values for the clinical parameters, while the right y-axes depicted on the 2 right plots represent counts (× 105).
Species proportions at different tooth type categories
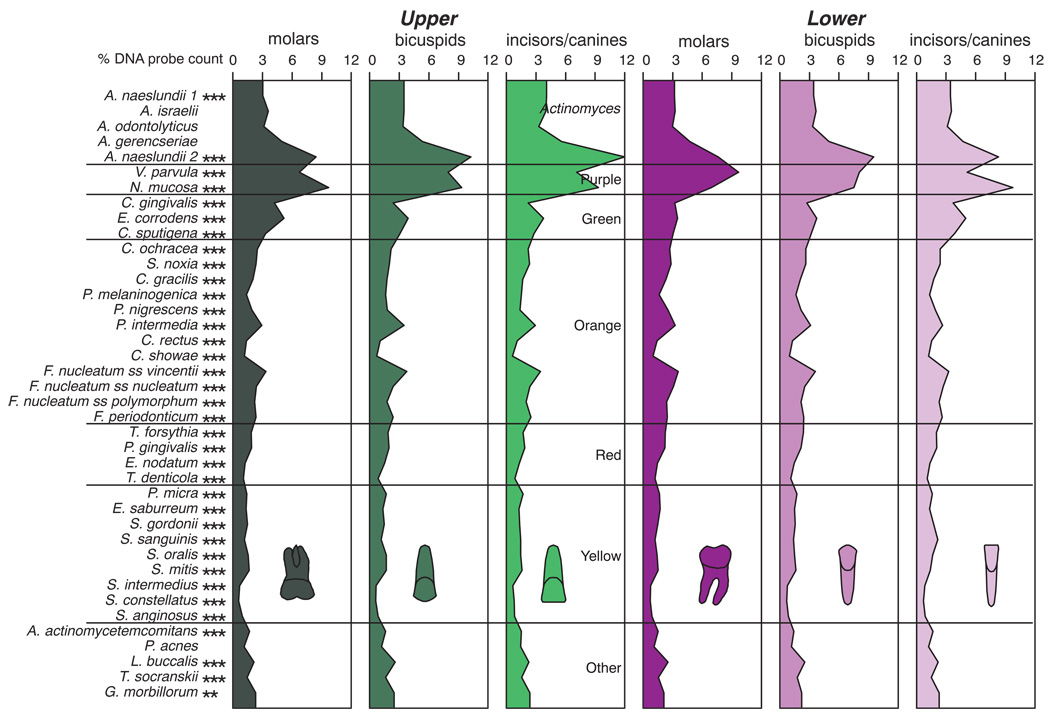
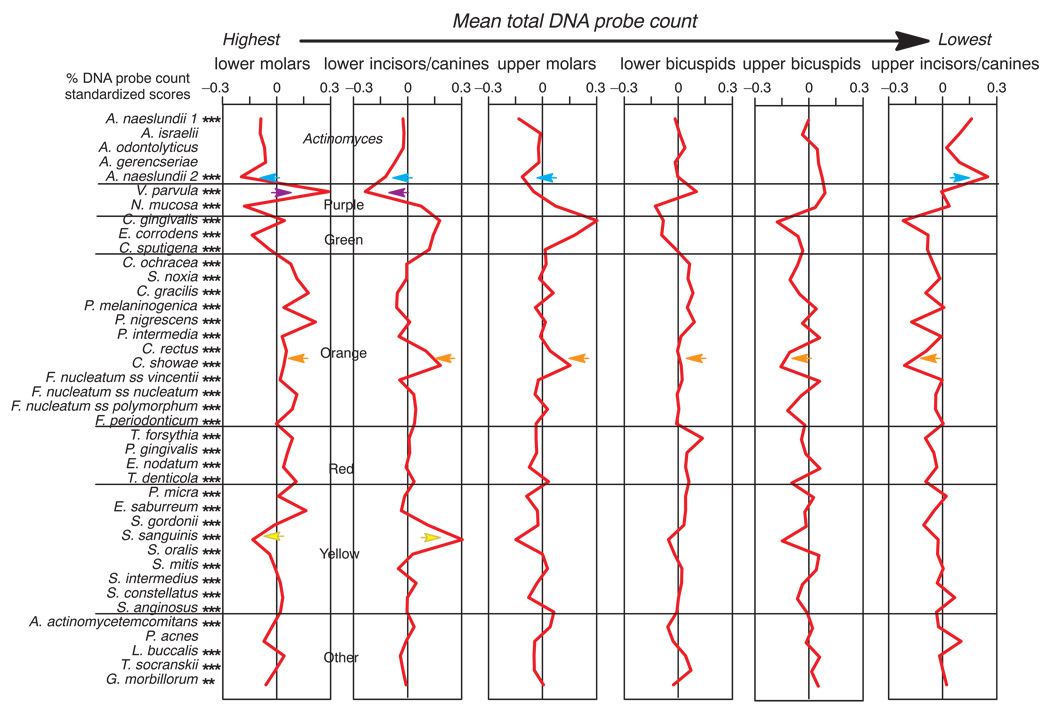
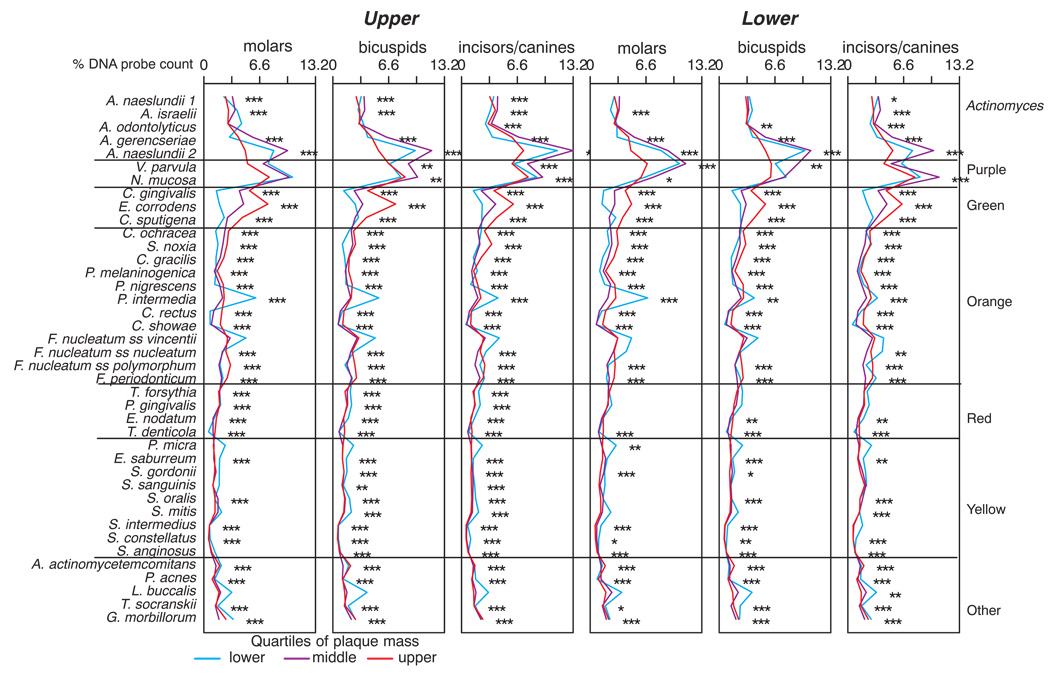
The proportions of the test species differed significantly among tooth type categories (Fig. 4). Mean proportions of Actinomyces naeslundii genospecies 2 were highest in samples from upper incisor/canine sites, Veillonella parvula was at highest mean proportions at lower molar sites and Neisseria mucosa was lowest at these sites. Campylobacter rectus and Campylobacter showae and the “milleri streptococci”, Streptococcus anginosus, Streptococcus constellatus and Streptococcus intermedius, were in low proportions for all tooth type categories. The mean proportion of Actinomyces species was higher in the upper than the lower jaw, while proportions of orange, red and yellow complex species were somewhat higher in the lower jaw. Green complex species were in highest proportions at upper molar and lower incisor/canine sites. The data of Fig. 4 are presented as mean standardized scores (Fig. 5) because differences in proportions among tooth locations were difficult to discern. In addition, the tooth types in Fig. 5 were arranged from those with the highest mean total DNA probe counts (lower molars) to the lowest mean total DNA probe counts (upper incisors/canines) in order to help to discriminate differences in proportions that might be associated with plaque mass from those that appear to be specific to tooth type. For example, the decrease in the proportions of C. rectus and C. showae as one progresses from the high plaque mass teeth (molars and lower incisors/canines) to the low plaque mass teeth (bicuspids and upper incisors/canines) is readily apparent. The converse of high proportions of A. naeslundii genospecies 2 at upper incisors/canines, but low proportions in the molars and lower incisors/canines is also clearly demonstrated. Other species such as V. parvula and Streptococcus sanguinis showed marked differences in mean proportions at tooth sites with similar mean total DNA probe counts. For example, V. parvula was in high mean proportions at lower molar sites, but in low proportions in the lower incisor/canine teeth. In contrast, S. sanguinis was in high mean proportions at the lower incisor/canine sites, but in low mean proportions at the upper molar sites. Cluster analysis demonstrated that the mean microbial profiles of the upper molars clustered with those of the lower incisors/canines, the upper bicuspids with the upper incisors/canines, while the lower molars clustered with the lower bicuspids when using mean counts or mean proportions with the chord or minimum similarity coefficients (data not shown).
Fig 4.
Mean % DNA probe counts of the 40 test species in supragingival biofilm samples for teeth subset according to intra-oral location. The proportion of each species was computed at each sample site, averaged within a tooth type category and then averaged across subjects for the tooth type category. Significance of differences among tooth type categories for each of the test species was determined using the Kruskal Wallis test and adjusted for 40 comparisons: * p < 0.05; ** p < 0.01; *** p < 0.001. The species were ordered according to supragingival microbial complexes (1).
Fig 5.
Mean standardized scores for mean % DNA probe counts presented in Fig. 4. The standardized score that each species comprised of the total DNA probe count was computed for each sampled site, averaged within a subject for each tooth type category and then across subjects in the 6 tooth type categories separately. Significance of differences among tooth type categories was determined using the Kruskal Wallis test, * p < 0.05, ** p < 0.01, *** p < 0.001, and adjusted for multiple comparisons (5). The standardized scores were provided so that differences among tooth type categories would be more clearly evident. Standardized scores were computed for each species separately. The standardized score for a species in a sample was = (sample proportion - mean) / SD. Standardized scores have a mean of 0 and SD of 1. The colored arrows indicate species discussed in the text.
Species proportions at tooth type categories after subsetting according to total DNA probe counts
It was previously demonstrated that the composition of the supragingival plaque was associated with the total DNA probe count at the sample site (2). Since total DNA probe counts differed according to tooth type category (Fig. 1–Fig. 3), the question was asked as to whether species proportions within a tooth type category would differ in samples that exhibited low, moderate or high total DNA probe counts. The relation of tooth type, species proportions and total DNA probe count at the site was examined and is presented in Fig. 6. When the samples were subset using the quartiles of the total DNA probe counts, samples with high plaque mass (upper quartile) exhibited high proportions of green complex species irrespective of tooth type category. Samples with moderate or low total DNA probe counts (middle and lower quartiles of the distribution), were characterized by high proportions of A. naeslundii genospecies 2, V. parvula and/or Neisseria mucosa irrespective of tooth type. Samples in the lowest quartile also exhibited elevated proportions of Prevotella intermedia, Fusobacterium nucleatum ss vincentii, Parvimonas micra and Leptotrichia buccalis.
Fig 6.
Mean % DNA probe counts of the 40 test species in supragingival biofilm samples for teeth subset according to intra-oral location and according to the quartiles of the total DNA probe counts. The proportion of each species was computed at each sample site, averaged within a tooth type category for each total DNA probe count quartile and then averaged across subjects. Significance of differences among total DNA probe count quartile groups for each tooth type category for each of the test species was determined using the Kruskal Wallis test and adjusted for 40 comparisons: * p < 0.05; ** p < 0.01; *** p < 0.001. The species were ordered according to supragingival microbial complexes (1).
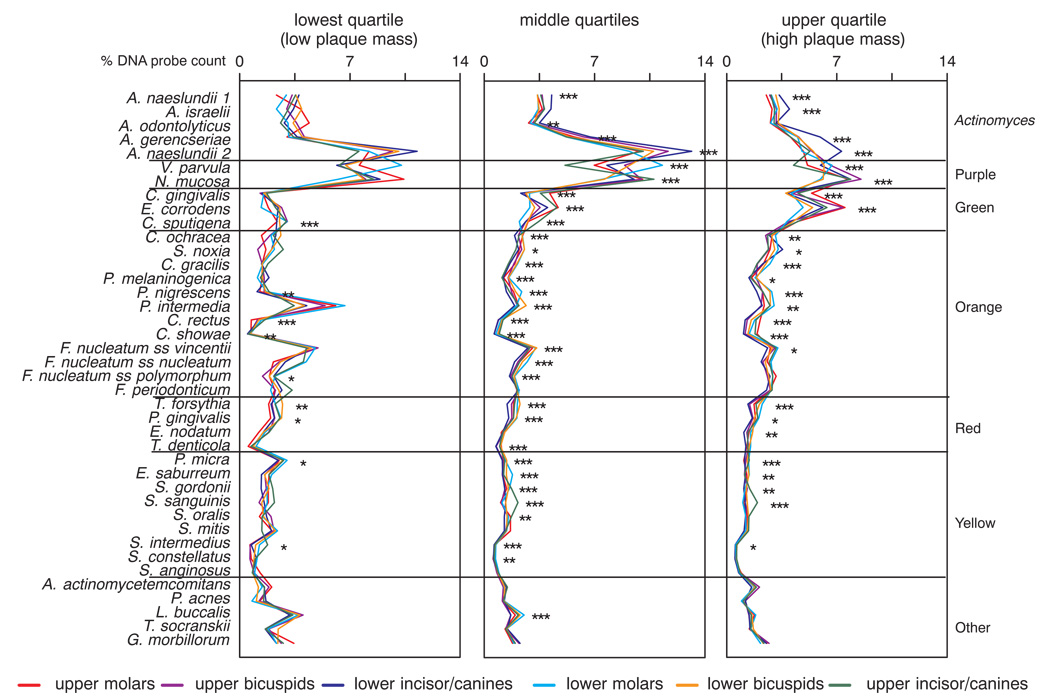
The question was also posed as to whether there were differences among mean species profiles for different tooth categories in samples subset according to low, moderate or high plaque mass (Fig. 7). There were significant differences in the majority of species proportions among tooth types for each of the plaque mass quartiles. Further, greater numbers of significant differences in species proportions among tooth types were observed for the samples taken from sites with moderate and high plaque mass. 9/40, 31/40 and 25/40 species differed significantly among tooth categories for the low, moderate and high plaque mass quartile groups respectively. These data indicate that differences in plaque mass at different tooth types was not the sole reason for the observed differences in microbial species proportions among the 6 tooth type categories.
Fig 7.
Mean % DNA probe counts of the 40 test species in supragingival biofilm samples subset according to the quartiles of total DNA probe count. Species proportions were averaged within each quartile group for each tooth category in each subject and then across subjects for each tooth category/total DNA probe count quartile separately. The species were ordered according to supragingival microbial complexes (1). The left panel represents mean species proportions in different tooth categories in samples with the lowest plaque mass (the lowest quartile of total DNA probe counts), the right panel represents mean species proportions for different tooth categories in samples with the highest plaque mass (the highest quartile of total DNA probe counts), while the middle panel represents the remaining 50% of the distribution. The different colored lines in each panel represent the various tooth categories. Significance of differences among tooth type categories for each of the test species in each total DNA probe count quartile was determined using the Kruskal Wallis test and adjusted for 40 comparisons: * p < 0.05; ** p < 0.01; *** p < 0.001.
Multivariate analysis
Examples of the stepwise multiple linear regression analysis are presented in Table 1. For certain species few variables were significantly associated with the proportions of these species. For example, the percentages of Aggregatibacter actinomycetemcomitans and C. rectus were only significantly associated with total DNA probe count, while the percentage of Porphyromonas gingivalis was only significantly associated with total DNA probe count and smoking status. The proportions of species such as S. sanguinis, Capnocytophaga gingivalis and A. naeslundii genospecies 2 were significantly associated with total DNA probe count, specific tooth locations, age, and in certain instances with periodontal status, smoking status or gender. After adjusting for other variables in the model, tooth location was significantly associated with the proportions of 20 of the 40 test species. These were Actinomyces gerencseriae, Actinomyces naeslundii genospecies 1 and 2, N. mucosa, V. parvula, C. gingivalis, Capnocytophaga sputigena, Eikenella corrodens, Selenomonas noxia, Campylobacter gracilis, Prevotella nigrescens, P. intermedia, C. showae, Tannerella forsythia, Eubacterium nodatum, Eubacterium saburreum, Streptococcus gordonii, S. sanguinis, S. intermedius and S. constellatus.
Table 1.
Results of multiple linear regression analysis evaluating factors that might influence species proportions in supragingival biofilms.
| Outcome variable | Coefficient | p value |
|---|---|---|
| % A. actinomycetemcomitans | 1.3673 | |
| + 0.0031 total DNA probe count | < 0.001 | |
| % P. gingivalis | 2.3181 | |
| − 0.0025 total DNA probe count | < 0.05 | |
| − 0.3685 cuurent smoker | < 0.05 | |
| % C. rectus | 1.0426 | |
| + 0.0035 total DNA probe count | < 0.0001 | |
| % C. gingivalis | 1.4117 | |
| + 0.0135 total DNA probe count | < 0.0001 | |
| + 1.3796 upper molar | < 0.0001 | |
| + 0.7099 lower incisor/canine | < 0.001 | |
| − 0.4374 male | < 0.01 | |
| + 0.0121 age | < 0.05 | |
| % S. sanguinis | 2.0836 | |
| + 0.8578 lower incisor/canine | < 0.0001 | |
| − 0.3910 periodontitis | < 0.0001 | |
| − 0.0018 total DNA probe count | < 0.01 | |
| − 0.0084 age | < 0.01 | |
| − 0.1911 upper bicuspid | < 0.05 | |
| % A. naeslundii genospecies 2 | 10.0828 | |
| − 0.0320 total DNA probe count | < 0.0001 | |
| + 1.8615 upper incisor/canine | < 0.001 | |
| + 1.6835 current smoker | < 0.001 | |
| + 1.2168 male | < 0.001 | |
| − 1.1222 lower molar | < 0.05 |
Discussion
The results of the present investigation confirmed the expected finding that plaque levels differed among the different tooth categories. Mean bacterial counts were higher at upper and lower molar sites as well as lower incisor/canine sites compared with the other tooth locations. Mean counts of individual species also differed from tooth to tooth. These differences may have been due to some extent to the differences in plaque amounts that accumulated on the different tooth surfaces as described by Haffajee et al (2). Certain clinical parameters such as the percentage of sites with visible plaque and gingival redness related to total DNA probe counts irrespective of tooth type category. The percentage of sites exhibiting BOP, mean pocket depth and attachment level did not relate to mean total DNA probe counts. This finding was not surprising in that these clinical parameters would be more likely to be related to counts and microbial composition of subgingival rather than supragingival biofilms. Clinical parameters at sites subset according to plaque mass were in general related to the plaque mass of the sample from that site. However, there were exceptions. Lower incisor/canine sites that, on average, harbored supragingival plaques with high total DNA probe counts, had lower mean pocket depths and attachment levels and percentage of sites with BOP than molar sites that harbored similar or even lower plaque mass levels.
There was variation among individual teeth and tooth type categories in the mean total amounts and proportions of each species (Fig. 1–Fig. 3). While the proportions of species such as C. gingivalis relate strongly to total DNA probe count, differences in plaque mass are not the only reason for differences in species proportions at different tooth types. For example, S. sanguinis was in elevated proportions at the high total DNA count lower incisor/canine region, but in low proportions at another high total DNA probe count region, the upper molars (Fig. 5). V. parvula showed the opposite relationship. Indeed, using stepwise multiple linear regression analysis, 20 of the 40 test species were significantly associated, either negatively or positively with tooth location after adjusting for total DNA probes counts, periodontal status, smoking status, age and gender. Of interest in Fig. 5 was the greater similarity in mean microbial profiles of the upper incisor/canine tooth category and upper bicuspid tooth location when compared with profiles of the 4 other tooth categories which might have been due to better oral hygiene in these regions. Proportions of motile species such as C. rectus and C. showae were lower in samples from these regions conceivably due to scanty biofilm for colonization. Cluster analysis of the mean microbial profiles of the 6 different tooth type categories confirmed the similarity between the upper incisors/canines with the upper bicuspids and also demonstrated that the mean microbial profiles of the upper molars were most similar to those of the lower incisors/canines, while the lower molar profiles were most similar to those of the lower bicuspids (data not shown).
It might be argued that some of the differences observed were due to inconsistency in the sample taking methodology. However, as described in a previous publication (2), efforts were made to standardize the sample taking methodology by employing 2 calibrated clinicians who employed a single-stroke of a Gracey curette to obtain a representative sample of supragingival biofilm. In addition, there were large numbers of samples evaluated in each tooth category minimizing error due to sample taking. Thus, the mean total DNA probe counts depicted at each tooth in Fig. 1 are likely due to real differences in plaque mass at each tooth type. The lower total DNA probe counts at the upper incisors/canines and upper bicuspids may be due, in part, to better oral hygiene, lower levels of saliva and the action of the upper lip during chewing, speaking and smiling. The greater levels of biofilm at lower incisor/canine and upper molar sites may be due to less effective oral hygiene and proximity to the duct openings of the parotid, submandibular and sublingual salivary glands.
In a previous publication (2), it was demonstrated that plaque mass, as measured by total DNA probe count, was associated with different species proportions. Low total numbers of organisms tended to favor Actinomyces and purple complex species, while samples with large total DNA probe counts harbored increased proportions of green and orange complex species. Casual observation and measurement indicate that the total supragingival plaque differs from tooth to tooth; less plaque being detected on upper anterior teeth and upper and lower bicuspids. Thus, one might assume that difference in supragingival plaque composition on different teeth might merely be a reflection of the plaque mass. This was the hypothesis tested in this investigation. While plaque mass certainly is strongly associated with the proportions of many of the tested species, univariate and multivariate analyses clearly demonstrated that composition of supragingival biofilm was associated with tooth location even after adjusting for total DNA probe count in the multivariate analyses. Thus, 2 sets of factors have been shown to affect supragingival biofilm composition: the total mass of organisms in the biofilm and the intraoral location of the tooth that has been sampled. These recognitions should provide potential avenues for research that elucidates mechanisms by which these factors alter supragingival biofilm composition.
Acknowledgments
This work was supported in part by research grants DE-12108 and DE-14368 from the National Institute of Dental and Craniofacial Research.
References
- 1.Haffajee AD, Socransky SS, Patel MR, Song X. Microbial complexes in supragingival plaque. Oral Micro Immunol. 2008;23:196–205. doi: 10.1111/j.1399-302X.2007.00411.x. [DOI] [PubMed] [Google Scholar]
- 2.Haffajee AD, Teles RP, Patel MR, Song X, Socransky SS. Factors affecting supragingival biofilm composition. I. Plaque mass. J Periodont Res. 2008 doi: 10.1111/j.1600-0765.2008.01154.x. submitted. [DOI] [PMC free article] [PubMed] [Google Scholar]
- 3.Socransky SS, Smith C, Martin L, Paster BJ, Dewhirst FE, Levin AE. “Checkerboard” DNA-DNA hybridization. Biotechniques. 1994;17:788–792. [PubMed] [Google Scholar]
- 4.Socransky SS, Haffajee AD, Smith C, Martin L, Haffajee JA, Uzel NG, et al. The use of checkerboard DNA-DNA hybridization to study complex microbial ecosystems. Oral Microbiol Immunol. 2004;19:352–362. doi: 10.1111/j.1399-302x.2004.00168.x. [DOI] [PubMed] [Google Scholar]
- 5.Socransky SS, Haffajee AD, Smith C, Dibart S. Relation of counts of microbial species to clinical status at the sampled site. J Clin Periodontol. 1991;18:766–775. doi: 10.1111/j.1600-051x.1991.tb00070.x. [DOI] [PubMed] [Google Scholar]


