Abstract
Objective
To examine the relationship between total DNA probe counts of supragingival biofilm samples, clinical parameters and supragingival biofilm composition.
Methods
Supragingival plaque samples were taken from 187 systemically healthy adult subjects at baseline (N samples = 4,745). All samples were individually analyzed for their content of 40 bacterial species using checkerboard DNA-DNA hybridization. The relationship between total DNA probe counts and microbial composition was examined by sub-setting the data into 10 groups based on 10 percentile increments of the total DNA probe counts. Differences among groups in terms of species counts and proportions were sought as well as relationships of total plaque DNA probe count and clinical parameters.
Results
There was a wide distribution in mean total DNA probe counts among the 187 subjects. With increasing total plaque levels there was a change in the proportions of individual species and microbial complexes. “Small plaques” were characterized by high proportions of species in the yellow, orange, purple and “other” complexes; plaques of moderate mass were characterized by high proportions of Actinomyces and purple complex species, while “large plaques” exhibited increased proportions of green and orange complex species. Measures of gingival inflammation, pocket depth and recession were significantly positively associated with total DNA probe counts. Increased plaque numbers were related to increased pocket depth irrespective of presence or absence of gingival inflammation.
Conclusion
The proportions of individual species and microbial complexes in supragingival biofilms are influenced by the total numbers of organisms in the biofilm.
Keywords: Microbiology, bacteria, supragingival plaque, ecology, plaque mass
Introduction
Clinicians have noted for many years the vast differences in the amount of supragingival plaque that colonizes the natural dentition of their patients. Some individuals present with large quantities of visible biofilm on the surfaces of the majority of their teeth, while others exhibit minimal accumulations. Some of the differences in plaque amount are likely to be due to the skill and persistence of the patient in performing home care procedures. However, differences in home care by no means account for all of the differences observed in the level of plaque accumulation. Even if subjects exhibit similar levels of home care, the amount of plaque that develops on the dentition differs markedly from person to person. Sharawy et al. (1) measured the plaque mass recovered from half of the dentition in periodontally healthy and diseased individuals. They noted that subjects with periodontitis formed more plaque than subjects who were periodontally healthy and that the amounts of plaque and rate of re-development after cleaning differed markedly from individual to individual. Zee et al. (2) compared the microbial changes that occurred during 14 days of plaque re-development in subjects who were categorized as either “slow” or “rapid” plaque formers. Greater proportions of Gram negative taxa were detected at the later monitoring time points in the “rapid” plaque-forming subjects. Some of the differences in plaque mass may be due to host factors, other than home care procedures, such as the nature and amount of the diet, the composition and amount of the subject’s saliva, the presence or absence of gingival inflammation and differences in the receptors for bacterial attachment on soft tissues and the pellicles that form on tooth surfaces. Another factor that may impact the amount of biofilm formation might be the microbial composition of the biofilm itself. Thus, the purpose of the present investigation was to examine the relationship of species counts and proportions to the total counts of supragingival plaque samples. In addition, the relationship between supragingival plaque mass and the clinical status of the periodontal structures adjacent to the sample site was examined.
Material and Methods
Subject population
187 subjects ranging in age from 22 – 74 years who were considered to be periodontally healthy (N = 38) or with evidence of prior attachment loss (N = 149) were selected for study. All subjects had at least 20 teeth. Exclusion criteria included pregnancy, periodontal therapy or antibiotics in the previous 3 months, any systemic condition which might have affected the progression of periodontitis and the need for pre-medication for monitoring or therapy. No subject with localized juvenile periodontitis, rapidly progressive periodontitis or acute necrotizing ulcerative gingivitis was included in the study. The studies in which the subjects were participating had been approved by The Forsyth Institute Institutional Review Board.
Clinical monitoring
Subjects were screened for suitability and if accepted, provided signed informed consent. All subjects were clinically monitored at baseline. Plaque accumulation (0/1), overt gingivitis (0/1), bleeding on probing (0/1), probing pocket depth and probing attachment level were measured at 6 sites per tooth (mesiobuccal, buccal, distobuccal, distolingual, lingual and mesiolingual) at all teeth excluding third molars at the baseline visit. The baseline clinical features of the 187 subjects are presented in Table 1.
Table 1.
Clinical characteristics of the 187 subjects at baseline.
| Mean ± SD | Range | |
|---|---|---|
| Age | 46.8 ± 11.9 | 22 – 74 |
| % males | 47 | |
| % Current smokers | 17 | |
| % of sites with: | ||
| Plaque | 73 ± 24 | 4 – 100 |
| Gingival redness | 68 ± 30 | 0 – 100 |
| Bleeding on probing | 34 ± 24 | 0 – 96 |
| Mean pocket depth (mm) | 3.32 ± 0.84 | 1.68 – 7.35 |
| Mean attachment level (mm) | 3.20 ± 1.20 | 0.86 – 7.04 |
Microbiological assessment
Supragingival biofilm samples were taken using individual sterile Gracey curettes from the mesial surface of each tooth (excluding third molars) and placed into separate Eppendorf tubes containing 0.15 ml Tris EDTA buffer (10 mM Tris-HCl, 1 mM EDTA, pH 7.6). 0.10 ml of 0.5 M NaOH was added immediately to each sample. Each sample consisted of a single stroke of the curette on the tooth surface taken by 1 of 2 calibrated clinicians to ensure standardization of sample taking. Each sample was evaluated for its content of 40 bacterial species using checkerboard DNA-DNA hybridization (3, 4). In brief, the samples were lysed and the DNA placed in lanes on a nylon membrane using a Minislot device (Immunetics, Cambridge, MA, USA). After fixation of the DNA to the membrane, the membrane was placed in a Miniblotter 45 (Immunetics), with the lanes of DNA at 90° to the lanes of the device. Digoxigenin-labeled whole genomic DNA probes to 40 bacterial taxa were hybridized in individual lanes of the Miniblotter. After hybridization, the membranes were washed at high stringency and the DNA probes detected using antibody to digoxigenin, conjugated with alkaline phosphatase and chemifluorescence detection. Signals were detected using AttoPhos substrate (Amersham Life Sciences, Arlington Heights, Illinois, USA) and were read using a Storm FluorImager (Molecular Dynamics, Sunnyvale, CA, USA), a computer-linked instrument that reads the intensity of the fluorescence signals resulting from the probe-target hybridization. Two lanes in each run contained standards at the concentration of 105 and 106 cells of each species. The sensitivity of the assay was adjusted to permit the detection of 104 cells of a given species by adjusting the concentration of each DNA probe. Signals were evaluated using the Storm FluorImager and converted to absolute counts by comparison with standards on the same membrane. Failure to detect a signal was recorded as zero. A total of 4,745 supragingival samples were evaluated.
Data analysis
Available microbiological data included the counts and proportions of each of 40 test species from 4,745 supragingival plaque samples obtained at a baseline visit from 187 subjects (mean 25.4 samples per subject). Individual samples were taken from the mesiobuccal surface of each tooth in the mouth excluding third molars. The mean total DNA probe count was computed for each subject and plotted as a Tukey box plot. Samples were subset according to total DNA probe count into 10 groups cut at the deciles providing an average of 475 samples per group. The actual cut points (× 105) at the 10, 20, 30, 40, 50, 60, 70, 80 and 90th percentiles were 2.8, 7.3, 14.8, 24.9, 36.9, 52.0, 74.7, 110.9 and 166.4. The species counts and proportions were averaged within each decile in each subject and then averaged across subjects for each decile group. The mean counts and mean proportions of each species were plotted for the 10 groups subset according to these cut-points along with plots of the mean values for 4 diversity indices (5). Significance of differences among total DNA probe count groups for each of the test species was determined using the Kruskal Wallis test and adjusted for multiple comparisons (6). The analyses were repeated with subjects subset according to perioodntal status; i.e. health or peridontitis.
The mean values for local clinical parameters including presence or absence of plaque, gingival redness or bleeding on probing as well as mean pocket depth and clinical attachment level were computed for samples taken at sites subset according to the 10 percentile-cut-point groups based on total DNA probe counts described above. Regression analysis was employed to examine the relationship between total DNA probe counts and proportions of supragingival microbal complexes and individual microbial species. The species or complex proportions were averaged within each decile total DNA probe count group in each subject prior to the analysis.
Results
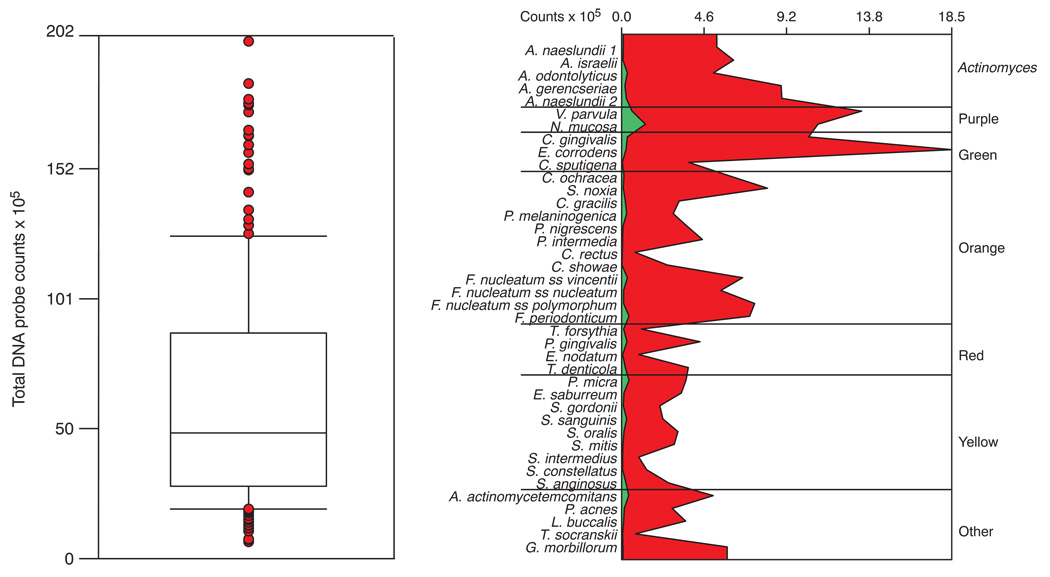
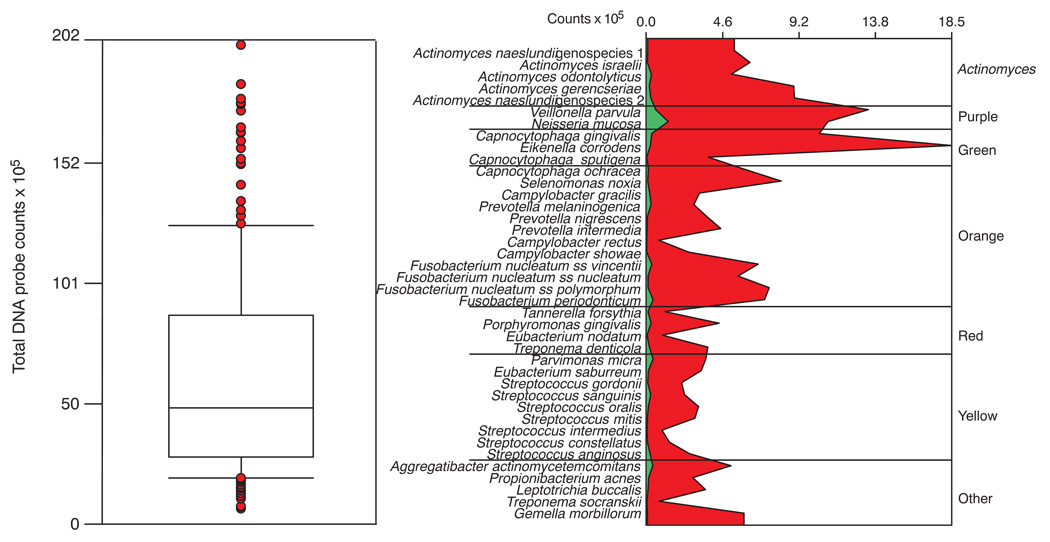
The mean total DNA probe counts differed markedly among subjects (Fig. 1, left panel) with the mean of the full mouth samples ranging from 6.54 × 10⁵ to 201.04 × 10⁵. The mean (× 105 ± SD) for the subject population was 62.92 ± 43.84. The counts at individual sites were even more variable ranging from 0.04 × 10⁵ to 529.08 × 10⁵. The extent of differences in mean microbial profiles of the subjects exhibiting the lowest and highest mean total DNA probe counts are presented in the right panel of Fig. 1. The marked difference in the mean counts of individual species is clearly apparent as well as the difference in relative distribution of the individual species in the 2 subjects.
Fig. 1.
Tukey box plot demonstrating the distribution of the mean total DNA probe counts of supragingival biofilm samples for the 187 subjects (left panel). The box indicates the upper and lower quartile values, the horizontal line within the box represents the median value. The whiskers indicate the 10th and 90th percentiles and the circles present the values for individual subjects who were outside the 10th and 90th percentiles. The right panel presents the mean counts (× 105) of each of the 40 test species in the subject with the lowest mean total DNA probe counts (green panel) and the subject with the highest mean total DNA probe counts (red panel). Counts of individual species in samples from all teeth (excluding third molars) were averaged within each subject separately. The species are ordered according to supragingival microbial complexes (7).
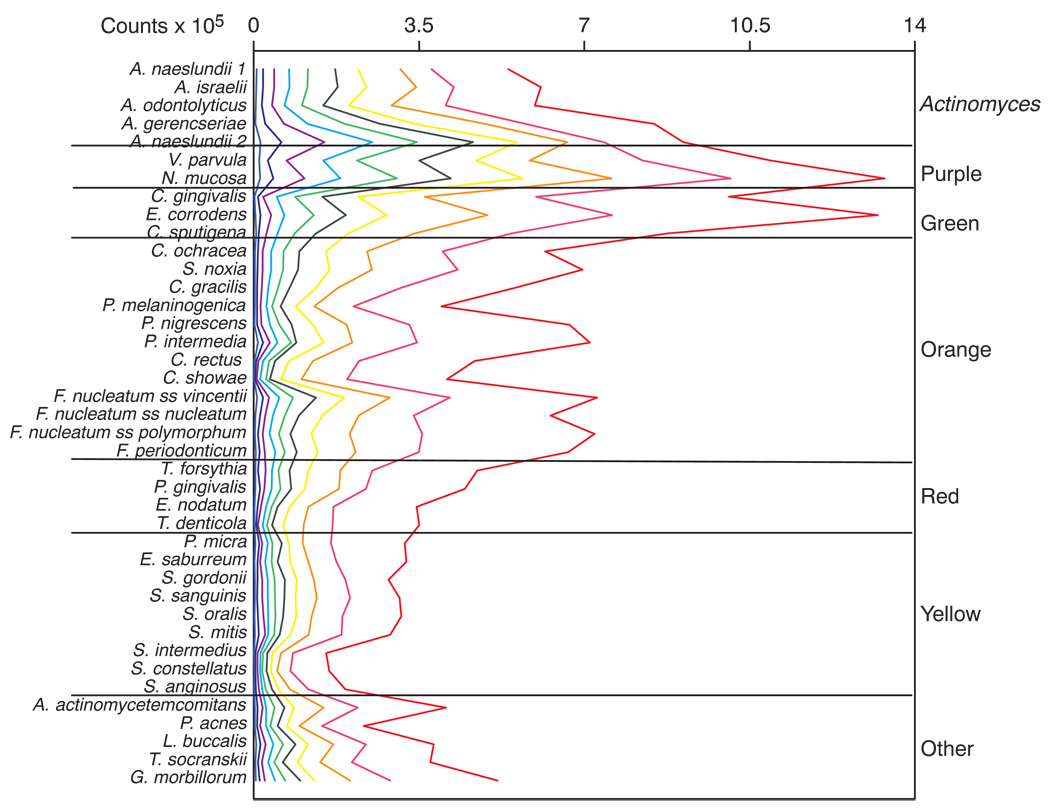
The composition of the biofilms at different levels of total DNA probe counts was examined by dividing the samples according to plaque counts into 10 groups at the deciles of the total counts. Although there was an average of 475 samples in each decile group, we averaged samples within each decile group in each subject prior to averaging across subjects for the decile groups. This provided data from an average of 150 subjects per decile group. The mean counts of the 40 test species in each of the decile groups is presented in Fig. 2. Differences were small among species counts in samples that exhibited the lowest total mean counts. In contrast there were greater differences among species counts in samples with the greatest total DNA probe counts. Species such as the “Streptococcus milleri” group, Streptococcus intermedius, Streptococcus constellatus and Streptococcus anginosus, exhibited the lowest mean counts irrespective of the size of the total plaque sample, while species of the green and purple complexes were at high levels, particularly in the samples with the greatest total DNA probe count.
Fig. 2.
Mean counts (× 105) of the 40 test bacterial species in supragingival biofilm samples taken from plaque with different total DNA probe counts. The samples were divided according to total DNA probe counts into 10 groups using the 10, 20, 30, 40, 50, 60, 70, 80, and 90th percentile of the total counts as cut points, providing an average of 475 supragingival plaque samples in each group. The counts were averaged within each decile group in each subject and then averaged across subjects for each decile group separately. The lines have been color-coded to represent the different groups; e.g. the lowest plaque mass group to the left of the plot is depicted in light blue, while the group with the largest plaque mass is depicted to the right of the plot in red. Significance of differences among groups for each of the test species was determined using the Kruskal Wallis test and adjusted for multiple comparisons (6). All species differed significantly among groups at p < 0.001.
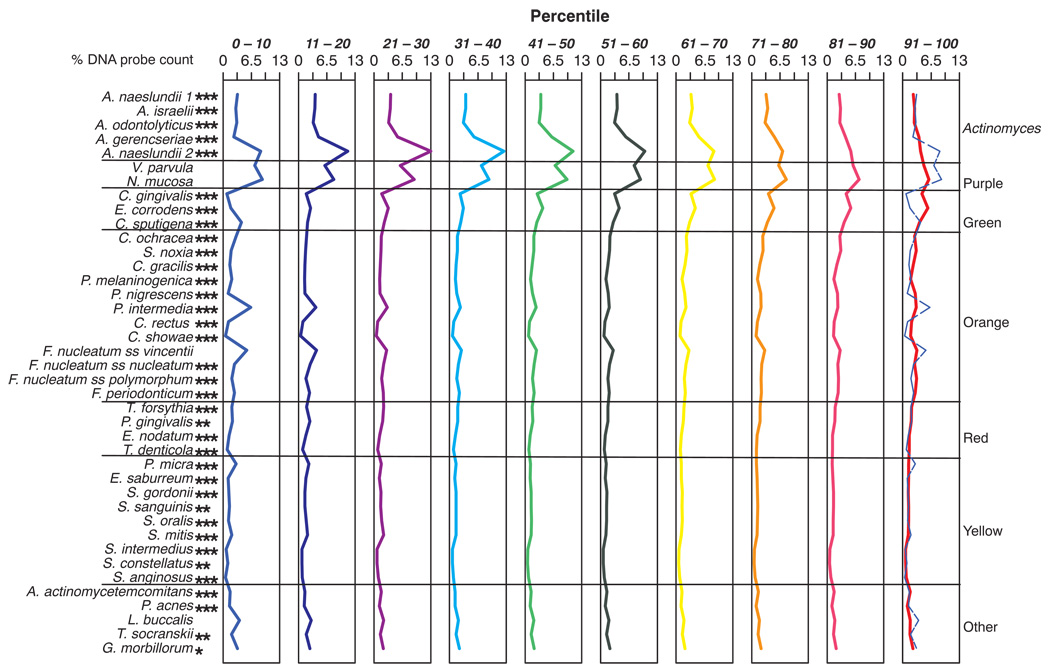
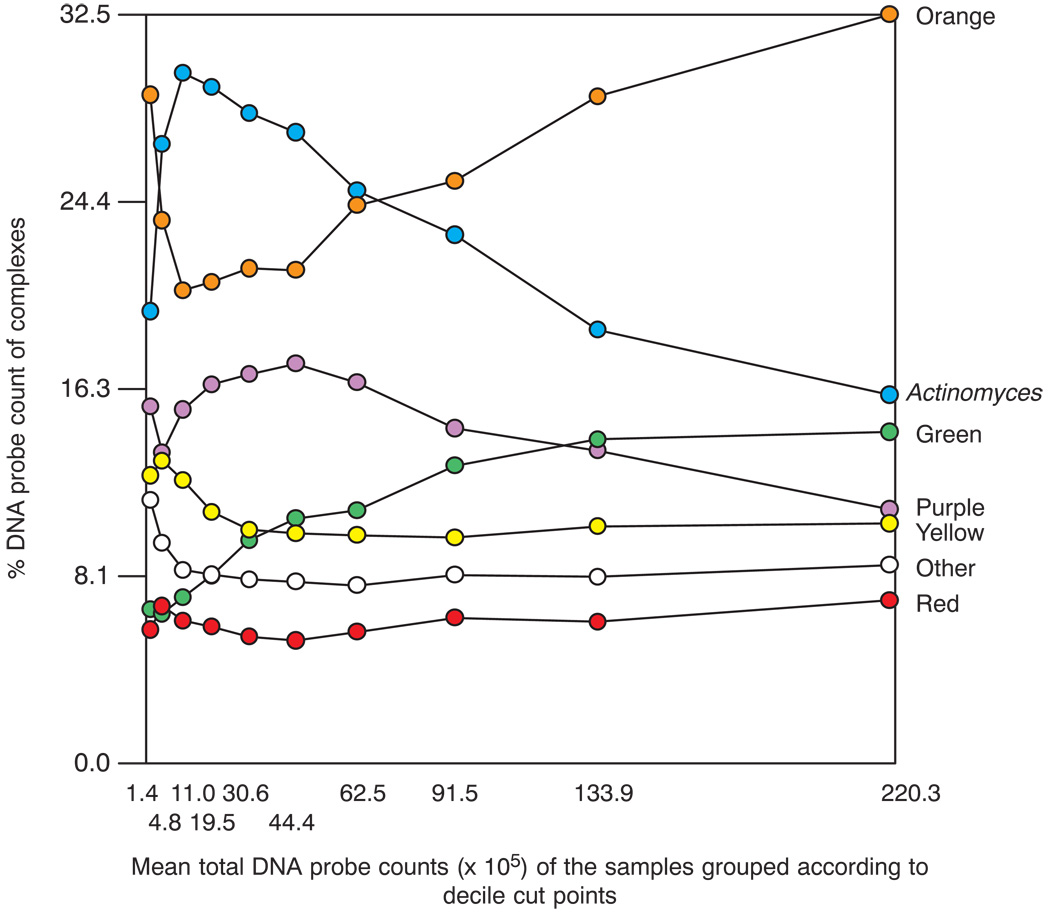
Species proportions differed considerably depending on the size of the total plaque sample. Fig. 3 presents the mean proportions of each of the 40 test species in samples subset into the 10 percentile total DNA probe count groups. As the mean counts increased, the proportions of species such as Capnocytophaga gingivalis and Eikenella corrodens increased, while the proportions of Actinomyces naeslundii genospecies 2, Veillonella parvula, Neisseria mucosa as well as Prevotella intermedia, Fusobacterium nucleatum ss vincentii and Leptotrichia buccalis decreased. The Actinomyces species exhibited low proportions in samples with the lowest total counts, increased proportions in samples of moderate mass, but decreased proportions in samples from biofilms with the largest bacterial mass. This is shown in Fig. 4 along with a reciprocal relationship with proportions of orange complex species. The latter complex was in high proportions in the two lowest decile count groups, fell to lower proportions in decile groups 3 to 6 and increased markedly and dominated in proportions in the plaque samples with the highest mean total DNA probe counts. The purple complex showed a similar pattern of change to the Actinomyces. Species in the yellow and “other” complexes were at their highest mean proportion in the samples from the low plaque mass biofilms, while the green complex species increased in mean proportions with increasing total DNA probe count. The red complex species were at essentially the same mean proportions irrespective of the plaque sample size.
Fig. 3.
Mean proportions of the 40 test bacterial species in supragingival biofilm samples taken from plaque with different total DNA probe counts. The samples were divided according to total DNA probe counts into 10 groups using the 10, 20, 30, 40, 50, 60, 70, 80, and 90th percentile of the total counts as cut points, providing an average of 475 supragingival plaque samples in each group. The proportions of each species were determined at each site, averaged within each decile group in each subject and then averaged across subjects for each decile group separately. The lines have been color-coded to represent the different groups; e.g. the lowest plaque mass group in the extreme left panel is depicted in light blue, while the group with the largest plaque mass is depicted in the extreme right panel in red. The dashed blue line in this panel represents the profile of the lowest plaque mass group in the first panel. Significance of differences among groups for each of the test species was determined using the Kruskal Wallis test and adjusted for multiple comparisons; * p < 0.05; ** p < 0.01; *** p < 0.001.
Fig. 4.
Plot of the total of the mean proportions comprised by the 7 supragingival complexes described by Haffajee et al. (7) in the 10 total DNA probe count groups presented in Fig. 2. The x-axis values represent the mean values for each group and the y-axis represents the sum of the proportions comprised by the species in each microbial complex.
The proportions of species in the 38 periodontally healthy subjects were compared with data from the 149 subjects with periodontitis for each decile of the total DNA probe counts (data not shown). Only 25 of 400 comparisons (40 species × 10 deciles categories) differed significantly between groups. The differences were predominantly for Streptococcus mitis and Streptococcus oralis which were in higher proportions in health for 7 of the decile groups. P. intermedia was in higher proportions in periodontitis subjects for 3 decile groups. The analyses were repeated subsetting subjects according to gender, smoking status (non-smoker vs. current smoker) and age (subset at median values and also at quartiles). Of 400 comparisons for each demographic or environmental parameter, there was 1 significant difference based on gender, 3 based on smoking status, 1 based on age cut at the median value and none for age cut at the quartiles.
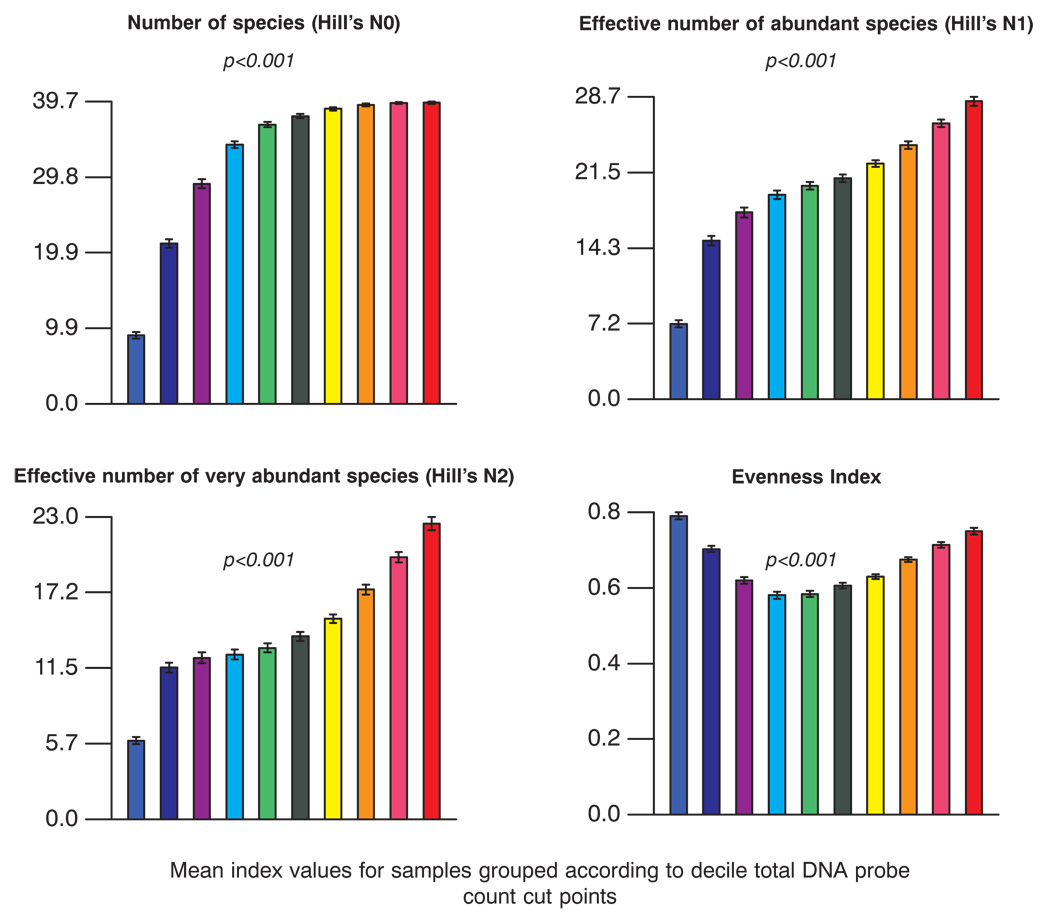
The correlation between total DNA probe count and the proportions of individual species or complexes of bacterial species was examined using regression analysis (Table 2). Highly significant positive correlations with increased total DNA probe count were observed for the green and orange complexes, individual members of those complexes including, C. gingivalis, E. corrodens, Selenomonas noxia, Campylobacter gracilis, Prevotella nigrescens, Campylobacter rectus, Campylobacter showae and Fusobacterium nucleatum ss polymorphum. The red complex species, Treponema denticola, also showed a significant positive correlation with increasing total counts. Highly significant negative correlations with increased total DNA probe count were observed for Actinomyces and purple complexes, Actinomyces naeslundii genospecies 1, A. naeslundii genospecies 2, Parvimonas micra and L. buccalis. Diversity indices describing species richness and species evenness (5) are presented in Fig. 5. For each index, diversity was computed at a site, averaged within decile groups in each subject and then averaged across subjects for each decile group. “Hill’s N0”, the number of species detected in the supragingival plaque samples, averaged about 33 across the decile groups and ranged from 9.0 to 39.6 in the least to the greatest plaque mass groups respectively. The mean effective number of abundant species and very abundant species was 20.2 (range 7.2 to 28.3) and 14.4 (range 6.0 to 22.5) respectively. The lowest values were detected in samples from biofilms with the lowest total DNA probe counts and the highest values in the largest biofilm samples. Hill’s evenness index ranges from 0 to 1 with 1 indicating a perfectly even distribution of species and 0 indicating a very skewed distribution. The evenness index for the samples examined in the current study ranged from 0.60 to 0.82. There appeared to be greater “evenness” in the samples from the biofilms with low plaque mass or with high plaque mass, while samples from supragingival biofilms between these 2 extremes were more skewed.
Table 2.
Correlation between mean proportions of specific species/complexes and total DNA probe count. Proportions were averaged within each decile group in each subject, prior to performing regression analysis. All relationships were significant at p < 0.001 after adjusting for multiple comparisons.
| Species/complex | Pearson r | Species/complex | Pearson r |
|---|---|---|---|
| Green | 0.323 | Actinomyces | −0.214 |
| Orange | 0.224 | Purple | −0.103 |
| C. gingivalis | 0.321 | A. naeslundii 1 | −0.140 |
| E. corrodens | 0.235 | A. naeslundii 2 | −0.290 |
| S. noxia | 0.180 | P. micra | −0.133 |
| C. gracilis | 0.146 | L. buccalis | −0.133 |
| P. nigrescens | 0.209 | ||
| C. rectus | 0.197 | ||
| C. showae | 0.362 | ||
| F. nucleatum ss polymorphum | 0.187 | ||
| T. denticola | 0.118 |
Fig. 5.
Bar plots of diversity indices for each of the 10 total DNA probe count groups described in Fig. 2. These included the number of species (Hill’s N0), number of abundant (Hill’s N1) and very abundant species (Hill’s N2) and the evenness index (5). The bars represent the decile groups and are color coded as depicted in Fig. 2.
Relationship of total DNA probe count to clinical parameters at the sample site
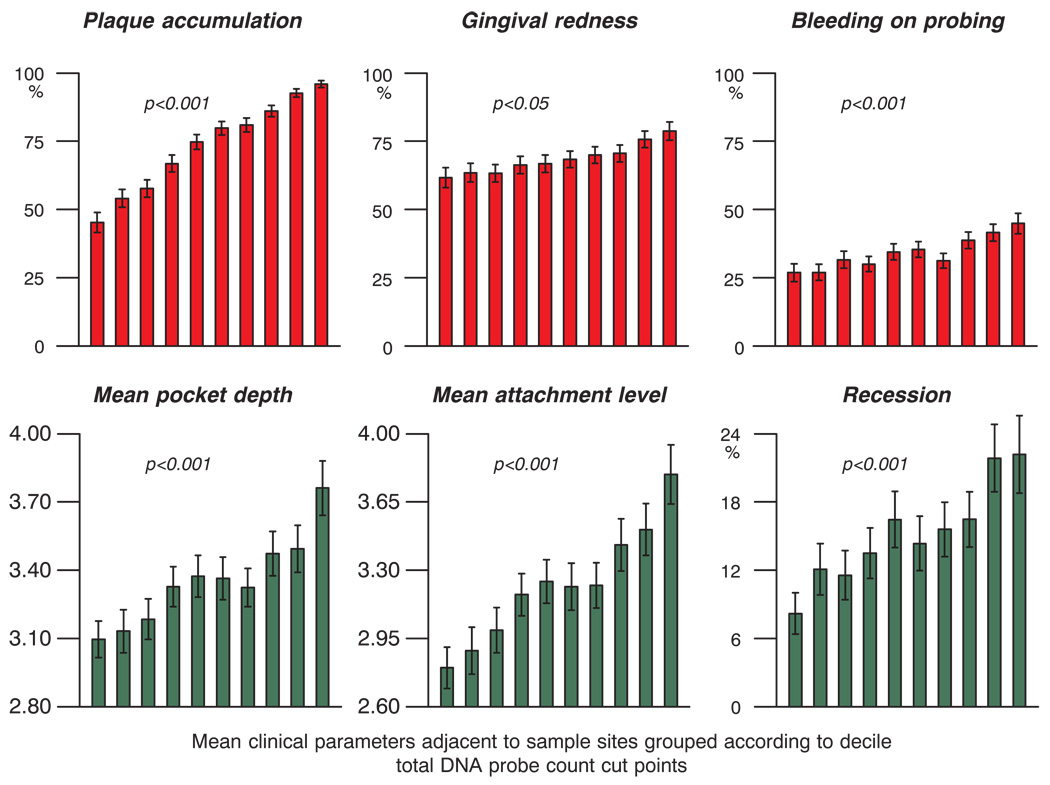
The total DNA probe counts subset into the 10 percentile categories described above related strongly to clinical measurements of periodontal disease status (Fig. 6). As expected, the presence of visible plaque was highly associated with total DNA probe count. Measures of gingival inflammation including gingival redness and bleeding on probing were also positively associated with plaque mass. In addition, mean pocket depth, mean attachment level and the percentage of sites with recession increased with increasing total DNA probe count in the supragingival biofilm samples.
Fig. 6.
Mean clinical parameters (± SEM) at sites subset according to the 10 total DNA probe count categories described in Fig. 2. The clinical parameters were averaged within each total DNA probe count decile group in each subject and then averaged across subjects for each decile group separately. Significance of differences among percentile groups based on total DNA probe counts was determined for each clinical parameter using the Kruskal Wallis test.
Discussion
The present study examined the relationship of the mass of “mature” supragingival biofilm samples (defined by total DNA probe counts) with the species counts and proportions within those samples. The data indicated that species within certain complexes, particularly the green and orange complexes, increased markedly in proportion in samples with increasing total DNA probe counts. These data are in accord with the cultural study of Zee et al. (2) that described elevated proportions of Gram negative species in samples from subjects who were considered to be “rapid” plaque formers based on the formation of abundant plaque during 14 days of biofilm formation. Since all of the species of the green and orange complexes are Gram negative, they probably account for the Gram negative overgrowth observed in the abundant plaque formers of Zee et al. (2).
In order to examine the nature of different ecosystems, ecologists have often employed diversity indices. Not surprisingly, the diversity in the samples in the current investigation increased with increasing sample size (Fig. 5). This may have been due to the provision of a wider range of habitat diversity in the larger biofilms encouraging colonization by a wider range of species; or it may have reflected species levels too low to be detected in the small samples. The evenness index reflected whether species were evenly distributed within samples (high evenness index) or whether certain species were relatively more abundant in samples leading to a lower evenness index. In the present investigation there was a greater evenness in samples that were at either ends of the total DNA probe count distribution. This was readily apparent in the extreme right panel of Fig. 3 where species proportions were quite uniform. In contrast, the extreme left panel of this Fig. showed a more “jagged” profile reflecting the small number of species detected; i.e. many samples had < 10 detected species (Fig 5). However, the species were present in comparable numbers leading to high evenness index values.
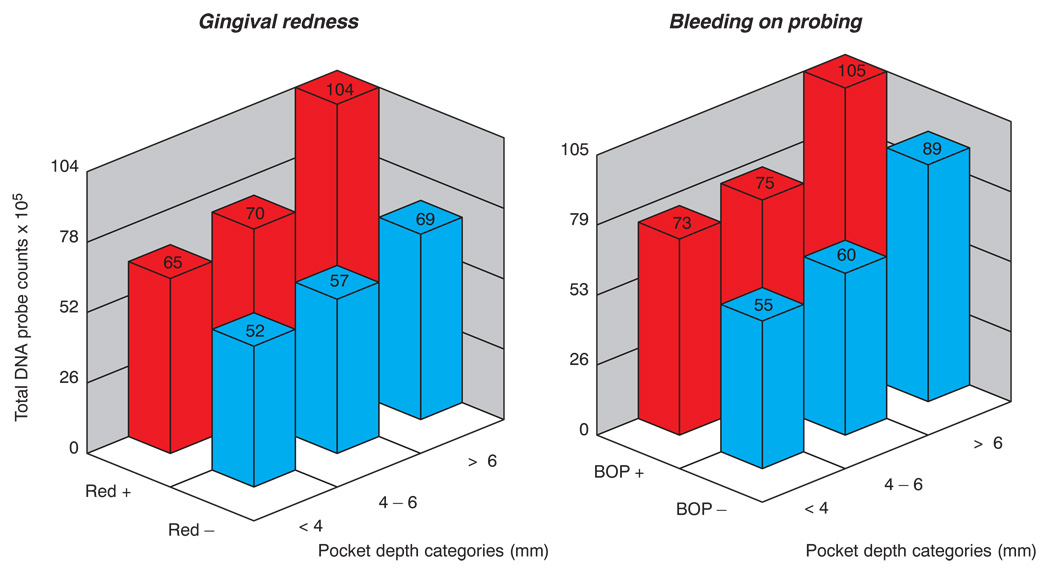
The supragingival plaque mass related strongly to the clinical parameters at the adjacent site. It has been known for some time that increased plaque mass related to and initiated gingival inflammation (8, 9). More recently, it was recognized that gingival inflammation would lead to more rapid and abundant plaque development at adjacent sites (10, 11). The relationship of increased plaque mass to greater mean pocket depth was somewhat more complex. The increased inflammation of tissues adjacent to deeper periodontal pockets may have accounted for some of the increased biofilm mass. However, this may not be the entire explanation since deeper pockets without clinically evident inflammation, as measured by gingival redness or bleeding on probing, also harbored increased mean supragingival biofilm levels (Fig. 7).
Fig. 7.
Bar charts of the mean total DNA probe counts at sites subset according to pocket depth categories < 4, 4–6 and > 6 mm and presence or absence of gingival redness (left panel) or bleeding on probing (right panel). 2-way ANOVA indicated that total DNA probe counts differed significantly among pocket depth categories and also between presence or absence of gingival redness, or between presence or absence of bleeding on probing.
There were limitations to this study, the most obvious of which was the sample taking methodology. No effort was made to take all of the supragingival plaque from the sample sites since it was difficult to “ draw the line” as to where the sample surface should end. Rather, a standardized sample taking methodology was employed that utilized a single stroke of an 11/12 Gracey curette against the mesiobuccal tooth surface above the gingival margin. The mesiobuccal surface was chosen for 2 reasons. The first was that this surface was less likely to be disturbed by typical self-administered home care procedures than the facial surfaces. The second was that easy accessibility to this surface was likely to produce more reproducible sampling than taking samples from the distobuccal or distolingual surfaces of the teeth. To improve reproducibility, all samples were taken by the 2 trained and calibrated dental hygienists. Although there may have been some variability due to sample taking, the large numbers of samples in each total DNA probe percentile group should have mitigated, to a large extent, the potential for sampling bias. A second limitation was the unknown age of the supragingival biofilm samples. Some samples may have been taken from biofilms that had been “undisturbed” for literally months to years, while others may have been taken from recently cleaned tooth surfaces. Still others may have been obtained from surfaces that had both undisturbed and recently developed biofilms. The only way to be able to sample plaque of known age that was undisturbed for a specified period of time would be to clean the tooth and allow plaque to develop undisturbed. This would be practical for short periods of time only. Thus, the present investigation may provide as coherent a snapshot of mature biofilm as is possible in countries where oral hygiene is routinely practised.
Investigators have been examining the composition of oral biofilms, particularly subgingival biofilms, for some time. In general, these studies have concentrated on determining the composition of the biofilms as they relate to periodontal health and disease. Few efforts have been made to understand the factors that control the composition and mass of these ecosystems. Intuitively, one recognizes that diet, oral hygiene habits and genetic background must influence biofilm composition, but we have little understanding of the effects of these factors. The data in the present manuscript indicated that there was marked variability in the total numbers of organisms on tooth surfaces in individual subjects. In addition, it was observed that the clinical status of the tissues adjacent to the sample site was strongly related to plaque mass. Conceivably, the increased plaque mass enhanced gingival inflammation while the gingival inflammation favored increased plaque development. The present manuscript presents unique and novel data regarding the relationship of plaque mass, as reflected by total DNA probe count, to supragingival biofilm composition. Clearly, as plaque mass increases, the composition of the biofilm is altered favoring orange and green complex species and diminishing Actinomyces and purple complex species. This relationship is remarkable and sets the stage for attempting to understand why such shifts take place.
Fig. 8.
Acknowledgments
This work was supported in part by research grants DE-12108 and DE-14368 from the National Institute of Dental and Craniofacial Research.
References
- 1.Sharawy AM, Sabharwal K, Socransky SS, Lobene RR. A quantitative study of plaque and calculus formation in normal and periodontally involved mouths. J Periodontol. 1966;37:495–501. doi: 10.1902/jop.1966.37.6.495. [DOI] [PubMed] [Google Scholar]
- 2.Zee KY, Samaranayake LP, Attstrom R. Predominant cultivable supragingival plaque in Chinese “rapid” and “slow” plaque formers. J Clin Periodontol. 1996;23:1025–1031. doi: 10.1111/j.1600-051x.1996.tb00532.x. [DOI] [PubMed] [Google Scholar]
- 3.Socransky SS, Smith C, Martin L, Paster BJ, Dewhirst FE, Levin AE. “Checkerboard” DNA-DNA hybridization. Biotechniques. 1994;17:788–792. [PubMed] [Google Scholar]
- 4.Socransky SS, Haffajee AD, Smith C, Martin L, Haffajee JA, Uzel NG, et al. The use of checkerboard DNA-DNA hybridization to study complex microbial ecosystems. Oral Microbiol Immunol. 2004;19:352–362. doi: 10.1111/j.1399-302x.2004.00168.x. [DOI] [PubMed] [Google Scholar]
- 5.Ludwig JA, Reynolds JF. A primer on methods and computing. New York: Wiley; 1988. Statistical ecology; pp. 89–95. [Google Scholar]
- 6.Socransky SS, Haffajee AD, Smith C, Dibart S. Relation of counts of microbial species to clinical status at the sampled site. J Clin Periodontol. 1991;18:766–775. doi: 10.1111/j.1600-051x.1991.tb00070.x. [DOI] [PubMed] [Google Scholar]
- 7.Haffajee AD, Socransky SS, Patel MR, Song X. Microbial complexes in supragingival plaque. Oral Microbiol Immunol. 2008;23:196–205. doi: 10.1111/j.1399-302X.2007.00411.x. [DOI] [PubMed] [Google Scholar]
- 8.Loe H, Theilade E, Jensen SB. Experimental gingivitis in man. J Periodontol. 1965;36:177–187. doi: 10.1902/jop.1965.36.3.177. [DOI] [PubMed] [Google Scholar]
- 9.Theilade E, Wright WH, Jensen SB, Loe H. Experimental gingivitis in man. II. A longitudinal clinical and bacteriological investigation. J Periodont Res. 1966;1:1–13. doi: 10.1111/j.1600-0765.1966.tb01842.x. [DOI] [PubMed] [Google Scholar]
- 10.Daly CG, Highfield JE. Effect of localized experimental gingivitis on early supragingival plaque accumulation. J Clin Periodontol. 1996;23:160–164. doi: 10.1111/j.1600-051x.1996.tb02071.x. [DOI] [PubMed] [Google Scholar]
- 11.Ramberg P, Furuichi Y, Volpe AR, Gaffar A, Lindhe J. The effects of antimicrobial mouthrinses on de novo plaque formation at sites with healthy and inflamed gingivae. J Clin Periodontol. 1996;23:7–11. doi: 10.1111/j.1600-051x.1996.tb00497.x. [DOI] [PubMed] [Google Scholar]


