

Abstract
The binding of sequence-specific regulatory factors and the recruitment of chromatin remodeling activities cause nucleosomes to be evicted from chromatin in eukaryotic cells. Traditionally, these active sites have been identified experimentally through their sensitivity to nucleases. Here we describe the details of a simple procedure for the genome-wide isolation of nucleosome-depleted DNA from human chromatin, termed FAIRE (Formaldehyde Assisted Isolation of Regulatory Elements). We also provide protocols for different methods of detecting FAIRE-enriched DNA, including use of PCR, DNA microarrays, and next-generation sequencing. FAIRE works on all eukaryotic chromatin tested to date. To perform FAIRE, chromatin is crosslinked with formaldehyde, sheared by sonication, and phenol-chloroform extracted. Most genomic DNA is crosslinked to nucleosomes and is sequestered to the interphase, whereas DNA recovered in the aqueous phase corresponds to nucleosome-depleted regions of the genome. The isolated regions are largely coincident with the location of DNaseI hypersensitive sites, transcriptional start sites, enhancers, insulators, and active promoters. Given its speed and simplicity, FAIRE has utility in establishing chromatin profiles of diverse cell types in health and disease, isolating DNA regulatory elements en masse for further characterization, and as a screening assay for the effects of small molecules on chromatin organization.
Keywords: Regulatory elements, chromatin accessibility, nucleosome occupancy, histone, FAIRE, DNase hypersensitivity, transcriptional regulation
Introduction
In eukaryotes, packaging of DNA into chromatin reduces the accessibility of genetic information to the set of proteins involved in regulating DNA-templated processes such as transcription. Successful orchestration of DNA-dependent processes is achieved in part by regulating the stability of nucleosomes at these sites [1–3]. Here “stability” refers to the probability of an intact nucleosome at a given nucleotide position, versus a nucleosome in an absent or disrupted state at that position. Several mechanisms exist to modulate nucleosome stability, including competition with sequence-specific factors [4–7], ATP-dependent nucleosome remodeling complexes [8–10] and post-translational modifications of the histone tails [11–14]. Nucleosome stability at any given locus is governed by a combination of factors acting in concert, which results in a context-specific set of DNA elements bound by regulatory factors for each cell type.
Traditionally, active regulatory elements have been identified by their increased sensitivity to nuclease digestion, such as DNase I [15–20]. Typically this involves subjecting isolated nuclei to a mild nuclease treatment, followed by detection using Southern blots to identify nuclease hypersensitive sites. Several groups have recently adapted the procedure for genome-wide detection with DNA microarrays or next-generation sequencing [21–24]. However, requirements for a clean nuclei preparation from a single-cell suspension, and the need for laborious enzyme titrations means that it is difficult to perform DNase hypersensitivity assays on solid tissues, on a limited number of cells, or in parallel on many different samples.
Here we describe an alternative strategy for genome-wide isolation of active regulatory elements termed FAIRE (Formaldehyde Assisted Isolation of Regulatory Elements). It is a simple, high-throughput procedure to isolate and map genomic regions depleted of nucleosomes. The procedure involves crosslinking proteins to DNA using formaldehyde, shearing the chromatin, and performing a phenol-chloroform extraction. The genomic regions preferentially segregated into the aqueous phase are then mapped back to the genome by hybridization to tiling microarrays or are read directly using next-generation DNA sequencing (Figure 1). Quantitative PCR can be used to assay individual loci, which is useful when screening many cell or tissue types. The relatively straightforward nature and tractability of FAIRE has broad utility for the genome-wide detection of active regulatory elements across all eukaryotic species, in clinical samples, and for high-throughout screens.
Figure 1. FAIRE Procedure.
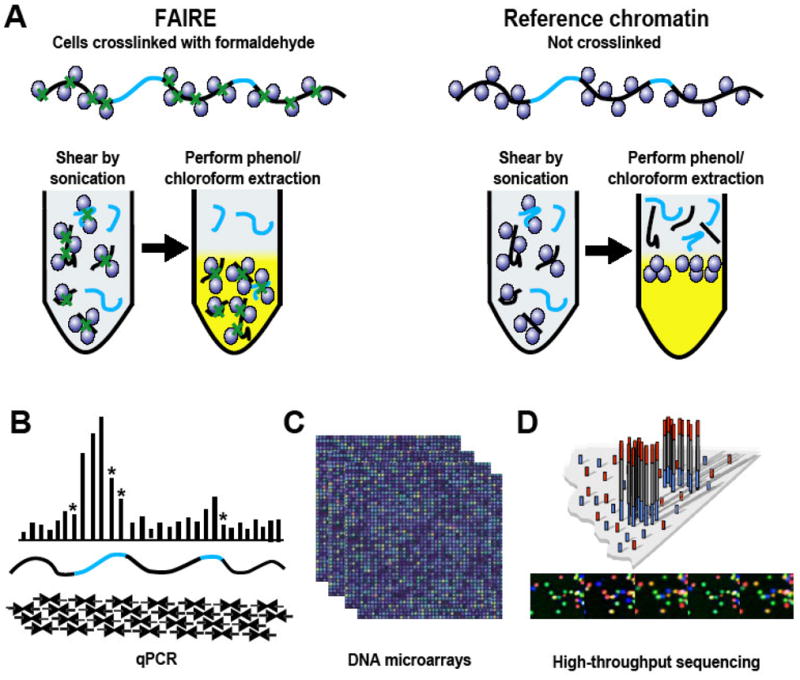
(A) The FAIRE procedure described in the text is shown on the left, while preparation of the reference or input sample is shown on the right. The DNA recovered from he aqueous phase of each extraction can then be used to identify sites of open chromatin using qPCR, tiling microarrays, or high-throughput sequencing applications. (B) For qPCR, a series of primers, depicted as convergent arrows, are designed to span a genomic region of interest. Sites of open chromatin are highlighted in blue, with qPCR results depicted above. Amplicons that span or are near the boundaries of open chromatin often result in lower relative enrichment due to shearing of DNA fragments, as shown by asterisks. (C) Microarrays. Typically we use high-resolution microarrays that tile either regions of interest or the entire genome of an organism with 50 to 70 bp oligonucleotides. (D) High-throughput sequencing technologies can be used to map the DNA fragments back to the reference genome.
FAIRE was first demonstrated in Saccharomyces cerevisiae [25]. In yeast, the genomic regions immediately upstream of genes were preferentially segregated into the aqueous phase, in a manner that was strongly negatively correlated with nucleosome occupancy [26–29]. Subsequent studies demonstrated that FAIRE efficiently isolated nucleosome-depleted regions of the Homo sapiens genome, which included both transcription start sites and distal regulatory elements such as enhancers and silencers [30] (Figure 2). Results from both yeast and human found that enrichment of the upstream regions of genes was positively correlated with transcription of the downstream gene. However, in human cells the vast majority of sites identified were far from any annotated gene. For the majority of these distal sites, it is not yet possible to ascribe a function, identify what factors might be bound, or determine the genes being regulated by each regulatory element.
Figure 2. FAIRE data.

DNA isolated by FAIRE in human lymphoblastoid cells was mapped to the genome using both the Illumina GAII (black) and NimbleGen tiling microarrays (red). A 60 kb region of Chromosome 19 is displayed in the UCSC genome browser. For sequencing data, the number of extended reads overlapping each base is plotted (see text). The FAIRE microarray data (red) is plotted as z-scores (see text). Also shown is DNaseI hypersensitivity (blue) [56], and H3K4 mono-, di-, and tri-methylation from human CD4+ cells [57]. Each of these datasets are represented as the density estimates from fseq. Black arrows represent the UCSC Known Genes [58], with arrowheads indicating the direction of transcription. The FAIRE data colocalizes with transcriptional start sites, DNaseI hypersensitive sites, and is adjacent to histone modifications indicative of active 5′ ends of genes.
The enrichment of regulatory regions in the aqueous phase is thought to result from the very high crosslinking efficiency of histone proteins to DNA, versus the lower efficiency of crosslinking sequence-specific proteins to DNA. This difference in crosslinking efficiency is likely due in part to formaldehyde’s very short crosslinking distance. Formaldehyde is a small molecule (HCHO) and crosslinks are only formed between proteins and DNA in direct contact. There are approximately 10 to 15 histone-DNA interactions within a nucleosome that serve as potential crosslinking sites [31]. However, for most DNA-binding proteins there are far fewer potential crosslinking sites. The average binding sites are 5 to 15 bp [32], with only a few of the bases close enough to the protein contacts be crosslinked [33]. In addition, formaldehyde requires a ε-amino group such as occurs on lysine, to form a crosslink [34,35]. Approximately 10% of the amino-acid composition of histones are lysine, a much higher proportion than a typical protein. Due to both of these factors nucleosomes are much more readily crosslinkable to DNA, and are likely to dominate the crosslinking profile (Figure 3).
Figure 3. Formaldehyde crosslinking efficiency as the basis for FAIRE.
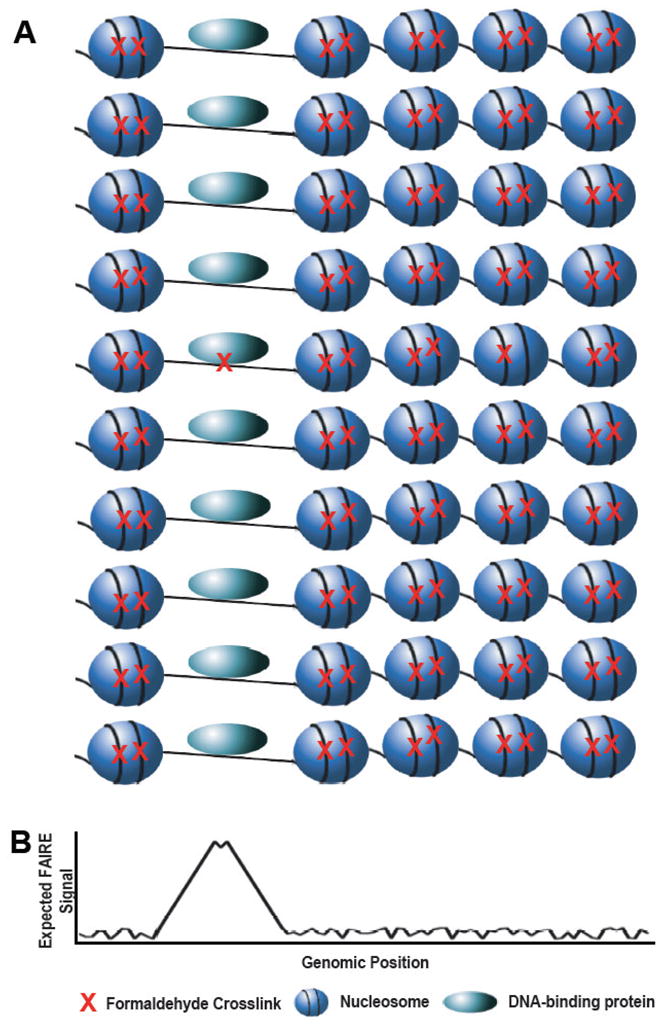
Crosslinking between histones and DNA (or between one histone and another) is likely to dominate the chromatin crosslinking profile. (A) Here are a representative set of features from eukaryotic chromatin, including nucleosomes (blue spheres), a DNA-binding protein (light blue oval), and DNA (black line). Crosslinking with formaldehyde (red X) for most genomics applications only captures a portion of the potential interactions. Given that histone-DNA interactions constitute the majority of crosslinkable interactions in the genome, in a population of cells (ten rows) all of these interactions are likely to be captured. Whereas only a small proportion of the interactions between other DNA-binding proteins and DNA is actually captured by formaldehyde crosslinking. (B) The plot represents the expected FAIRE signal, which is inversely correlated with the occurrence of crosslinkable protein-DNA interactions.
Methods
FAIRE procedure
The following provides a general framework for performing FAIRE, which specifically emphasizes performing FAIRE on cells grown in culture. The final methods section provides the modifications required to perform FAIRE on tissue samples. The protocols for cells and tissues are also included as one-page supplementary files for easier use at the bench.
Crosslinking
For cells grown in culture, add 37% formaldehyde directly to the growth media to a final concentration of 1% and incubate at room temperature on an orbital shaker at 80 rpm. Typically, we incubate for 30 minutes for yeast and 5 minutes for human cultured cells, although these times will vary for different species and cell types. Generally, whatever fixation time and conditions are used for ChIP (Chromatin Immunoprecipitation) experiments will be adequate for FAIRE, with slightly shorter fixation times often being optimal. To quench the fixation, add 2.5 M glycine to a final concentration of 125 mM and incubate for 5 min at room temperature while continuing to shake. Cells grown in suspension should be collected by centrifugation at 700 × g for 5 min at 4 °C. For adherent cells, first remove the media containing formaldehyde and glycine, add ice-cold PBS to cover the cell layer, scrape, and transfer the cells to a conical tube. For both adherent cells and cells in suspension, wash two more times with ice-cold PBS to ensure all residual media is removed.
Cell lysis
Resuspend cells in 1 ml of lysis buffer (2% Triton X-100, 1% SDS, 100 mM NaCl, 10 mM Tris-Cl pH 8.0, 1 mM EDTA) per 107 (or 0.4g of) cells. Transfer 1 ml of lysis solution to 2 ml screw-capped tube with rubber seal and add 1 ml of 500 μM glass beads. Cell disruption is performed in a mini bead-beater (Mini-BeadBeater-8, BioSpec Inc.) set to homogenize for five 1-minute sessions with 2-minute incubations on ice between sessions (see the alternative protocol if a Beadbeater is not available). To recover the lysate, puncture the bottom of the 2 ml tube with a 25G syringe and drain into 15 ml tube on ice. Once the lysate has drained, add an additional 500 μl lysis buffer to clear any remaining sample from the beads. Filtered air can be used to push the liquid through the hole in the bottom of the tube. Proceed directly to sonication.
Cell lysis: alternative protocol
If a bead-beater is not available, the following procedure is suitable for human or similar cell types, but not yeast [36]. This procedure often requires additional rounds of sonication. Add 10 ml of Lysis Buffer 1 (50 mM HEPES-KOH, pH 7.5, 140 mM NaCl, 1 mM EDTA, 10% glycerol, 0.5% NP-40, 0.25% Triton X-100) per 108 cells and rock at 4° C for 10 minutes. Spin at 1,300 × g for 5 minutes at 4° C and remove supernatant. Add 10 ml of Lysis Buffer 2 (10 mM Tris-HCl, pH 8.0, 200 mM NaCl, 1 mM EDTA, 0.5 mM EGTA) per 108 cells and rock at room temperature for 10 minutes. Spin at 1,300 × g for 5 minutes at 4° C and remove supernatant, at this point the pellet should appear white and fluffy. Add 3.5 ml of Lysis Buffer 3 (10 mM Tris-HCl, pH 8.0, 100 mM NaCl, 1 mM EDTA, 0.5 mM EGTA, 0.1% Na-Deoxycholate, 0.5% N-lauroylsarcosine) per 108 cells. Proceed directly to sonication.
Sonication
Transfer the lysate to 1.5 ml tubes in 300 μl aliquots and sonicate for 15 minutes using a Bioruptor UCD-200 (Diagenode) set to pulse on high for 30 seconds followed by 30 seconds of rest. The water bath should be maintained at a constant temperature of 4° C using a recirculator. Alternatively one may use a microtip sonicator (Branson Sonifier 450) set at 15% amplitude for five sessions of sixty pulses (1 second on/1 second off), incubating the sample on ice for two minutes between sessions. Clear the lysate of cellular debris by spinning at 15,000 × g for 5 minutes at 4° C, transfer supernatant to a new tube. Run an aliquot, equivalent to 500 ng total genomic DNA, on a 1% agarose gel to ensure fragment sizes range between 100–1000 bp.
Phenol/Chloroform extraction
Add a volume of phenol/chloroform (Sigma #P3803 phenol, chloroform, and isoamyl alcohol 25:24:1 saturated with 10mM Tris, pH 8.0, 1 mM EDTA) that is equal to the volume of the lysate, vortex well, spin at 12,000 × g for 5 minutes, and transfer the aqueous fraction to a fresh 1.5 ml tube. If there is very little aqueous phase due to an exceptionally large interphase, remove aqueous phase, add 500 μl TE to old interphase, vortex, and spin again. To ensure all protein has been removed, perform an additional extraction by adding an equal volume of phenol/chloroform to the isolated aqueous fraction. Finally, add an equal volume of chloroform (Fluka BioChemika 25666, chloroform, isoamyl alcohol 24:1) to the aqueous fraction, spin, and transfer aqueous phase to a new tube.
DNA precipitation
Add 3M sodium acetate (pH 5.2) to a final concentration of 0.3 M, and add 1 μl of 20 mg/ml glycogen. Mix by inverting. Add two volumes of 95% ethanol mix by inverting and incubate at −20° C overnight. Although overnight incubations are routinely performed, incubation as short as one hour should be sufficient. Pellet the precipitate by spinning at 15,000 × g for 30 minutes at 4° C, wash the pellet with 500 μl ice cold 70% ethanol, spin at 15,000 × g for 5 minutes at room temperature, remove the supernatant, and dry pellet in a speed-vac. Resuspend the dried pellet in 50 μl of 10 mM Tris-HCl pH 7.5. Add 1 μl of 10 mg/ml RNase A and incubate for 1 hour at 37° C. Earlier versions of the protocol included a step that incubates DNA from crosslinked samples at 65° C overnight to ensure that any DNA-DNA crosslinks do not interfere with downstream enzymatic steps. However, we have found that skipping this step results in no detectable difference in the efficiency of downstream enzymatic reactions.
Clean up the sample using either a spin column capable of recovering small DNA fragments (75–200 bp) or perform an additional phenol/chloroform extraction and ethanol precipitation. We have found that this is necessary to achieve accurate spectrophotometric measurements of our samples for subsequent reactions. Depending on the number of cells used for FAIRE and the final concentration, it may be possible to see the size distribution of FAIRE DNA fragments on a 1% agarose gel, which typically ranges between 75–200 bp. However, gel verification is not necessary and is often omitted.
Tissue samples
The following modifications for performing FAIRE in tissues include steps to prepare the tissue sample for crosslinking, disassociating the cells, and cell lysis. These modifications have been successfully used on tissue samples as small as 10 mg. Other considerations for working with tissue samples include whether it is fresh or frozen, and how fibrous the tissue is. For fresh soft tissues, such as brain, simply mince the tissue into small pieces using a scalpel, transfer to a dounce with 1 ml of PBS containing 37% formaldehyde at a final concentration of 1%, and incubate for 5 minutes at room temperature (22–25°C) with swirling. Add 2.5 M glycine to a final concentration of 125 mM glycine and incubate for an additional 5 minutes. Disassociate the cells with a dounce homogenizer, wash two times with ice cold PBS, and proceed with cell lysis and all remaining steps for FAIRE as described above.
For previously frozen tissues or fresh fibrous tissues, samples should be placed in a 15 ml conical tissue grinder (VWR #47732-446), precooled in a liquid nitrogen bath, incubated for 10 minutes, and ground into a powder until roughly the consistency of sand. Remove the 15 ml tube containing the powder from liquid nitrogen bath, add 1.5 ml of room-temperature PBS containing 1% formaldehyde per 10 mg of tissue, and incubate for 7 minutes at room temperature. For most tissue types you can proceed with the protocol described above, but for especially tough tissue types use larger 2.8 mm ceramic or metal beads (Precellys CK28 or MK28) and perform additional cycles in the mini bead-beater for an efficient lysis before sonication.
Detection and analysis of FAIRE DNA
Quantitative PCR
Quantitative PCR (qPCR) is used both as a method for detecting open chromatin sites and as a means to validate sites identified using either DNA microarray or high-throughput sequencing data. There are several considerations when designing qPCR experiments, including selection of an appropriate set of reference regions, exact primer localization, and methods for quantitation of the results. It is important to select an appropriate set of reference regions since these will be used to calculate relative enrichment for all other sites tested. This can be difficult due to the limited knowledge of “gold standard” sites of closed chromatin available for most species. Even for cells in which sites of closed chromatin have been mapped, these may be limited to a specific growth condition. Therefore we often use a tiling approach (Figure 1B) for detection of open chromatin sites using qPCR. Here, primer pairs are designed such that the products are either overlapping or closely spaced across the genomic regions being interrogated. The reference regions are those primer sets flanking the regions isolated by FAIRE. This strategy is also useful for validating results from microarray and sequencing data, which requires a set of positive and negative sites to determine both sensitivity and specificity. Primer design is also critical for obtaining accurate results from qPCR, since primer pairs spanning or near the edges of open chromatin sites may be able to only detect a subset of the DNA fragments isolated in the aqueous phase (Figure 1B). Optimally, primer pairs should be designed to amplify 60–100 bp products within the central portion of the identified regions. We typically calculate the relative enrichment for each amplicon using the comparative cT method [37]. Here, a ratio is calculated using the signal from the FAIRE sample relative to the signal from DNA prepared from an uncrosslinked sample. All ratios are then normalized to the amplicon with the lowest ratio, which is typically from the reference regions. Relative quantitation is used in part because FAIRE enriches for mitochondrial DNA, and since the mitochondrial content can vary considerably between cells it is difficult to get an accurate measurement of the proportion of genomic DNA enriched in each of the FAIRE samples.
Detection by DNA microarray
High quality FAIRE data has been obtained from several microarray platforms, including Agilent, NimbleGen (Roche), and PCR-based arrays. Any microarray platform will suffice, but there are several factors to consider, such as the type of probe, the genomic regions covered, and the resolution [38]. One of the most important for FAIRE is selecting a microarray design with sufficient resolution (Figure 1C). For oligonucleotide (50–75 bp) tiling microarrays, probe-to-probe spacing should not exceed 100 bp if possible. Doing so reduces the number of probes per FAIRE site to just one or two.
Typically, we amplify the DNA using ligation-mediated (LM) PCR [39]. The DNA fragments are made blunt using T4 DNA polymerase, asymmetric linkers (5′-GCGGTGACCCGGGAGATCTGAATTC-3′ and 5′-GAATTCAGATC-3′) are ligated to the blunt ends using T4 DNA ligase, and then amplified by PCR with a primer complementary to the linker.
For dual-channel microarray platforms, DNA derived from uncrosslinked cells, processed in parallel to the crosslinked cells, is hybridized as the reference or input sample (Figure 1A). If it is not possible to obtain uncrosslinked cells, which is often the case when cells are limited or with tissues, crosslinks from a portion of the sample can be reversed and used as a reference. Remove an aliquot from the cleared lysate following sonication. Reverse crosslinks by incubating at 65° C overnight, and perform a phenol/chloroform extraction, ethanol precipitation, and RNase A treatment.
For tiling microarrays, raw data extraction is specific to the particular platform selected and entails image acquisition and feature quantitation. Data can be expressed as a raw intensity for single-channel platforms or as a log2 ratio for dual-channel platforms. For data preprocessing, we typically normalize each dataset by calculating the z-score for each log2 ratio. The z-score is calculated by subtracting the mean log2 ratio and dividing by the standard deviation, which centers every dataset on the mean and standardizes the variance. In this way, every dataset has a mean of 0 and standard deviation of 1. This methodology is only applicable to dual channel platforms, although alternative strategies are available for single channel platforms [40,41].
Identification of regions enriched by FAIRE can be accomplished using most existing peak-finding algorithms used for ChIP-chip experiments [42–45]. For microarray data we typically use ChIPOTle [46], which uses a sliding window to identify statistically significant signals that comprise a peak. The significance of each region is determined by reflecting the negative portion of the data about zero, and then assuming a Gaussian distribution to estimate the null distribution.
The three main user-adjustable parameters in ChIPOTle are window size, step size, and threshold. Briefly we have found the following parameters to be optimal for analyzing FAIRE data from oligonucleotide tiling microarrays. For microarrays with probes spaced every 38 bp we use a window size of 300 bp. Whereas for probe spacing of every 60 to 100 bp we use a 500 bp window size. The larger window size is necessary to ensure a sufficient number of probes are included in each window. We use a step size that is the average probe spacing, which is measured as the start of one probe to the start of the next. We often try a range of thresholds and look at how the overlap changes between replicates and genomic features.
High-throughput sequencing
Each of the high-throughput sequencing platforms utilizes a different sample preparation procedure. We are most familiar with library preparation of FAIRE DNA for the Illumina Genome Analyzer II (GAII) (Figure 1D). We use 100 to 200 ng of DNA for starting material. This procedure involves blunting the ends of the DNA fragments (Epicentre #ER0720), adding an “A” overhang (Epicentre #KL06041K), and ligating double-stranded adapters containing a T-overhang to the DNA fragments (Illumina #1000521). Ligation products are then run on a 2% agarose gel, and a portion of the gel corresponding to 125 bp– 275 bp is excised. It usually is not possible to see the DNA on the gel at this point. PCR amplification is then carried out using PfuUltraII (Stratagene #600670) and primers complimentary to the adapters (Illumina #1000537 and 1000538).
Raw data acquisition for the GAII entails image acquisition and base calling. Approximately 25 million mapped 36 bp reads are typically required for robust detection of FAIRE peaks in a mammalian sample. Several algorithms are available for mapping the reads back to the genome, each utilizing different computational and alignment strategies [47–49]. Typically we use Maq [50], which incorporates information about read quality into the alignment. Since only the first 36 bp from either end of each ~200 bp double-stranded DNA molecule is sequenced, we computationally extend each aligned read to produce 200 bp extended reads. For visualization, we count the number of extended reads overlapping every basepair in the genome, and compute a density by dividing by the total number of bases contained within the extended reads. These density estimates for each basepair can be loaded into genome browsers, such as the UCSC genome browser (Figure 2) [51].
Several algorithms exist for identifying enriched regions [52,53] for high-throughput sequencing data. Currently we use fseq [54], which calculates a density estimation for each base pair by summing the set of Gaussian distribution representing the center of each extended sequence read. Thresholds, based on the set of density estimates throughout the genome, can then be used to identify enriched regions. In addition to identifying regions of open chromatin, we are also able to identify copy number variations by analyzing large-scale (100 kb to 1 Mbp) changes in the data.
Concluding remarks
Several aspects of FAIRE make it a powerful genome-wide approach for detecting functional in vivo regulatory elements in eukaryotes. It requires little treatment of cells prior to the addition of formaldehyde and involves only a few reagents: formaldehyde, phenol, chloroform, and ethanol. The successful application of FAIRE on a limited numbers of cells expands its utility beyond what other DNA accessibility assays can accomplish. This provides an opportunity to perform genome-wide assays of chromatin structure on tissue samples from patients, or to grow cells in small-well plates to screen small molecules for chromatin effects. Additionally, since FAIRE recovers the complete DNA fragments at regulatory elements it is possible to use this material directly in functional assays, such as with reporter vectors.
Genome-wide maps of active regulatory elements will allow a better understanding of how the availability of sequence-based regulatory elements are coordinated with the regulation of factors that utilize them in a given cellular environment. The emerging set of consortium-based datasets, such as those derived from the ENCODE project [55], will provide a foundation for understanding the relationships among these factors, and be critical to constructing realistic models of gene regulation in eukaryotic cells. The next major challenge will be to functionally annotate the catalogue of regulatory elements discovered across a diverse set of cell types, organisms, and disease states.
Acknowledgments
We thank members of the Lieb lab for discussions. Support for this work has been provided by grants from the NHGRI.
Footnotes
Publisher's Disclaimer: This is a PDF file of an unedited manuscript that has been accepted for publication. As a service to our customers we are providing this early version of the manuscript. The manuscript will undergo copyediting, typesetting, and review of the resulting proof before it is published in its final citable form. Please note that during the production process errors may be discovered which could affect the content, and all legal disclaimers that apply to the journal pertain.
References
- 1.Abbott DW, Ivanova VS, Wang X, Bonner WM, Ausio J. J Biol Chem. 2001;276:41945–41949. doi: 10.1074/jbc.M108217200. [DOI] [PubMed] [Google Scholar]
- 2.Almer A, Rudolph H, Hinnen A, Horz W. Embo J. 1986;5:2689–2696. doi: 10.1002/j.1460-2075.1986.tb04552.x. [DOI] [PMC free article] [PubMed] [Google Scholar]
- 3.Boeger H, Griesenbeck J, Strattan JS, Kornberg RD. Mol Cell. 2003;11:1587–1598. doi: 10.1016/s1097-2765(03)00231-4. [DOI] [PubMed] [Google Scholar]
- 4.Morse RH. Biochem Cell Biol. 2003;81:101–112. doi: 10.1139/o03-039. [DOI] [PubMed] [Google Scholar]
- 5.Morse RH. Trends in Genetics. 2000;16:51–53. doi: 10.1016/s0168-9525(99)01936-8. [DOI] [PubMed] [Google Scholar]
- 6.Yu L, Morse RH. Molecular and Cellular Biology. 1999;19:5279–5288. doi: 10.1128/mcb.19.8.5279. [DOI] [PMC free article] [PubMed] [Google Scholar]
- 7.Polach KJ, Widom J. J Mol Biol. 1995;254:130–149. doi: 10.1006/jmbi.1995.0606. [DOI] [PubMed] [Google Scholar]
- 8.Sudarsanam P, Winston F. Trends Genet. 2000;16:345–351. doi: 10.1016/s0168-9525(00)02060-6. [DOI] [PubMed] [Google Scholar]
- 9.Varga-Weisz P. Oncogene. 2001;20:3076–3085. doi: 10.1038/sj.onc.1204332. [DOI] [PubMed] [Google Scholar]
- 10.Tsukiyama T, Wu C. Cell. 1995;83:1011–1020. doi: 10.1016/0092-8674(95)90216-3. [DOI] [PubMed] [Google Scholar]
- 11.Dion MF, Altschuler SJ, Wu LF, Rando OJ. Proc Natl Acad Sci U S A. 2005;102:5501–5506. doi: 10.1073/pnas.0500136102. [DOI] [PMC free article] [PubMed] [Google Scholar]
- 12.I. Dunham, Genome Research Submitted (2006)
- 13.Reinke H, Horz W. Mol Cell. 2003;11:1599–1607. doi: 10.1016/s1097-2765(03)00186-2. [DOI] [PubMed] [Google Scholar]
- 14.van Leeuwen F, van Steensel B. Genome Biol. 2005;6:113. doi: 10.1186/gb-2005-6-6-113. [DOI] [PMC free article] [PubMed] [Google Scholar]
- 15.Keene MA, Corces V, Lowenhaupt K, Elgin SC. Proc Natl Acad Sci U S A. 1981;78:143–146. doi: 10.1073/pnas.78.1.143. [DOI] [PMC free article] [PubMed] [Google Scholar]
- 16.Li Q, Zhang M, Han H, Rohde A, Stamatoyannopoulos G. Nucleic Acids Res. 2002;30:2484–2491. doi: 10.1093/nar/30.11.2484. [DOI] [PMC free article] [PubMed] [Google Scholar]
- 17.Sollner-Webb B, Camerini-Otero RD, Felsenfeld G. Cell. 1976;9:179–193. doi: 10.1016/0092-8674(76)90063-5. [DOI] [PubMed] [Google Scholar]
- 18.Weintraub H, Groudine M. Science. 1976;193:848–856. doi: 10.1126/science.948749. [DOI] [PubMed] [Google Scholar]
- 19.Wu C. Nature. 1980;286:854–860. doi: 10.1038/286854a0. [DOI] [PubMed] [Google Scholar]
- 20.Wu C, Wong YC, Elgin SC. Cell. 1979;16:807–814. doi: 10.1016/0092-8674(79)90096-5. [DOI] [PubMed] [Google Scholar]
- 21.Crawford GE, Davis S, Scacheri PC, Renaud G, Mohamad JH, Erdos MR, Green RD, Meltzer PS, Wolfsberg TG, Collins FS. Nat Methods. 2006 doi: 10.1038/NMETH888. in press. [DOI] [PMC free article] [PubMed] [Google Scholar]
- 22.Dorschner MO, Hawrylycz M, Humbert R, Wallace JC, Shafer A, Kawamoto J, Mack J, Hall R, Goldy J, Sabo PJ, Kohli A, Li Q, McArthur M, Stamatoyannopoulos JA. Nat Methods. 2004;1:219–225. doi: 10.1038/nmeth721. [DOI] [PubMed] [Google Scholar]
- 23.Sabo PJ, Kuehn MS, Thurman R, Johnson BE, Johnson EM, Cao H, Yu M, Rosenzweig E, Goldy J, Haydock A, Weaver M, Shafer A, Lee K, Neri F, Humbert R, Singer MA, Richmond TA, Dorschner MO, McArthur M, Hawrylycz M, Green RD, Navas PA, Noble WS, Stamatoyannopoulos JA. Nat Methods. 2006;3:511–518. doi: 10.1038/nmeth890. [DOI] [PubMed] [Google Scholar]
- 24.Giresi PG, Lieb JD. Nat Methods. 2006;3:501–502. doi: 10.1038/nmeth0706-501. [DOI] [PubMed] [Google Scholar]
- 25.Nagy PL, Cleary ML, Brown PO, Lieb JD. Proc Natl Acad Sci U S A. 2003;100:6364–6369. doi: 10.1073/pnas.1131966100. [DOI] [PMC free article] [PubMed] [Google Scholar]
- 26.Bernstein BE, Liu CL, Humphrey EL, Perlstein EO, Schreiber SL. Genome Biol. 2004;5:R62. doi: 10.1186/gb-2004-5-9-r62. [DOI] [PMC free article] [PubMed] [Google Scholar]
- 27.Hogan GJ, Lee CK, Lieb JD. PLoS Genet. 2006;2:e158. doi: 10.1371/journal.pgen.0020158. [DOI] [PMC free article] [PubMed] [Google Scholar]
- 28.Lee CK, Shibata Y, Rao B, Strahl BD, Lieb JD. Nat Genet. 2004;36:900–905. doi: 10.1038/ng1400. [DOI] [PubMed] [Google Scholar]
- 29.Yuan GC, Liu YJ, Dion MF, Slack MD, Wu LF, Altschuler SJ, Rando OJ. Science. 2005;309:626–30. doi: 10.1126/science.1112178. [DOI] [PubMed] [Google Scholar]
- 30.Giresi PG, Kim J, McDaniell RM, Iyer VR, Lieb JD. Genome Res. 2007;17:877–885. doi: 10.1101/gr.5533506. [DOI] [PMC free article] [PubMed] [Google Scholar]
- 31.Luger K, Mader AW, Richmond RK, Sargent DF, Richmond TJ. Nature. 1997;389:251–260. doi: 10.1038/38444. [DOI] [PubMed] [Google Scholar]
- 32.Bulyk ML. Genome Biol. 2004;5:331. doi: 10.1186/gb-2004-5-7-331. [DOI] [PMC free article] [PubMed] [Google Scholar]
- 33.Garvie CW, Wolberger C. Mol Cell. 2001;8:937–946. doi: 10.1016/s1097-2765(01)00392-6. [DOI] [PubMed] [Google Scholar]
- 34.Brutlag D, Schlehuber C, Bonner J. Biochemistry. 1969;8:3214–3218. doi: 10.1021/bi00836a013. [DOI] [PubMed] [Google Scholar]
- 35.Solomon MJ, Varshavsky A. Proc Natl Acad Sci U S A. 1985;82:6470–6474. doi: 10.1073/pnas.82.19.6470. [DOI] [PMC free article] [PubMed] [Google Scholar]
- 36.Lee TI, Johnstone SE, Young RA. Nat Protoc. 2006;1:729–748. doi: 10.1038/nprot.2006.98. [DOI] [PMC free article] [PubMed] [Google Scholar]
- 37.Livak KJ, Schmittgen TD. Methods. 2001;25:402–408. doi: 10.1006/meth.2001.1262. [DOI] [PubMed] [Google Scholar]
- 38.Buck MJ, Lieb JD. Genomics. 2004;83:349–360. doi: 10.1016/j.ygeno.2003.11.004. [DOI] [PubMed] [Google Scholar]
- 39.Ren B, Robert F, Wyrick JJ, Aparicio O, Jennings EG, Simon I, Zeitlinger J, Schreiber J, Hannett N, Kanin E, Volkert TL, Wilson CJ, Bell SP, Young RA. Science. 2000;290:2306–2309. doi: 10.1126/science.290.5500.2306. [DOI] [PubMed] [Google Scholar]
- 40.Johnson WE, Li W, Meyer CA, Gottardo R, Carroll JS, Brown M, Liu XS. Proc Natl Acad Sci U S A. 2006;103:12457–12462. doi: 10.1073/pnas.0601180103. [DOI] [PMC free article] [PubMed] [Google Scholar]
- 41.Bolstad BM, Irizarry RA, Astrand M, Speed TP. Bioinformatics. 2003;19:185–193. doi: 10.1093/bioinformatics/19.2.185. [DOI] [PubMed] [Google Scholar]
- 42.Kim TH, Barrera LO, Zheng M, Qu C, Singer MA, Richmond TA, Wu Y, Green RD, Ren B. Nature. 2005;436:876–880. doi: 10.1038/nature03877. [DOI] [PMC free article] [PubMed] [Google Scholar]
- 43.Gibbons FD, Proft M, Struhl K, Roth FP. Genome Biol. 2005;6:R96. doi: 10.1186/gb-2005-6-11-r96. [DOI] [PMC free article] [PubMed] [Google Scholar]
- 44.Ji H, Wong WH. Bioinformatics. 2005;21:3629–3636. doi: 10.1093/bioinformatics/bti593. [DOI] [PubMed] [Google Scholar]
- 45.Zhang ZD, Rozowsky J, Lam HY, Du J, Snyder M, Gerstein M. Genome Biol. 2007;8:R81. doi: 10.1186/gb-2007-8-5-r81. [DOI] [PMC free article] [PubMed] [Google Scholar]
- 46.Buck MJ, Nobel AB, Lieb JD. Genome Biol. 2005;6:R97. doi: 10.1186/gb-2005-6-11-r97. [DOI] [PMC free article] [PubMed] [Google Scholar]
- 47.Li R, Li Y, Kristiansen K, Wang J. Bioinformatics. 2008;24:713–714. doi: 10.1093/bioinformatics/btn025. [DOI] [PubMed] [Google Scholar]
- 48.Smith AD, Xuan Z, Zhang MQ. BMC Bioinformatics. 2008;9:128. doi: 10.1186/1471-2105-9-128. [DOI] [PMC free article] [PubMed] [Google Scholar]
- 49.Li W, Carroll JS, Brown M, Liu S. BMC Genomics. 2008;9(Suppl 1):S20. doi: 10.1186/1471-2164-9-S1-S20. [DOI] [PMC free article] [PubMed] [Google Scholar]
- 50.Li H, Ruan J, Durbin R. Genome Res. 2008;18:1851–1858. doi: 10.1101/gr.078212.108. [DOI] [PMC free article] [PubMed] [Google Scholar]
- 51.Hinrichs AS, et al. Nucleic Acids Res. 2006;34:D590–598. doi: 10.1093/nar/gkj144. [DOI] [PMC free article] [PubMed] [Google Scholar]
- 52.Zhang Y, Liu T, Meyer CA, Eeckhoute J, Johnson DS, Bernstein BE, Nussbaum C, Myers RM, Brown M, Li W, Liu XS. Genome Biol. 2008;9:R137. doi: 10.1186/gb-2008-9-9-r137. [DOI] [PMC free article] [PubMed] [Google Scholar]
- 53.Fejes AP, Robertson G, Bilenky M, Varhol R, Bainbridge M, Jones SJ. Bioinformatics. 2008;24:1729–1730. doi: 10.1093/bioinformatics/btn305. [DOI] [PMC free article] [PubMed] [Google Scholar]
- 54.Boyle AP, Guinney J, Crawford GE, Furey TS. Bioinformatics. 2008;24:2537–2538. doi: 10.1093/bioinformatics/btn480. [DOI] [PMC free article] [PubMed] [Google Scholar]
- 55.Birney E, et al. Nature. 2007;447:799–816. doi: 10.1038/nature05874. [DOI] [PMC free article] [PubMed] [Google Scholar]
- 56.Boyle AP, Davis S, Shulha HP, Meltzer P, Margulies EH, Weng Z, Furey TS, Crawford GE. Cell. 2008;132:311–322. doi: 10.1016/j.cell.2007.12.014. [DOI] [PMC free article] [PubMed] [Google Scholar]
- 57.Wang Z, Zang C, Rosenfeld JA, Schones DE, Barski A, Cuddapah S, Cui K, Roh TY, Peng W, Zhang MQ, Zhao K. Nat Genet. 2008;40:897–903. doi: 10.1038/ng.154. [DOI] [PMC free article] [PubMed] [Google Scholar]
- 58.Hsu F, Kent WJ, Clawson H, Kuhn RM, Diekhans M, Haussler D. Bioinformatics. 2006;22:1036–1046. doi: 10.1093/bioinformatics/btl048. [DOI] [PubMed] [Google Scholar]