

Abstract
The clinical use of dendritic cells (DCs) to induce antigen-specific immune tolerance has been hampered by the lack of a widely acknowledged method for generating human regulatory DCs but even more so by the non-existence of reliable markers. Thus, we set out to find reliable markers that can be measured with simple methods to identify regulatory DCs that are applicable for future clinical studies. Human DCs were generated from peripheral blood monocytes in the presence of 1α,25-dihydroxyvitamin D3 (VD3), which gave rise to a phenotype that resembles immature DCs, with the exception of high CD14 and reduced CD1a on the cell surface. These VD3-treated DCs exert a long-lasting inefficient T cell stimulation and induce T cell hyporesponsiveness with regulatory potential. Importantly, such VD3-treated DCs were readily distinguishable from untreated DCs by low levels of interleukin-23 secretion and low expression of miR-155 upon exposure to maturation stimuli. Furthermore, VD3-treated DCs showed over-expression of miR-378. All these features can be used as robust markers for quality control of VD3-treated regulatory DCs in future clinical studies.
Keywords: 1α@25-dihydroxyvitamin D3, human DC, regulatory DC
Introduction
Dendritic cells (DCs), often termed ‘nature's adjuvant’, are specialized antigen-presenting cells and considered to be the most powerful regulators of the immune system [1]. Ever since the establishment of methods for propagating this rare cell type in vitro[2,3], an overwhelming interest has emerged to explore DCs clinically as a strategy for immunotherapeutic intervention. Indeed, since the first published clinical trial of DC vaccination in 1995 [4], the number of such studies is increasing every year [5]. More recent studies also support the use of DCs, not as a tool to induce an immune response but for suppressing a response, such as in autoimmune diseases or transplantation [6–8].
The biologically active form of vitamin D, 1α,25-dihydroxyvitamin D3 (VD3), is a secosteroid hormone that binds to the vitamin D receptor (VDR), a member of the superfamily of nuclear receptors for steroid hormones, thyroid hormone and retinoic acid. VDR ligands regulate calcium/phosphate metabolism, control cell proliferation and differentiation and exert immunoregulatory activities [7,9,10]. VD3 inhibits the differentiation and maturation of DCs derived ex vivo from either human peripheral blood monocytes [11–15] or mouse bone marrow [16]. In these studies, VD3 and its analogues induce down-regulated expression of the co-stimulatory molecules CD40, CD80 and CD86, and decreased interleukin (IL)-12 and enhanced IL-10 production in DCs, resulting in decreased T cell activation. In addition, VDR ligands can also induce DCs with regulatory properties in vivo, in models of transplantation [16–18] and autoimmunity [17,19]. Not surprisingly, an increasing number of studies now focus upon the potential application of VD3-treated DCs for clinical settings aimed at controlling autoimmunity [15,20,21].
Currently, the major concern over the clinical use of immunosuppressive or regulatory DCs is (i) the absence of clear-cut guidelines for generating functionally stable DCs [8]; and (ii) the lack of information on molecules and markers delineating regulatory DCs. Because of the versatile function of DCs, identification of their functional phenotype is extremely crucial prior to administering a DC vaccine to patients. While development of standardized quality control (QC) for immunogenic DCs is under way [22], development of such measure for regulatory DCs is still non-existent.
Regulatory DCs described by many studies show common features, such as the reduced levels of co-stimulatory molecules and low IL-12 production; however, many of these features are also shared by unmodified immature DCs (which are not stable and prone to differentiate into functionally immunogenic DCs), therefore making them unreliable to use as a QC measure. Thus, the aim of this study was to find reliable markers that can be used as a QC for VD3-modified regulatory DCs generated from peripheral blood monocytes.
Materials and methods
Generation of DCs
The DCs were prepared according to a modified protocol originally described by Romani et al.[3]. Briefly, peripheral blood mononuclear cells (PBMCs) were isolated by gradient centrifugation on Lymphoprep (Nycomed, Oslo, Norway) and the isolated cells were subjected to plastic adherence for 60 min followed by removal of the non-adherent cells. Adherent cells were cultured in the presence of 700 U/ml human recombinant IL-4 (Gentaur, Brussels, Belgium) and 1400 U/ml human recombinant granulocyte–macrophage colony-stimulating factor (Gentaur) as well as 1·2% autologous plasma for 6 days, replenishing the medium/cytokines after 3 and 5 days. After 6 days of culture DCs were stimulated and cultured for a further 24 h with or without a maturation cocktail [10 ng/ml IL-1β (Gentaur), 10 ng/ml IL-6 (Gentaur), 10 ng/ml tumour necrosis factor-α (Gentaur) and 1 µg/ml prostaglandin E2 (PGE2) (Sigma Aldrich, St Louis, MO, USA)], and the resulting DCs are termed untreated mature (UTmat)-DCs or untreated (UT)-DCs respectively. In some experiments DCs were stimulated with 100 ng/ml lipopolysaccharide (LPS) (Escherichia coli, 055: B5; Sigma Aldrich) instead of the maturation cocktail. To generate VD3-treated DCs, 10–8 M 1,25(OH)2D3 (Sigma Aldrich) was added on days 0, 3 and 5 to DC culture prepared as described above, and after 6 days of culture DCs were stimulated and cultured for a further 24 h in the absence (VD3-DCs) or presence of the maturation cocktail (VD3mat-DCs) or LPS, as for UT-DCs. In some experiments, DCs prepared were collected, washed twice and cultured in the presence or absence of 100 ng/ml LPS for a further 48 h.
Allogeneic mixed lymphocyte reaction
Primary mixed lymphocyte reaction
Responder cells were either non-adherent fractions of PBMCs collected after the cell adherence step used in monocyte preparation or CD4+ T cells purified from the non-adherent cells using CD4 magnetic affinity cell sorting (MACS) magnetic beads following the manufacturer's recommendation (Miltenyi, Bergisch-Gladbach, Germany). DCs prepared as described above from another donor were treated with 20 µg/ml mitomycin-c (Sigma Aldrich) at 37°C for 1 h and washed extensively before a titrating number of DCs were added to responder cells (105 cells) in 96-well plates (Nunc, Roskilde, Denmark). After 4 days of co-culture bromodeoxyuridine (BrdU) incorporation was measured by pulsing them with BrdU for 16 h, and incorporated BrdU was analysed by enzyme-linked immunosorbent assay (ELISA) (Roche, Penzberg, Germany). Assay cultures were set up in quadruplicate. In some experiments, human recombinant cytokines (IL-12 and IL-23, both from eBioscience, San Diego, CA, USA) were added at 1 ng/ml when the co-culture was set up.
Secondary mixed lymphocyte reaction
DCs (from donor A) were treated with mitomycin-c as above and co-cultured with allogeneic CD4+ T cells (donor B) at a 1:10 ratio, as for the primary mixed lymphocyte reaction (MLR). Three days later T cells were separated by CD4 MACS magnetic beads (Miltenyi) and rested in the presence of 2 U/ml IL-2 (Gentaur) for a further 7 days. Subsequently, T cells were recovered, washed and plated (105 cells per well) with a titrating number of UTmat-DCs from the original donor (donor A). Cell proliferation was measured 3 days later by quantifying the BrdU as above.
Cytomegalovirus antigen recall response (interferon-γ enzyme-linked immunospot assay)
Primary recall response
One day prior to setting up the experiment a 96-well enzyme-linked immunospot (ELISPOT) plate (Multiscreen HTS system; Millipore, Copenhagen, Denmark) was coated with an anti-interferon (IFN)-γ antibody (1D1K; Mabtech, Nacka Strand, Sweden). On the day of the experiment, the plate was washed six times with phosphate-buffered saline and incubated with AIM-V medium (Invitrogen, Carlsbad, CA, USA) for 2 h at 37°C before use. CD8+ T cells were sorted negatively from PBMCs using MACS magnetic beads (Miltenyi) according to the manufacturer's protocol, and 105 T cells were plated per well. DCs generated from the same donor were incubated with or without 5 µM cytomegalovirus (CMV) pp65 peptide, NLVPMVATV (Schafer-N, Copenhagen, Denmark) for 2 h, washed twice and added to the CD8+ T cells (DC : T cell ratio of 1:20). The co-culture was incubated at 37°C for 18 h before the frequency of IFN-γ-secreting cells was determined by ELISPOT (all reagents were purchased from Mabtech). The number of spots was numerated by digitalized ELISPOT counter (ImmunoSpot; CTL-Europe, Aarlen, Germany).
Secondary recall response
CMV peptide-loaded DCs and CD8+ were prepared as in the primary recall response, and the cells were co-cultured at a DC : T cell ratio of 1:20. Two days later T cells were separated using CD8+ MACS magnetic beads (Miltenyi) and rested in the presence of 2 U/ml IL-2 for a further 6 days. Subsequently, T cells were recovered, washed and plated (3 × 10⁴) in an anti-IFN-γ antibody-coated ELISPOT plate together with UTmat-DCs (103, ± CMV pp65 peptide), and the frequency of IFN-γ-secreting cells was determined by ELISPOT as described above.
T cell suppression assay
Co-cultures between DCs (donor C) and CD4+ T cells (donor D) were set up (at a ratio of 1 : 20) as for the MLR, described above. Three days after the co-culture T cells were separated from DCs by CD4 MACS magnetic beads (Miltenyi) and rested for a further 7 days. T cells were then collected and titrating numbers of these T cells were then added to co-culture between untreated naive CD4+ T cells (2 × 10⁴, donor D) and mitomycin-c treated UTmat-DCs (2 × 10³, donor C). Supernatant from the culture was collected 5 days later and secreted cytokines were quantified by ELISA (described below).
Flow cytometry analysis of DC surface molecules
The DCs to be analysed were incubated for 15 min with 5% human AB serum (Lonza, Basel, Switzerland) prior to labelling with fluorescein-conjugated antibodies. The following mouse monoclonal antibodies were used: anti-CD14 [M5E2; Becton Dickinson (BD), San Jose, CA, USA], anti-CD1a (HI149; BD), anti-human leucocyte antigen D-related (HLA-D) ( ; BD), anti-CD40 (5C3; eBioscience), anti-CD80 (2D10·4; eBioscience), anti-CD86 (FUN-1; BD), anti-CCR7 (150503; R&D Systems, Abingdon, UK), anti-CD83 (HB15e; BD), anti-CD274/PD-L1 (MIH1; eBioscience), anti-ILT3 (293623; R&D Systems), anti-ILT4 (287219; R&D Systems), anti-CCR5 (2D7/CCR5; BD), anti-CXCR3 (49801; R&D Systems) and appropriate isotype controls (eBioscience and BD). All labelled cells were analysed on a fluorescence activated cell sorter [Calibur (BD)].
Indoleamine 2,3-dioxygenase assay
Tryptophan and kynurenine concentrations from the cell supernatant were determined by high-performance liquid chromatography, as described previously [23]. After precipitation of protein with trichloroacetic acid, tryptophan was measured by fluorescence detection at 285 nm excitation and 365 nm emission wavelengths. Kynurenine was monitored by ultraviolet-absorption at 360 nm wavelength. To estimate indoleamine 2,3-dioxygenase (IDO) activity, the ratio of the concentrations of the enzyme product kynurenine to the substrate tryptophan (kynurenine to tryptophan ratio = kyn/trp) was calculated [24].
Cytokine ELISA
Cell culture supernatants were collected and stored at –80°C. Amounts of IL-12p70, IL-23, IL-10 and IFN-γ were measured by standard sandwich ELISA using commercially available antibodies and standards according to the manufacturer's protocols (eBioscience).
MicroRNA array analysis
The DCs were prepared from three different donors, as described above. Total RNA from these DCs were extracted using Trizol, as outlined by the manufacturer (Invitrogen, Paisley, UK). Two micrograms of total RNA was labelled with Hy5 (for UT-DCs) and Hy3 (for UTmat-DCs or VD3mat-DCs) and vice versa using the miRCURY LNA Array labelling kit (Exiqon, Vedvaek, Denmark). The labelled RNA samples were mixed prior to hybridization to the microarray using the miRCURY LNA microRNA (miRNA) array (Exiqon) corresponding to version 8·1 of the Sanger miRBase. After hybridization and washes, the dried slides were scanned in an ArrayWoRx white-light CCD-based scanner (Applied Precision, Issaquah, WA, USA) at a 10 µm resolution. The resulting images were imported into ImaGene 8·0 (BioDiscovery, El Segundo, CA, USA) where spot intensities and background measurements were calculated. To identify differentially expressed miRNAs between UT-DCs and UTmat-DCs or VD3mat-DCs, a ratio analysis was conducted using GeneSight-Lite 4·1·6 (BioDiscovery). Ratio values from all experiments were compiled using both Lowess and division by mean signal normalization. Prior to statistical analysis, ratio values were log2-transformed and a one-class t-test assuming unequal variance between the samples was conducted to identify miRNAs that had ratio values significantly (P < 0·05) different from 0. To substantiate further the statistical analysis of differential expression of miRNAs, a more rigid significance analysis of microarray (SAM) was conducted on the data, selecting only the miRNAs capable of fulfilling the criteria of a false discovery rate of 0%, i.e. there is no risk that the differentially expressed miRNAs would have been identified by chance as being significant.
Validation of microRNA differential expression using real-time reverse transcription–polymerase chain reaction
Differential expression of selected miRNAs was validated including additional donors using the TaqMan MicroRNA assays (Applied Biosystems, Foster City, CA, USA). Briefly, single-stranded cDNA was synthesized from 10 ng of total RNA using the looped primers of the TaqMan MicroRNA assay and the TaqMan MicroRNA reverse transcription kit (Applied Biosystems). Each cDNA generated was amplified by real-time polymerase chain reaction (PCR) using the sequence-specific primers from the TaqMan MicroRNA assay, following the standard TaqMan MicroRNA assays protocol on the ABI StepOne Plus real-time PCR machine (Applied Biosystems). The reactions were incubated in a 96-well plate at 95°C for 10 min followed by 40 cycles of 95°C for 15 s and 60°C for 1 min. Each sample was analysed in triplicate. The level of miRNA expression was measured using Ct (threshold cycle) according to the Ct method described [25]. To normalize the relative abundance of miRNAs, U6 RNA as endogenous control was detected using the TaqMan MicroRNA assay for U6 RNA. The Ct was calculated by subtracting the Ct of U6 RNA from the Ct of the respective miRNA. The Ct was calculated by subtracting the Ct of the reference sample (UT-DCs) from the Ct of the respective different DC phenotypes.
Statistics
Unless indicated otherwise, data are expressed as the mean ± standard deviation, and the comparisons were performed using Student's t-test. A P-value of < 0·05 was considered statistically significant.
Results
The VD3-treated DCs are poor stimulators of T cells and induce T cell hyporesponsiveness
Monocytes derived from PBMC were cultured with granulocyte–macrophage colony-stimulating factor/IL-4 in the presence or absence of VD3 for 7 days (termed VD3-DCs or UT-DCs respectively), where some of the DCs were stimulated with maturation-inducing cocktail (tumour necrosis factor-α, IL-1β, IL-6 and PGE2) or LPS for the last 24 h of culture. DCs were then washed extensively and used as stimulators in an allogeneic MLR. As shown in Fig. 1a, UT-DCs induce augmented levels of T cell proliferation upon exposure to either of the maturation stimuli, whereas VD3-DCs remain poor stimulators of allogeneic CD4+ T cells irrespective of their exposure to the maturation stimuli. This functional phenotype of VD3-DCs remained intact after the DCs were washed and then cultured in the presence of the maturation cocktail for a further 3 days (data not shown). To determine whether the function of responding T cells in MLR was suppressed actively by VD3-DCs, an allogeneic MLR was set up between DCs from donor A and CD4+ T cells from donor B. Three days after the co-culture DCs were removed from T cells, and T cells were rested in culture for 7 days. The ability of the recovered T cells to respond to untreated DCs that have been exposed to the maturation cocktail (UTmat-DCs) was then examined. As shown in Fig. 1b, T cells that were stimulated originally by UT-DCs, VD3-DCs or VD3mat-DCs respond poorly to the second stimulation by immunogenic UTmat-DCs. Similarly, recall response of CD8+ T cells against a CMV pp65 peptide was also reduced when VD3-DCs were used as antigen-presenting cells, again irrespective of their exposure to maturation stimulus (Fig. 1c, left panel). As with the previous experiment, the ability of the T cells that had been stimulated with VD3-DCs to be able to respond to a second in vitro stimulation by the CMV peptide in the context of UTmat-DCs was tested. After 7 days of resting period in culture, T cells that were primed with UT-DCs, VD3-DCs or VD3mat-DCs sustain a poor response to a second stimulation by UTmat-DCs (Fig. 1c, right panel). A similar observation was made when LPS was used instead of the maturation cocktail for stimulation of DCs (data not shown).
Fig. 1.
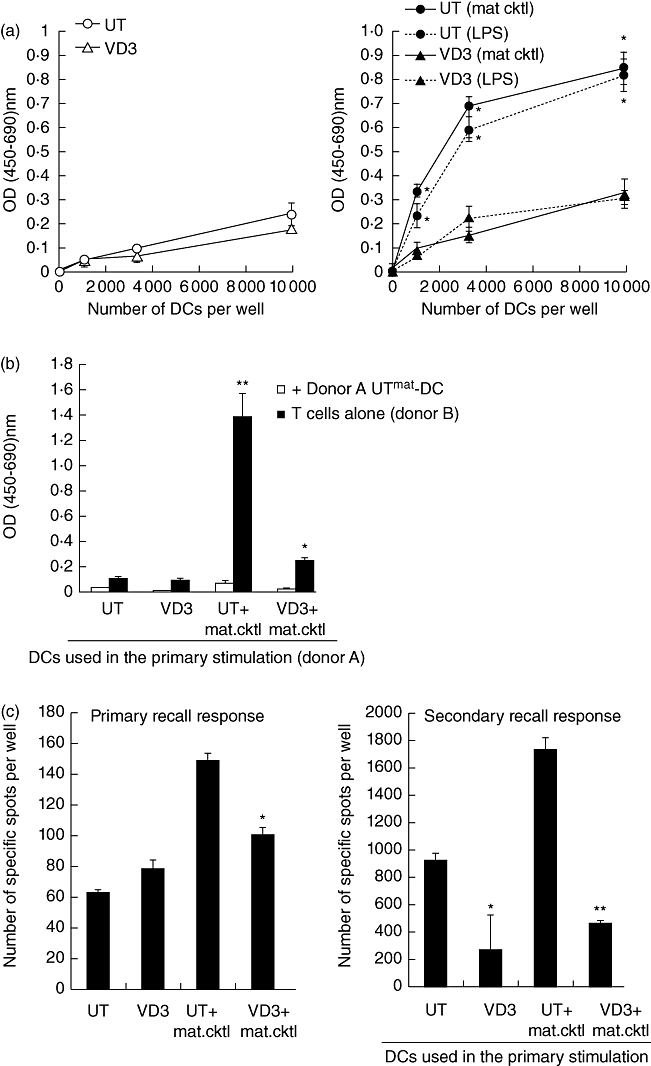
1α,25-dihydroxyvitamin D3-treated dendritic cells (VD3-DCs) are resistant to functional maturation, remain poor stimulators of T cells and render them hyporesponsive to further stimulation. (a) Primary allogeneic mixed lymphocyte reaction (MLR): DCs were generated from monocytes derived from donor A, with (triangles) or without (circle) VD3 for 6 days, and cultured for a further 24 h in the absence (left panel) or presence (right panel) of maturation reagents [maturation cocktail or lipopolysaccharide (LPS)]. Indicated number of DCs were co-cultured with CD4+ T cells (105) from donor B, and the proliferative response of CD4+ T cells were measured by quantifying bromodeoxyuridine (BrdU) uptake after 4 days of co-culture. Shown are one representative of five experiments. *P < 0·01 [untreated (UT) compared with respective VD3]. (b) Secondary allogeneic MLR: 3 days after the co-culture was set up [as described above (a)], DCs were removed and T cells were rested in culture for 7 days. T cells were then restimulated with UTmat-DCs from donor A at a ratio of 20:1. The proliferation of T cells was assessed by quantifying BrdU uptake after 3 days. *P < 0·05; **P < 0·01 (data point compared with UT). (c) Cytomegalovirus (CMV) antigen recall response (left panel): DCs (5 × 10³) generated as described in (a) were loaded with pp65 CMV peptide, and co-cultured with CD8+ (105) T cells for 18 h. The frequency of interferon (IFN)-γ-secreting cells was determined by enzyme-linked immunospot (ELISPOT). Secondary recall response (right panel): CD8+ T cells were co-cultured with CMV pp65 peptide-loaded DCs for 2 days. DCs were then removed, and T cells were rested in culture for 6 days. T cells were then recovered and plated (3 × 10⁴) together with mature UT mDC (103) (±peptide), and the frequency of IFN-γ-secreting cells was determined as above. *P < 0·05; **P < 0·01 (UT compared with respective VD3).
The VD3-DCs generate CD4+ T cells with regulatory function
Next we examined whether the T cells stimulated by VD3-DCs have acquired an ability to regulate function of other T cells. CD4+ T cells (donor D) were stimulated with allogeneic UT-DCs, UTmat-DCs, VD3-DCs or VD3mat-DCs (donor C), as in the MLR above, and the T cells were recovered after 10 days. Titrating numbers of these T cells were then added to co-culture between naive CD4+T cells (donor D) and UTmat-DCs (donor C), and secreted IFN-γ from the co-culture was measured 5 days later. As shown in Fig. 2, addition of CD4+ T cells that were stimulated initially by UT-DCs does not affect the IFN-γ secretion by naive CD4+ T cells, while addition of UTmat-DC-primed CD4+ T cells enhances the IFN-γ response further. In contrast, CD4+ T cells that were primed by either VD3-DCs or VD3mat-DCs reduce the IFN-γ response significantly. IL-10 in the cell culture supernatant was also quantified, but all contained negligible (< 5 pg/ml) levels of this cytokine (data not shown).
Fig. 2.
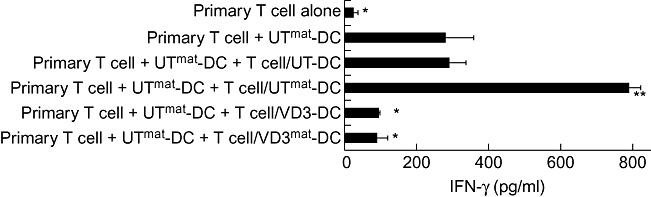
T cells stimulated by 1α,25-dihydroxyvitamin D3-treated dendritic cells (VD3-DCs) regulate proliferation of naive T cells. (a) T cell suppression assay: CD4+ T cells from donor D were stimulated with four different types of DCs (donor C; as described in Materials and methods). After 10 days these T cells (6·6 × 103) were added to co-culture between naive CD4+T cells (donor D; 2 × 10⁴) and untreated mature (UTmat)-DCs (donor C; 2 × 10³). Secreted interferon (IFN)-γ was quantified by enzyme-linked imunosorbent assay (ELISA) 5 days later. *P < 0·05; **P < 0·01 (each data point compared with ‘primary T cell + UTmat-DC’).
Taken together, these data demonstrate that VD3-DCs (with or without exposure to maturation stimuli) induce long-lasting inefficient T cell stimulation which render T cells hyporesponsive with a potentially regulatory function.
Cell surface phenotype of VD3-DCs
One of the most obvious and commonly used measures for QC of a given DC population is to analyse the cell surface receptor expression, which is used as a surrogate marker for DC functionality. To establish whether VD3-DCs can be identified by their surface receptor profile, DCs were analysed for known markers that have been shown to be expressed on DC surface (Fig. 3a). Of 13 markers examined, the expression profiles of UT-DCs and VD3-DCs were very similar, with the notable exceptions of CD1a and CD14, the expression of which were down-regulated and up-regulated in VD3-DCs respectively. Upon exposure to the maturation cocktail, VD3-DCs retained low expression of T cell co-stimulatory molecules such as CD40, CD80 and CD86 as well as HLA-D, CCR7 and CD83. Thus, VD3-DCs are resistant to maturation, and this was also true when the maturation cocktail was substituted with LPS (data not shown). Chemokine receptors such as CCR5 and CXCR3 were unaffected by VD3 or maturation stimulus, as were the inhibitory receptors, ILT3, ILT4 and programme death ligand PD-L1 molecule [26,27].
Fig. 3.
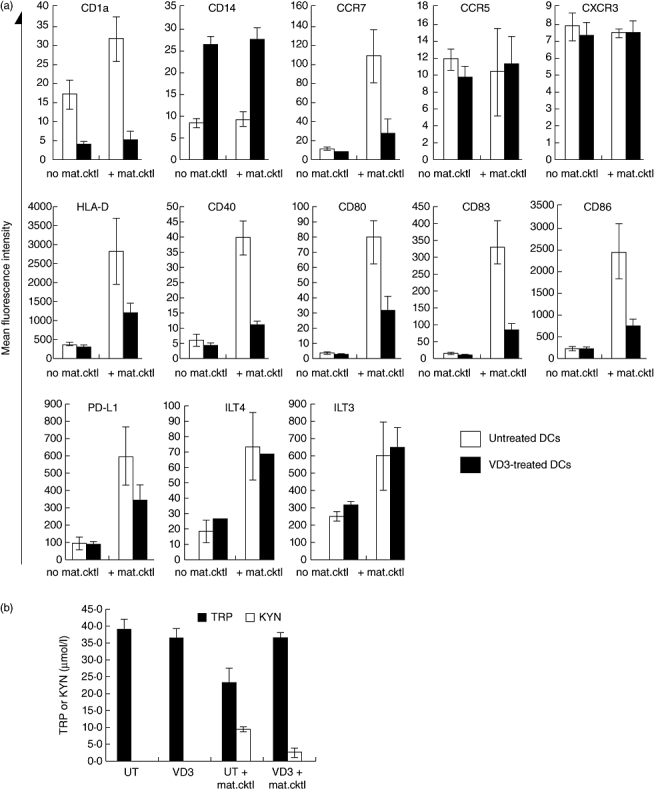
Phenotype of 1α,25-dihydroxyvitamin D3-treated dendritic cells (VD3-DCs). (a) DC surface markers: DCs were generated in the presence (filled bars) or absence (open bars) of VD3 for 6 days, and cultured for a further 24 h with or without the maturation cocktail. The cells were then collected and examined for their surface antigen expression by flow cytometry. The data shown are mean fluorescence intensity of DCs from four different donors [±standard error (s.e.)]. *P < 0·05; **P < 0·01 [untreated (UT) compared with respective VD3]. (b) Indoleamine 2,3-dioxygenase (IDO) activity in DCs: tryptophan degradation via IDO was determined by evaluating kynurenine (open bars) and tryptophan (filled bars) concentrations in supernatants of DC cultures. The values shown in the figure are means calculated from DCs derived from five different donors (±s.e.).
The IDO activity in VD3-DCs
We also examined the activity of IDO, a tryptophan-catabolizing enzyme, which has been correlated with the suppression of T cell responses in numerous studies [28–31]. In our system, however, IDO activity is induced in response to the maturation cocktail, and the highest level of activity was observed to our surprise in UTmat-DCs and, furthermore, this is down-modulated by VD3 treatment (Fig. 3b). This profile was not specific for the DC maturation cocktail, as a similar pattern of IDO activity was also seen when DC maturation was achieved by LPS (data not shown). Thus it appears that high IDO activity does not reflect the regulatory activity in VD3-DCs.
Cytokine profile of VD3-DCs
Measurement of secreted cytokines by DCs is achieved readily and can therefore be applied as a part of QC. Because the reduction in IL-12 production and elevation in IL-10 have been documented as common features of many regulatory DCs described so far, we also examined the secretion of these two cytokines by our DCs. As shown in Fig. 4a, induction of IL-12p70 by maturation cocktail in UT-DCs appears to be inhibited by VD3-treatment. However, the basal level of IL-12p70 produced by UTmat-DCs was very low (on average 19 pg/ml). Upon further culture with LPS or repeated stimulation with the maturation cocktail (data not shown for the latter), IL-12p70 production by UTmat-DCs improved, while the IL-12p70 production by VD3-DCs/VD3mat-DCs remained low. Similarly, induction of IL-10 by VD3-DCs was not observed until the DCs were restimulated with LPS for a further 48 h of culture. Furthermore, there were large donor-to-donor variations in the quantities of these cytokines secreted by DCs (Fig. 4b), which may pose a problem when utilizing either of these cytokines as a marker to distinguish regulatory DCs from immunogenic DCs. In search of a more reliable cytokine marker, we found that the secretion of IL-23, a cytokine which has been shown to contribute to a T helper type 17 (Th17) as well as a Th1 response, was induced dramatically in UT-DCs upon exposure to the maturation stimulus, but not in VD3-DCs (Fig. 4a). Importantly, unlike the donor-to-donor variations for IL-12p70 or IL-10, UTmat-DCs generated from all examined donors secrete an average 88 times higher amount of IL-23 compared with UT-DCs (Fig. 4b), whereas levels of IL-23 remained low in VD3-DCs.
Fig. 4.
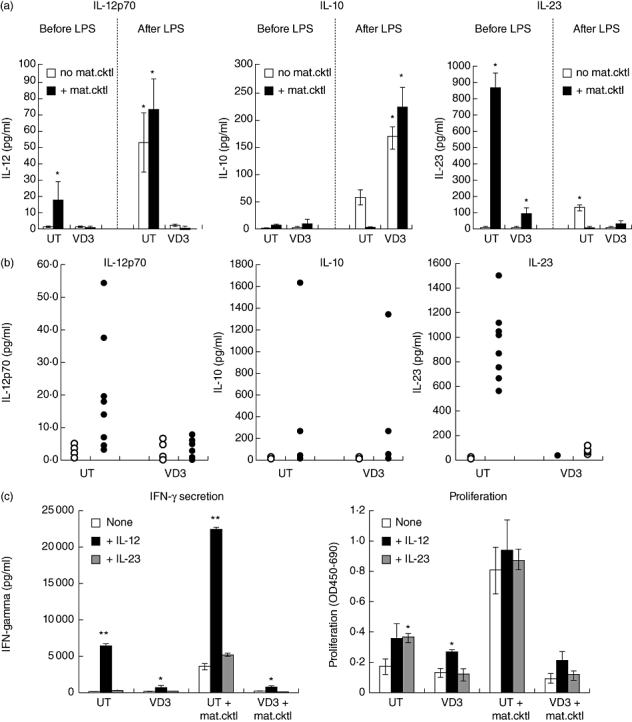
Cytokine secretion by 1α,25-dihydroxyvitamin D3-treated dendritic cells (VD3-DCs). (a) Secretion of interleukin (IL)-12p70, IL-10 and IL-23 by VD3-DCs: DCs were generated in the presence (‘VD3’) or absence [‘UT’ (untreated)] of VD3 for 6 days, and cultured for a further 24 h with (filled bars) or without (open bars) the maturation cocktail. Cell culture supernatant was collected and secreted cytokines were quantified by enzyme-linked immunosorbent assay (ELISA) [‘before LPS’ (lipopolysaccharide)]. Alternatively, DCs collected were washed and cultured for further 48 h in the presence of 100 ng/ml LPS and the cell culture supernatant was analysed by ELISA (‘after LPS’). The data shown are from one donor, representative of four different donors. *P < 0·01 (comparison between untreated and VD3-treated DCs). (b) Cytokines detected in DC culture supernatant on day 7: DCs were generated in the presence (‘VD3’) or absence (‘UT’) of VD3 for 6 days, and cultured for further 24 h with (closed symbols) or without (open symbols) the maturation cocktail. Cell culture supernatant was collected and secreted cytokines were quantified by ELISA. Each symbol represents one donor. (c) Effect of addition of exogenous IL-12 and IL-23 on VD3-DC-generated T cell responses: DCs generated as described above were co-cultured with allogeneic non-adherent cells at a ratio of 1 : 20, in the presence or absence of 1 ng/ml IL-12 or 1 ng/ml IL-23 for 5 days. Proliferation of the responder cells was quantified by measuring bromodeoxyuridine (BrdU) uptake, and secreted interferon (IFN)-γ was measured by ELISA. *P < 0·05; **P < 0·01 (comparison between untreated and IL-12/23-treated).
To assess the significance of the inhibited secretion of IL-12 or IL-23 in the regulatory function of VD3-DCs, allogeneic MLR was set up in the presence or absence of exogenous IL-12 or IL-23. As shown in Fig. 4c, exogenous IL-12, but not IL-23, partially restored both T cell proliferation and IFN-γ responses by VD3-DCs/VD3mat-DCs. Thus, while low levels of IL-23 secretion by VD3-treated DCs may not play a role in the regulatory function, this can be a robust hallmark for VD3/VD3mat-DCs.
MicroRNA profile of VD3-DCs
To investigate further the possibility of finding a biomarker that would identify VD3-DCs, we used a miRNA microarray to identify differentially expressed miRNAs. The miRNA profile of VD3mat-DCs and UTmat-DCs were each compared with the profile of UT-DCs to identify true markers of VD3-DCs. Initially, we identified six miRNAs (miR-29a, -30b, -146a, -193a-3p, -378 and -770-5p) to be induced significantly in VD3mat-DCs compared with UT-DCs (Table 1a). To test if these were induced specifically in VD3mat-DCs, the differential expression of the six miRNAs were determined from the profiling of UTmat-DCs relative to UT-DCs. Of the six miRNAs only two (miR-29a and miR-146a) were also significantly up-regulated in UTmat-DCs (Table 1b), although the miR-29a up-regulation in UTmat-DCs is considered borderline, as it did not pass the more rigid significance analysis of microarray. Hence, from the array data we concluded that miR-30b, miR-193a-3p, miR-378 and miR-770-5p were up-regulated most specifically in VD3mat-DCs. Interestingly, miR-155, which together with miR-146a were shown previously to play important roles in the immune system [32], was shown not to be up-regulated significantly in VD3mat-DCs (Table 1a) but induced highly in UTmat-DCs. To validate these initial microarray data, both Northern blotting and quantitative reverse transcription (RT)–PCR were conducted to quantitate the level of these miRNAs in UT-DCs, UTmat-DCs, VD3-DCs and VD3mat-DCs. Northern blotting revealed that miR-770-5p did not exist in a mature (22 nt) form (data not shown) and we therefore disregarded it in this context, and with real-time RT–PCR it was not possible to validate the differential expression of miR-30b and miR-193a-3p. However, as outlined in Table 2 and exemplified with one donor in Fig. 5, we were able to verify the differential expression of miR-155, miR-146a and miR-378. Interestingly, miR-155 was enhanced significantly only in UTmat-DCs and not in VD3mat-DCs, suggesting that miR-155 can be used as a marker for immunogenic DCs. On the other hand, up-regulation of miR-146a was observed in DCs treated with the maturation cocktail (UTmat-DCs or VD3mat-DCs) regardless of the DC function. Finally, miR-378, which has been detected in a number of human cancer cell lines [33] and is also involved in cell growth and survival [34], was up-regulated significantly in VD3/VD3mat-DCs. Thus absence of induction of miR-155 and up-regulation of miR-378 expression appear to be reliable markers for VD3-treated regulatory DCs.
Table 1.
Summary of microRNA (miRNA) array data. (a) Differential expression of miRNAs in 1α,25-dihydroxyvitamin D3-treated mature dendritic cells (VD3mat-DCs) over untreated (UT)-DCs. (b) Differential expression of miRNAs in UTmat-DCs over UT-DCs.
| (a) microRNA | Log2-transformed ratio value VD3mat-DCs/UT-DCs | Student's t-test Lowess normalization P-value | Student's t-test divided by mean normalization P-value | SAM |
|---|---|---|---|---|
| hsa-miR-29a | 0·51 | 0·0012 | 7·67E-04 | + |
| hsa-miR-30b | 0·51 | 0·0013 | 2·76E-04 | + |
| hsa-miR-146a | 1·30 | 0·0022 | 0·0075 | + |
| hsa-miR-155 | 0·48 | 0·0720 | 0·088 | − |
| hsa-miR-193a-3p | 1·48 | 0·0049 | 2·46E-05 | + |
| hsa-miR-378 | 0·64 | 0·0246 | 0·0213 | + |
| hsa-miR-770-5p | 1·73 | 0·0091 | 0·0041 | + |
| (b) microRNA | Log2-transformed ratio value UTmat-DCs/UT-DCs | Student's t-test Lowess normalization P-value | Student's t-test divided by mean normalization P-value | SAM |
| hsa-miR-29a | 0·79 | 0·017 | 0·042 | − |
| hsa-miR-30b | 0·08 | 0·607 | 0·930 | − |
| hsa-miR-146a | 1·54 | 0·021 | 0·021 | + |
| hsa-miR-155 | 2·42 | 0·015 | 0·001 | + |
| hsa-miR-193a-3p | 0·72 | 0·055 | 0·088 | − |
| hsa-miR-378 | –0·11 | 0·980 | 0·150 | − |
| hsa-miR-770-5p | 0·10 | 0·570 | 0·580 | − |
DCs were prepared as described in Materials and methods from three different donors. MiRNA profile of UTmat-DCs and VD3mat-DCs were each compared with UT-DCs (Table 1b and a respectively) using LNA-based microarray technology and subsequent statistical analyses. Based on this, the most prominent and statistically significant miRNAs with differential expression in VD3mat-DCs are listed with their respective log2-transformed ratio values. For each miRNA the statistical significance is shown by indicating the P-value after testing if the average ratio values were significantly different from 0, corresponding to no difference in expression between UTmat-DCs and VD3mat-DCs relative to UT-DCs respectively. Two different normalization methods were used, and the P-values obtained for both are shown. In addition, the result of a more restrictive statistical analysis for microarray analysis, known as SAM (significance analysis of microarray), is also shown, where ‘+’ indicates a significant change and ‘−’ indicates no significant change.
Table 2.
Differential expression of miR-155, -146a and 378 in 1α,25-dihydroxyvitamin D3-treated dendritic cells (VD3-DCs).
| ΔΔCt values Phenotype | hsa-miR-155 | microRNA hsa-miR-146a | hsa-miR-378 |
|---|---|---|---|
| UTmat/UT (n = 4) | 3·1 ± 1·2* | 1·77 ± 0·53** | 0·04 ± 1·06 |
| VD3/UT (n = 5) | −0·33 ± 0·55 | 0·09 ± 0·78 | 0·88 ± 0·72** |
| VD3mat/UT (n = 4) | 0·09 ± 0·64 | 1·08 ± 0·67** | 0·69 ± 0·56* |
Real-time reverse transcription–polymerase chain reaction (RT–PCR) results of three different miRNAs (hsa-miR-155, hsa-miR-146a and hsa-miR-378) expressed as ΔΔCt values that indicate the relative expression level of a given miRNA compared with the respective untreated (UT)-DC level. As calibrator in this analysis, U6 snRNA were used. Significant differential expression of miRNAs in the different DC phenotypes compared with imDC in the table is indicated by asterisks:
P < 0·05 and
P < 0·01.
Data shown are a summary of an indicated number of donors.
Fig. 5.
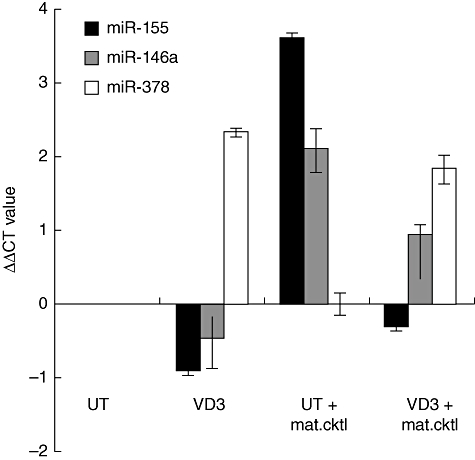
Differential expression of miR-155, -146a and 378 in 1α,25-dihydroxyvitamin D3-treated dendritic cells (VD3-DCs). Real-time reverse transcription–polymerase chain reaction (RT–PCR) results of three different miRNAs (hsa-miR-155, hsa-miR-146a and hsa-miR-378) expressed as ΔΔCt values that indicate the relative expression level of a given miRNA compared with the respective untreated (UT)-DC level. As calibrator in this analysis, U6 snRNA were used. Data shown are from one representative donor.
Discussion
An accumulation of data from numerous experimental models has contributed to our understanding of what constitutes functional immunoregulatory DCs, and how to generate them by in vitro manipulations of DCs [6,7]. However, the main concern over the use of such immunoregulatory DCs in clinical settings is the lack of specific markers that can be used to identify such DCs [8]. Given that many clinical studies conducted today use DCs generated from peripheral blood monocytes, we set out to find reliable markers that can be used to identify monocyte-derived immunoregulatory DCs. In this study we have chosen to generate such regulatory DCs by following one of the most well-studied approaches, namely, by treating DCs with 1,25-dihydroxyvitamin D3 (VD3), an active form of vitamin D.
In agreement with many published studies [11–15], we found that DCs differentiated in the presence of VD3 are poor stimulators of T cell responses and induce T cell hyporesponsiveness and differentiation of T cells with regulatory function, in spite of exposure to maturation stimuli. While these functional assays are reliable for delineating regulatory DCs they are labour-intensive, difficult to standardize and time-consuming, and therefore not suitable for use as a routine QC measure. Thus, for vaccine purposes one should rely ideally on markers that can be measured with simple and robust assays that can provide quick reproducible answers.
The VD3-DCs retain low levels of T cell co-stimulatory markers (CD40, CD80 and CD86) as well as markers that are signatures for immunogenic DCs (CCR7, HLA-D and CD83) even after stimulation with the cytokine maturation cocktail or LPS. However, these markers alone are not sufficient to identify VD3-DCs, as these are also the features of UT-DCs. In contrast, VD3-DC express relatively high or low levels of CD14 or CD1a, respectively, regardless of their exposure to the maturation stimuli, and therefore these two markers should be included in the QC analysis. VD3-treatment or stimulation of DCs with maturation stimuli did not affect significantly the expression of CCR5 and CXCR3, probably reflecting the low expression of these receptors in these DCs. In addition, we observed no increase in any of the inhibitory receptors (PD-L1, ILT3 and ILT4) in VD3-DCs. The selective up-regulation of ILT3 and/or ILT4 in VD3-DCs has been described previously [27,35–37]. The lack of ILT3/4 induction in our VD3-DCs is unclear, but may be explained by different clones of antibodies used for detection of these receptors. In addition, as the expression of ILT3 and ILT4 are known to be enhanced by the interaction with regulatory T cells [17,35,38], one might expect to see an enhanced expression of these receptors in DC–T cell co-culture. Similarly, the expression of PD-L1 by tolerogenic DCs [26,39] may also be enhanced further after interaction with activated T cells.
Based on a number of studies demonstrating a correlation between the expression of IDO in DCs and suppression of T cell response by depletion of tryptophan [28–31], we also examined the activity of IDO in VD3-DCs. Our results show that the activity of IDO is enhanced only in response to maturation stimuli, and that such a response is suppressed partially by VD3. This is consistent with studies that demonstrated highly immunogenic function of monocyte-derived DCs in vitro despite high IDO activities [40,41]. Thus we conclude that high IDO activity per se cannot define regulatory function of DCs [42].
Besides examination of surface markers, analysis of cytokines secreted by DCs can also be a useful tool to identify functionality of DCs. High production of IL-10 and the absence of IL-12 are general features of many regulatory DCs described thus far [6,7]. In the current study, however, UTmat-DCs secrete low amounts of IL-12p70 (average 19 pg/ml), with some donors' DCs secreting just above the detection limit of the ELISA assay used (5 pg/ml). Although inhibition of IL-12 secretion in VD3-DCs is evident in most donors' DCs, measurement of IL-12p70 is not a reliable QC marker. Similarly, VD3-DCs in this study secrete low levels of IL-10. Furthermore, there was a large donor-to-donor variation in the quantity of these cytokines. The low IL-12p70 production by our DCs is not surprising, given that the maturation cocktail used contains PGE2, which is known to suppress the ability of DCs to induce IL-12p70 [43]. Nevertheless, this cytokine mixture is used widely in many studies, as DCs matured in this way express high levels of CD83 and CCR7 and induce efficient T cell responses [44]. Importantly, upon further stimulation of these DCs with LPS for 48 h VD3-DCs can be distinguished readily from UT-DCs by the lack of IL-12p70 and induction of IL-10. However, in clinical settings where DC maturation is achieved by the same cytokine mixture used in this study, it may be more practical to rely on markers that are analysed readily on the day when DCs are collected. We found that IL-23, which is known to promote both Th1 and Th17 differentiation/maintenance of T cells [45,46], can differentiate UTmat from VD3mat-DCs without further stimulation. The production of IL-23 is up-regulated by various microbe products and by stimulation via CD40 ligation [47] as well as by PGE2[48]. While IL-12 is well accepted as a suitable marker for Th1-inducing immunogenic DCs, depending upon the methodology of DC culture, the level of IL-12 secretion may be affected greatly. Although it was evident from our allogeneic MLR study that IL-12 but not IL-23 was essential in stimulatory capacity of DCs, IL-23 offers an alternative surrogate marker that suffers less donor-to-donor variability. Thus, low secretion of IL-23 appears to be a reliable marker for the QC characterization of VD3-treated regulatory DCs.
In the clinical setting, where a fast QC measure is required to identify the functional phenotype of DCs, a molecular marker that can be identified by a simple PCR method would also be beneficial. For this reason, we looked for a unique miRNA expression in VD3-DCs. Both miR-155 and miR-146a in myeloid cells have been shown to increase in expression after exposure to various inflammatory stimuli [49–51]. Thus, it was not a surprise to us that these miRNAs were indeed up-regulated by UTmat-DCs. Interestingly, however, while the increase in miR-146a was evident in DCs that were exposed to the maturation stimuli (UTmat-DCs and VD3mat-DCs), up-regulation of miR-155 was restricted only to immunogenic UTmat-DC. In support of this, DCs cultured in the presence of IL-10, another well-known reagent that induces a regulatory function of DCs [52–54], also show up-regulation of miR-146a upon exposure to maturation stimuli, but not miR-155 (A. W. Pedersen, unpublished data). This is consistent with an earlier study which demonstrates that the expression of miR-155 is required for immunogenicity of myeloid DCs [55]. Thus, our data suggest that the expression of miR-155 in DCs might be used as a marker for the immunogenic phenotype of DCs, as also demonstrated by Holmstrøm et al. (manuscript in preparation). Another novel observation made in this study was the finding that miR-378, which has been detected in a number of human cancer cell lines [33] and also involved in cell growth and survival [34], was shown to be enhanced selectively by VD3 DCs in this study. Interestingly, such enhancement was not observed in IL-10-treated DCs (unpublished data). It remains to be elucidated whether this up-regulation of miR-378 is specific for the exposure to VD3. Further studies, such as targeted silencing of miR-155 and miR-378, are required to determine the role of these miRNAs in DC functions.
In summary, in this study we have established a number of markers that can be used as QC of VD3-modified regulatory DCs: (i) immature DC phenotype together with high CD14 and low CD1a expression as determined by flow cytometry; (ii) inability to induce IL-23 secretion or miR-155 expression upon exposure to maturation stimuli; and (iii) over-expression of miR-378. It is crucial that in each DC preparation one includes both untreated DC control and untreated DCs exposed to maturation stimuli to assess properly the level of these markers. Importantly, all of these markers can be measured easily by fast and conventional assays such as ELISA and RT–PCR and therefore would be ideal for QC of regulatory DC preparations in future clinical studies.
Acknowledgments
We would like to thank Professor Gerold Schuler for critical advice and helpful discussion of the manuscript, Astrid Haara for performing the IDO assay and Camilla Bilde, Lisa Nielsen, Ida Jørring, Dorte Lauritsen and Trine Devantier for technical assistance.
Disclosures
The authors have no conflict of interest.
References
- 1.Banchereau J, Steinman RM. Dendritic cells and the control of immunity. Nature. 1998;392:245–52. doi: 10.1038/32588. [DOI] [PubMed] [Google Scholar]
- 2.Inaba K, Steinman RM, Pack MW, et al. Identification of proliferating dendritic cell precursors in mouse blood. J Exp Med. 1992;175:1157–67. doi: 10.1084/jem.175.5.1157. [DOI] [PMC free article] [PubMed] [Google Scholar]
- 3.Romani N, Gruner S, Brang D, et al. Proliferating dendritic cell progenitors in human blood. J Exp Med. 1994;180:83–93. doi: 10.1084/jem.180.1.83. [DOI] [PMC free article] [PubMed] [Google Scholar]
- 4.Mukherji B, Chakraborty NG, Yamasaki S, et al. Induction of antigen-specific cytolytic T cells in situ in human melanoma by immunization with synthetic peptide-pulsed autologous antigen presenting cells. Proc Natl Acad Sci USA. 1995;92:8078–82. doi: 10.1073/pnas.92.17.8078. [DOI] [PMC free article] [PubMed] [Google Scholar]
- 5.Ridgway D. The first 1000 dendritic cell vaccinees. Cancer Invest. 2003;21:873–86. doi: 10.1081/cnv-120025091. [DOI] [PubMed] [Google Scholar]
- 6.Morelli AE, Thomson AW. Tolerogenic dendritic cells and the quest for transplant tolerance. Nat Rev Immunol. 2007;7:610–21. doi: 10.1038/nri2132. [DOI] [PubMed] [Google Scholar]
- 7.Steinman RM, Hawiger D, Nussenzweig MC. Tolerogenic dendritic cells. Annu Rev Immunol. 2003;21:685–711. doi: 10.1146/annurev.immunol.21.120601.141040. [DOI] [PubMed] [Google Scholar]
- 8.Xiao BG, Huang YM, Link H. Dendritic cell vaccine design: strategies for eliciting peripheral tolerance as therapy of autoimmune diseases. BioDrugs. 2003;17:103–11. doi: 10.2165/00063030-200317020-00003. [DOI] [PubMed] [Google Scholar]
- 9.van EE, Mathieu C. Immunoregulation by 1,25-dihydroxyvitamin D3: basic concepts. J Steroid Biochem Mol Biol. 2005;97:93–101. doi: 10.1016/j.jsbmb.2005.06.002. [DOI] [PubMed] [Google Scholar]
- 10.Hackstein H, Thomson AW. Dendritic cells: emerging pharmacological targets of immunosuppressive drugs. Nat Rev Immunol. 2004;4:24–34. doi: 10.1038/nri1256. [DOI] [PubMed] [Google Scholar]
- 11.Anderson AE, Sayers BL, Haniffa MA, et al. Differential regulation of naive and memory CD4+ T cells by alternatively activated dendritic cells. J Leukoc Biol. 2008;84:124–33. doi: 10.1189/jlb.1107744. [DOI] [PMC free article] [PubMed] [Google Scholar]
- 12.Gauzzi MC, Purificato C, Donato K, et al. Suppressive effect of 1alpha,25-dihydroxyvitamin D3 on type I IFN-mediated monocyte differentiation into dendritic cells: impairment of functional activities and chemotaxis. J Immunol. 2005;174:270–6. doi: 10.4049/jimmunol.174.1.270. [DOI] [PubMed] [Google Scholar]
- 13.Penna G, Adorini L. 1 Alpha,25-dihydroxyvitamin D3 inhibits differentiation, maturation, activation, and survival of dendritic cells leading to impaired alloreactive T cell activation. J Immunol. 2000;164:2405–11. doi: 10.4049/jimmunol.164.5.2405. [DOI] [PubMed] [Google Scholar]
- 14.Piemonti L, Monti P, Sironi M, et al. Vitamin D3 affects differentiation, maturation, and function of human monocyte-derived dendritic cells. J Immunol. 2000;164:4443–51. doi: 10.4049/jimmunol.164.9.4443. [DOI] [PubMed] [Google Scholar]
- 15.van Halteren AG, Tysma OM, van EE, Mathieu C, Roep BO. 1alpha,25-dihydroxyvitamin D3 or analogue treated dendritic cells modulate human autoreactive T cells via the selective induction of apoptosis. J Autoimmun. 2004;23:233–9. doi: 10.1016/j.jaut.2004.06.004. [DOI] [PubMed] [Google Scholar]
- 16.Griffin MD, Lutz W, Phan VA, Bachman LA, McKean DJ, Kumar R. Dendritic cell modulation by 1alpha,25 dihydroxyvitamin D3 and its analogs: a vitamin D receptor-dependent pathway that promotes a persistent state of immaturity in vitro and in vivo. Proc Natl Acad Sci USA. 2001;98:6800–5. doi: 10.1073/pnas.121172198. [DOI] [PMC free article] [PubMed] [Google Scholar]
- 17.Adorini L, Penna G, Giarratana N, Uskokovic M. Tolerogenic dendritic cells induced by vitamin D receptor ligands enhance regulatory T cells inhibiting allograft rejection and autoimmune diseases. J Cell Biochem. 2003;88:227–33. doi: 10.1002/jcb.10340. [DOI] [PubMed] [Google Scholar]
- 18.Gregori S, Casorati M, Amuchastegui S, Smiroldo S, Davalli AM, Adorini L. Regulatory T cells induced by 1 alpha,25-dihydroxyvitamin D3 and mycophenolate mofetil treatment mediate transplantation tolerance. J Immunol. 2001;167:1945–53. doi: 10.4049/jimmunol.167.4.1945. [DOI] [PubMed] [Google Scholar]
- 19.Gregori S, Giarratana N, Smiroldo S, Uskokovic M, Adorini L. A 1alpha,25-dihydroxyvitamin D(3) analog enhances regulatory T-cells and arrests autoimmune diabetes in NOD mice. Diabetes. 2002;51:1367–74. doi: 10.2337/diabetes.51.5.1367. [DOI] [PubMed] [Google Scholar]
- 20.Anderson AE, Swan DJ, Sayers BL, et al. LPS activation is required for migratory activity and antigen presentation by tolerogenic dendritic cells. J Leukoc Biol. 2009;85:243–50. doi: 10.1189/jlb.0608374. [DOI] [PMC free article] [PubMed] [Google Scholar]
- 21.Penna G, Giarratana N, Amuchastegui S, Mariani R, Daniel KC, Adorini L. Manipulating dendritic cells to induce regulatory T cells. Microbes Infect. 2005;7:1033–9. doi: 10.1016/j.micinf.2005.03.025. [DOI] [PubMed] [Google Scholar]
- 22.Figdor CG, de Vries IJ, Lesterhuis WJ, Melief CJ. Dendritic cell immunotherapy: mapping the way. Nat Med. 2004;10:475–80. doi: 10.1038/nm1039. [DOI] [PubMed] [Google Scholar]
- 23.Widner B, Werner ER, Schennach H, Wachter H, Fuchs D. Simultaneous measurement of serum tryptophan and kynurenine by HPLC. Clin Chem. 1997;43:2424–6. [PubMed] [Google Scholar]
- 24.Fuchs D, Moller AA, Reibnegger G, et al. Increased endogenous interferon-gamma and neopterin correlate with increased degradation of tryptophan in human immunodeficiency virus type 1 infection. Immunol Lett. 1991;28:207–11. doi: 10.1016/0165-2478(91)90005-u. [DOI] [PubMed] [Google Scholar]
- 25.Livak KJ, Schmittgen TD. Analysis of relative gene expression data using real-time quantitative PCR and the 2(-Delta Delta C(T)) method. Methods. 2001;25:402–8. doi: 10.1006/meth.2001.1262. [DOI] [PubMed] [Google Scholar]
- 26.Keir ME, Francisco LM, Sharpe AH. PD-1 and its ligands in T-cell immunity. Curr Opin Immunol. 2007;19:309–14. doi: 10.1016/j.coi.2007.04.012. [DOI] [PubMed] [Google Scholar]
- 27.Manavalan JS, Rossi PC, Vlad G, et al. High expression of ILT3 and ILT4 is a general feature of tolerogenic dendritic cells. Transpl Immunol. 2003;11:245–58. doi: 10.1016/S0966-3274(03)00058-3. [DOI] [PubMed] [Google Scholar]
- 28.Hwu P, Du MX, Lapointe R, Do M, Taylor MW, Young HA. Indoleamine 2,3-dioxygenase production by human dendritic cells results in the inhibition of T cell proliferation. J Immunol. 2000;164:3596–9. doi: 10.4049/jimmunol.164.7.3596. [DOI] [PubMed] [Google Scholar]
- 29.Mellor AL, Munn DH. IDO expression by dendritic cells: tolerance and tryptophan catabolism. Nat Rev Immunol. 2004;4:762–74. doi: 10.1038/nri1457. [DOI] [PubMed] [Google Scholar]
- 30.Munn DH, Sharma MD, Lee JR, et al. Potential regulatory function of human dendritic cells expressing indoleamine 2,3-dioxygenase. Science. 2002;297:1867–70. doi: 10.1126/science.1073514. [DOI] [PubMed] [Google Scholar]
- 31.Munn DH, Sharma MD, Mellor AL. Ligation of B7-1/B7-2 by human CD4+ T cells triggers indoleamine 2,3-dioxygenase activity in dendritic cells. J Immunol. 2004;172:4100–10. doi: 10.4049/jimmunol.172.7.4100. [DOI] [PubMed] [Google Scholar]
- 32.Baltimore D, Boldin MP, O'Connell RM, Rao DS, Taganov KD. MicroRNAs: new regulators of immune cell development and function. Nat Immunol. 2008;9:839–45. doi: 10.1038/ni.f.209. [DOI] [PubMed] [Google Scholar]
- 33.Jiang J, Lee EJ, Gusev Y, Schmittgen TD. Real-time expression profiling of microRNA precursors in human cancer cell lines. Nucleic Acids Res. 2005;33:5394–403. doi: 10.1093/nar/gki863. [DOI] [PMC free article] [PubMed] [Google Scholar]
- 34.Lee DY, Deng Z, Wang CH, Yang BB. MicroRNA-378 promotes cell survival, tumor growth, and angiogenesis by targeting SuFu and Fus-1 expression. Proc Natl Acad Sci USA. 2007;104:20350–5. doi: 10.1073/pnas.0706901104. [DOI] [PMC free article] [PubMed] [Google Scholar]
- 35.Chang CC, Ciubotariu R, Manavalan JS, et al. Tolerization of dendritic cells by T(S) cells: the crucial role of inhibitory receptors ILT3 and ILT4. Nat Immunol. 2002;3:237–43. doi: 10.1038/ni760. [DOI] [PubMed] [Google Scholar]
- 36.Penna G, Roncari A, Amuchastegui S, et al. Expression of the inhibitory receptor ILT3 on dendritic cells is dispensable for induction of CD4+Foxp3+ regulatory T cells by 1,25-dihydroxyvitamin D3. Blood. 2005;106:3490–7. doi: 10.1182/blood-2005-05-2044. [DOI] [PubMed] [Google Scholar]
- 37.Penna G, Amuchastegui S, Giarratana N, et al. 1,25-Dihydroxyvitamin D3 selectively modulates tolerogenic properties in myeloid but not plasmacytoid dendritic cells. J Immunol. 2007;178:145–53. doi: 10.4049/jimmunol.178.1.145. [DOI] [PubMed] [Google Scholar]
- 38.Suciu-Foca N, Manavalan JS, Cortesini R. Generation and function of antigen-specific suppressor and regulatory T cells. Transpl Immunol. 2003;11:235–44. doi: 10.1016/S0966-3274(03)00052-2. [DOI] [PubMed] [Google Scholar]
- 39.Probst HC, McCoy K, Okazaki T, Honjo T, van den BM. Resting dendritic cells induce peripheral CD8+ T cell tolerance through PD-1 and CTLA-4. Nat Immunol. 2005;6:280–6. doi: 10.1038/ni1165. [DOI] [PubMed] [Google Scholar]
- 40.Krause P, Singer E, Darley PI, Klebensberger J, Groettrup M, Legler DF. Prostaglandin E2 is a key factor for monocyte-derived dendritic cell maturation: enhanced T cell stimulatory capacity despite IDO. J Leukoc Biol. 2007;82:1106–14. doi: 10.1189/jlb.0905519. [DOI] [PubMed] [Google Scholar]
- 41.Terness P, Chuang JJ, Bauer T, Jiga L, Opelz G. Regulation of human auto- and alloreactive T cells by indoleamine 2,3-dioxygenase (IDO)-producing dendritic cells: too much ado about IDO? Blood. 2005;105:2480–6. doi: 10.1182/blood-2004-06-2103. [DOI] [PubMed] [Google Scholar]
- 42.Terness P, Chuang JJ, Opelz G. The immunoregulatory role of IDO-producing human dendritic cells revisited. Trends Immunol. 2006;27:68–73. doi: 10.1016/j.it.2005.12.006. [DOI] [PubMed] [Google Scholar]
- 43.van der Pouw Kraan TC, Boeije LC, Smeenk RJ, Wijdenes J, Aarden LA. Prostaglandin-E2 is a potent inhibitor of human interleukin 12 production. J Exp Med. 1995;181:775–9. doi: 10.1084/jem.181.2.775. [DOI] [PMC free article] [PubMed] [Google Scholar]
- 44.Jonuleit H, Kuhn U, Muller G, et al. Pro-inflammatory cytokines and prostaglandins induce maturation of potent immunostimulatory dendritic cells under fetal calf serum-free conditions. Eur J Immunol. 1997;27:3135–42. doi: 10.1002/eji.1830271209. [DOI] [PubMed] [Google Scholar]
- 45.Hunter CA. New IL-12-family members: IL-23 and IL-27, cytokines with divergent functions. Nat Rev Immunol. 2005;5:521–31. doi: 10.1038/nri1648. [DOI] [PubMed] [Google Scholar]
- 46.Langrish CL, McKenzie BS, Wilson NJ, de Waal MR, Kastelein RA, Cua DJ. IL-12 and IL-23: master regulators of innate and adaptive immunity. Immunol Rev. 2004;202:96–105. doi: 10.1111/j.0105-2896.2004.00214.x. [DOI] [PubMed] [Google Scholar]
- 47.McKenzie BS, Kastelein RA, Cua DJ. Understanding the IL-23–IL-17 immune pathway. Trends Immunol. 2006;27:17–23. doi: 10.1016/j.it.2005.10.003. [DOI] [PubMed] [Google Scholar]
- 48.Sheibanie AF, Tadmori I, Jing H, Vassiliou E, Ganea D. Prostaglandin E2 induces IL-23 production in bone marrow-derived dendritic cells. FASEB J. 2004;18:1318–20. doi: 10.1096/fj.03-1367fje. [DOI] [PubMed] [Google Scholar]
- 49.Brown BD, Gentner B, Cantore A, et al. Endogenous microRNA can be broadly exploited to regulate transgene expression according to tissue, lineage and differentiation state. Nat Biotechnol. 2007;25:1457–67. doi: 10.1038/nbt1372. [DOI] [PubMed] [Google Scholar]
- 50.O'Connell RM, Taganov KD, Boldin MP, Cheng G, Baltimore D. MicroRNA-155 is induced during the macrophage inflammatory response. Proc Natl Acad Sci USA. 2007;104:1604–9. doi: 10.1073/pnas.0610731104. [DOI] [PMC free article] [PubMed] [Google Scholar]
- 51.Taganov KD, Boldin MP, Chang KJ, Baltimore D. NF-kappaB-dependent induction of microRNA miR-146, an inhibitor targeted to signaling proteins of innate immune responses. Proc Natl Acad Sci USA. 2006;103:12481–6. doi: 10.1073/pnas.0605298103. [DOI] [PMC free article] [PubMed] [Google Scholar]
- 52.Sato K, Yamashita N, Matsuyama T. Human peripheral blood monocyte-derived interleukin-10-induced semi-mature dendritic cells induce anergic CD4(+) and CD8(+) T cells via presentation of the internalized soluble antigen and cross-presentation of the phagocytosed necrotic cellular fragments. Cell Immunol. 2002;215:186–94. doi: 10.1016/s0008-8749(02)00021-7. [DOI] [PubMed] [Google Scholar]
- 53.Steinbrink K, Wolfl M, Jonuleit H, Knop J, Enk AH. Induction of tolerance by IL-10-treated dendritic cells. J Immunol. 1997;159:4772–80. [PubMed] [Google Scholar]
- 54.Steinbrink K, Graulich E, Kubsch S, Knop J, Enk AH. CD4(+) and CD8(+) anergic T cells induced by interleukin-10-treated human dendritic cells display antigen-specific suppressor activity. Blood. 2002;99:2468–76. doi: 10.1182/blood.v99.7.2468. [DOI] [PubMed] [Google Scholar]
- 55.Rodriguez A, Vigorito E, Clare S, et al. Requirement of bic/microRNA-155 for normal immune function. Science. 2007;316:608–11. doi: 10.1126/science.1139253. [DOI] [PMC free article] [PubMed] [Google Scholar]