Abstract
An important prerequisite for development of insulitis and β-cell destruction in type 1 diabetes is successful transmigration of autoreactive T cells across the islet endothelium. Previous work suggests that antigen presentation to T cells by endothelium, which requires endothelial cell expression of major histocompatibility complex (MHC) molecules, promotes tissue-specific T cell migration. We therefore tested the hypothesis that the level of endothelial MHC class I molecule expression in diabetes-prone mice directly influences autoreactive CD8 T cell migration. We investigated the immune phenotype of endothelial cells, focusing on endothelial MHC class I molecule expression in a range of different tissues and mouse strains, including non-obese diabetic (NOD) mice. In addition, we examined whether the level of expression of MHC class I molecules influences autoantigen-driven CD8 T cell transmigration. Using endothelial cell lines that expressed ‘high’ (NOD mouse), medium (NOD × C3H/HeJ F1 generation mice) and no (C3H/HeJ) H-2Kd, we demonstrated in vitro that MHC levels have a profound effect on the activation, adhesion and transmigration of pathogenic, islet autoreactive CD8 T cells. The expression level of MHC class I molecules on endothelial tissues has a direct impact upon the efficiency of migration of autoreactive T cells. The immune phenotype of microvascular endothelium in NOD mice may be an additional contributory factor in disease predisposition or development, and similar phenotypes should be sought in human type 1 diabetes.
Keywords: endothelial cells, CD8 T cells, migration, NOD mouse, trafficking
Introduction
Transendothelial migration and recruitment of autoreactive T cells into the pancreatic islets is a critical event during the development of chronic insulitis in type 1 diabetes. The T cell/endothelial cell (EC) interactions that precede the successful entry of activated T cells into the islets are not known precisely and continue to be unravelled. In addition to conventional adhesion molecule and chemokine receptor/ligand interactions [1], it has been proposed that cognate antigen presentation by ECs to T cells through peptide–major histocompatibility complex (MHC) : T cell receptor (TCR) interaction is an important determinant for the development of chronic inflammation and autoimmunity [2–6]. It follows from this proposal that the density of MHC molecule or adhesion molecule expression by ECs could impact upon the tendency for autoreactive T cells to transmigrate. Indeed, increased expression of MHC class I molecules, and induction of MHC class II molecules on the islet microvasculature, is a recognized but unexplained feature of the insulitic lesion in human type 1 diabetes [7–9].
The non-obese diabetic (NOD) mouse is a useful model with which to investigate this hypothesis, as it is characterized by multi-organ infiltration by autoreactive T cells [10]. In order to establish whether NOD mouse ECs are endowed with an immune phenotype that may enable them to interact with autoreactive T cells, we carried out a comprehensive analysis of EC phenotype in different tissues. These comparative analyses revealed tissue-specific differences in the expression of adhesion molecules as well as MHC class I molecules. Our study also demonstrates the importance of EC-associated MHC class I molecules expression for the presentation of antigen to CD8 T cells and their subsequent adhesion and migration.
Research design and methods
Isolation, culture and phenotypic analysis of murine EC
Murine ECs were purified from heart, lung, aorta and thymus of female NOD mice from our own colony [11–14] of C3H/HeJ and BALB/c mice (purchased from the Jackson Laboratory, Kent, UK) aged 4–6 weeks as described [6], with in-house modifications. F1 generation NOD × C3H/HeJ mice were derived in-house and studies carried out with the approval of the Institute's Ethical Review Board according to UK Home Office guidelines. EC purity was confirmed by surface expression of EC markers CD105, CD31 (Serotec, Oxford, UK) and isolectin B4 (Vector Laboratories, Peterborough, UK), as determined by flow cytometry (typically 95–100% for all). For all experiments confluent monolayers of ECs were used at passages 4–5.
Unstimulated, resting ECs were also analysed for expression of CD62E (Serotec), intercellular adhesion molecule-1 (ICAM-1) (BD Pharmingen, Oxford, UK), inducible co-stimulator ligand (ICOS-L) (EBioscience, Wembley, UK), programmed death ligand-1 (PDL-1) (EBioscience), I-A (NOD mouse MHC class II) (BD Pharmingen), H2-Kd (NOD and BALB/c mouse) (Serotec and BD Pharmingen) and H2-Kk (C3H/HeJ mouse) (Serotec).
Functional interaction between ECs and pathogenic CD8 T cells
Splenocytes from 8·3 TCR–transgenic (Tg) NOD mice were a kind gift from Dr Pere Santamaria (Faculty of Medicine, University of Calgary) [15]. These splenocytes are enriched for CD8 T cells specific for islet glucose-6-phosphatase catalytic subunit-related protein (IGRP) IGRP206–214, a dominant cytotoxic T cell epitope in NOD mice recognized in the context of H2-Kd. Naive splenocytes were expanded with 2 µmol/l of the IGRP206–214 mimotope peptide (KYNKANVFL; Thermo Electron GmbH, Ulm, Germany) and on day 3 recombinant murine interleukin-2 (R&D, Abingdon, UK) was added (3 ng/ml). Expanded CD8 T cells were used in functional assays when proliferation ceased (typically day 8) and were ∼100% CD8+ by flow cytometry.
To examine the interaction between 8·3 TCR–Tg CD8 T cells and ECs, peptide-expanded splenocytes were labelled with 2 µmol/l carboxyfluorescein diacetate succinimidyl ester (CFSE) (Molecular Probes, Leiden, the Netherlands). Confluent NOD and NOD × C3H/HeJ F1 mouse ECs in 96-well flat-bottomed plates were pulsed with 2 µmol/l KYNKANVFL or control peptide (insulin B9-17), selected as being derived from an islet autoantigen and having equivalent predicted binding to H2-Kd as KYNKANVFL, both score 23 using the SYFPEITHI algorithm [16] for 2 h at 37°C. ECs were washed and CFSE-labelled splenocytes added (2 × 10⁵ cells/well) and co-cultured for 2–4 days, after which cells were harvested, washed and analysed for CFSE dilution by flow cytometry.
To examine the ability of ECs to support 8·3 TCR–Tg CD8 T cell adhesion NOD and NOD × C3H/HeJ F1 mouse ECs were grown to confluence on 96-well flat-bottomed plates, pulsed with 2 µmol/l KYNKANVFL or control peptide for 2 h at 37°C, washed and 8·3 TCR–Tg CD8 T cells (3 × 10⁵ cells/well) seeded on top. After 30 min at 37°C, non-adherent cells were removed by washing each well thrice with warm medium and counted in triplicate by two independent observers. The percentage of cells bound was calculated as number of non-adherent cells/total number of input cells × 100%.
T cell migration assays were carried out using transwells as described [2] with confluent, peptide-pulsed NOD and NOD × C3H/HeJ F1 mouse ECs (3 × 10⁴/well); 8·3 TCR–Tg CD8 T cells (3 × 10⁵ cells/well) were seeded on top of ECs and allowed to migrate over 2 h. Migrated cells were collected from the lower chamber and counted at 15, 30, 60, 90 and 120 min, in triplicate, by two independent observers. Migrated cells were calculated as: (number of migrated cells/total number of input cells) × 100%.
Statistical analysis
Intergroup comparisons of T cell adhesion and migration across ECs under different experimental conditions were made using Student's t-tests; P-values < 0·05 were considered statistically significant. Statistical analyses were performed using GraphPad Prism 4 software.
Results
Tissue-specific EC heterogeneity in the expression of adhesion and co-stimulatory molecules
Aortic, heart, lung and thymic ECs from NOD mice were compared for the expression of E-selectin, ICAM-1, ICOS-L and PDL-1. As shown in Fig. 1, there is tissue-specific heterogeneity in the basal expression of both adhesion and co-stimulatory molecules. The expression level of E-selectin on thymic ECs was significantly higher (**P < 0·001) than levels expressed on aortic, heart and lung ECs. Similarly, there were significant differences in ICAM-1 expression among all tissues examined. ICOS-L did not differ significantly while PDL-1 levels on thymic ECs were significantly higher than PDL-1 expressed on aortic, heart and lung ECs (**P < 0·001).
Fig. 1.
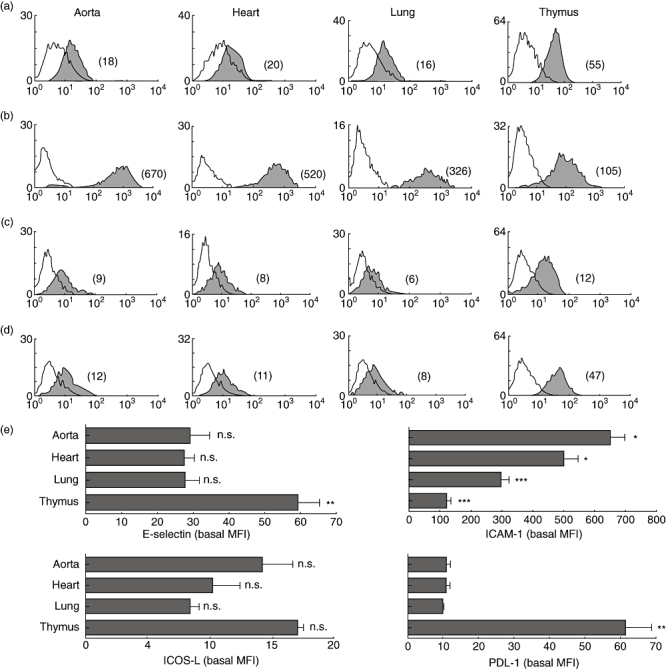
Tissue-specific expression of adhesion and co-stimulatory molecules. Figure shows comparative flow cytometric analyses of E-selectin (a), intercellular adhesion molecule-1 (ICAM-1) (b), inducible co-stimulator ligand (ICOS-L) (c) and programmed death ligand-1 (PDL-1) (d) on aortic, heart, lung and thymic endothelial cells (ECs) derived from non-obese diabetic (NOD) mouse. The mean fluorescence intensity (MFI) of each peak is shown in parentheses. Empty histograms represent isotype control staining. Study data are representative of at least three separate flow cytometric analyses carried out on ECs from at least five independent sets of experiments (where one set of experiments is the characterization of ECs isolated from three mice). Cumulative data from these independent experiments are represented in (e), and show significantly higher values for E-selectin and PDL-1 on thymic EC (**P < 0·001); ICAM-1 levels were significantly heterogeneous among the tissues examined. Bars represent means of MFIs; error bars represent standard error of the mean (s.e.m.).
Tissue-specific EC heterogeneity in the expression of MHC molecules
Aortic, heart, lung and thymic ECs from NOD mouse were compared for the expression of MHC class II (I-A) and MHC class I (H2-Kd) (Fig. 2a and b). NOD mouse ECs did not express MHC class II basally, regardless of tissue of origin. MHC class I, on the other hand, was expressed on ECs from all the tissues analysed with tissue-specific differences in the level of expression. Heart and thymic ECs differed significantly from aortic and lung ECs in the expression of H2-Kd (***P < 0·0001).
Fig. 2.
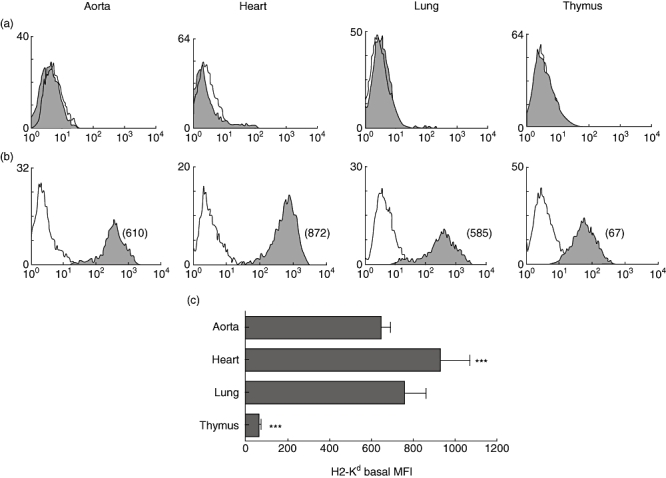
Tissue-specific expression of major histocompatibility complex (MHC) molecules. Figure shows comparative flow cytometric analyses of MHC class II (a) and MHC class I (b) molecules on aortic, heart, lung and thymic endothelial cells (ECs) derived from non-obese diabetic (NOD) mouse. The mean fluorescence intensity (MFI) of each peak is shown in parentheses. Empty histograms represent isotype control staining. Study data are representative of at least three separate flow cytometric analyses carried out on ECs from at least five independent sets of experiments (where one set of experiments is the characterization of ECs isolated from three mice). Cumulative data from these independent experiments are represented in (c), and show significant heterogeneity in MHC class I expression (***P < 0·0001) among the tissues examined. Bars represent means of MFIs; error bars represent standard error of the mean (s.e.m.).
Strain-specific EC heterogeneity in the expression of MHC class I molecules
Aortic, heart and lung ECs from NOD (H2-Kd) and BALB/c (H2-Kd) mouse strains were compared for the expression of MHC class I molecules. As shown in Figs 2 and 3, NOD mouse ECs, with the exception of thymic ECs (for thymic ECs see Fig. 2b), expressed consistently high levels of H2-Kd (Fig. 3a). For comparison, we isolated ECs from BALB/c mice, a strain expressing the same H2-Kd allotype as the NOD mouse, in order to examine whether the high basal expression of H2-K molecules on NOD mouse ECs is haplotype-related. Interestingly, BALB/c mouse ECs expressed lower levels of H2-K compared with ECs from the NOD mouse ECs (Fig. 3b). In summary, levels of H-2K molecule expression on ECs from aorta, heart and lung were significantly higher in NOD mice than in the BALB/c mouse strain (***P < 0·0001).
Fig. 3.
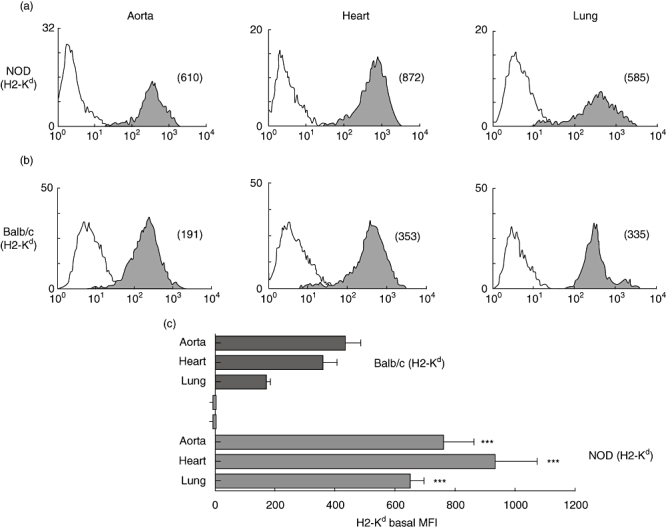
Tissue- and strain-specific expression of major histocompatibility complex (MHC) class I. Figure shows comparative flow cytometric analyses of MHC class I expression (shaded histogram) on aortic, heart and lung endothelial cells (ECs) derived from non-obese diabetic (NOD) (H2-Kd) (a) and BALB/c mouse strains (b). The mean fluorescence intensity (MFI) of each peak is shown in parentheses. Empty histograms represent isotype control staining. Study data are representative of at least three separate flow cytometric analyses carried out on ECs from at least five independent sets of experiments (where one set of experiments is the characterization of ECs isolated from three mice). Cumulative data from these independent experiments are represented in (c), and show significantly higher values for H2-Kd expression by NOD mouse aortic, heart and lung ECs compared with BALB/c mouse aortic, heart and lung ECs (***P < 0·0001). Bars represent means of MFIs; error bars represent standard error of the mean (s.e.m.).
Functional consequence of MHC class I molecule expression on ECs
In order to study the functional consequence of basal expression of MHC class I on NOD mouse ECs in relation to autoreactive T cells, we generated ECs from NOD × C3H/HeJ F1 mice that expressed levels of H2-Kd mid-way between the NOD and C3H/HeJ (which is H2-Kd-negative; Fig. 4a). For functional assays we chose heart ECs as they did not differ significantly in the basal expression of adhesion molecules such as E-selectin and ICAM-1, as shown in Fig. 4b and c.
Fig. 4.
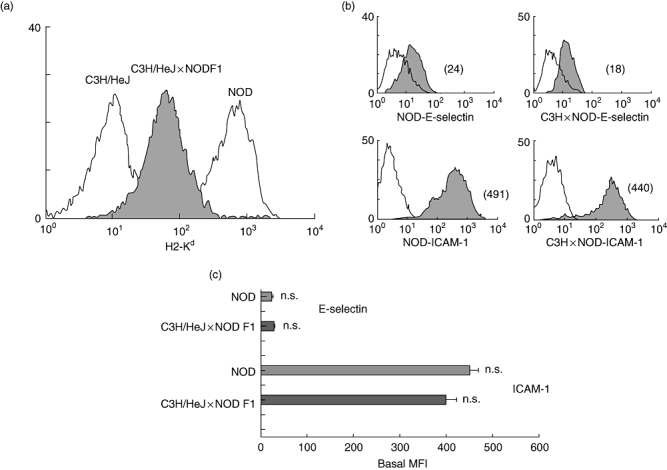
Basal expression of major histocompatibility complex (MHC) class I on non-obese diabetic (NOD) × C3H F1 mouse endothelial cells (ECs). Figure shows H2-Kd expression on heart ECs derived from NOD × C3H/HeJ F1 (cross) mice (shaded histogram) (a). Empty histogram on the right shows H2-Kd expression on heart ECs derived from the NOD mouse. Empty histogram on the left shows H2-Kk expression on heart ECs derived from C3H/HeJ mouse. (b) Comparative flow cytometric analyses of E-selectin and intercellular adhesion molecule-1 (ICAM-1) expression on heart ECs derived from NOD and C3H/HeJ × NOD F1 mouse. The mean fluorescence intensity (MFI) of each peak is shown in parentheses. Empty histograms represent isotype control staining. Study data are representative of at least three separate flow cytometric analyses carried out on ECs from at least three independent sets of experiments (where one set of experiments is the characterization of ECs isolated from three mice). Cumulative data from these independent experiments are represented in (c), and show no significant difference in the expression of E-selectin and ICAM-1 on NOD heart ECs compared with C3H/HeJ × NOD F1 heart ECs. Bars represent means of MFIs; error bars represent standard error of the mean (s.e.m.).
Heart ECs expressing higher (NOD), moderate (NOD × C3H/HeJ F1) and minimal (C3H/HeJ) basal levels of MHC class I molecules were used in order to examine their relative ability to support the proliferation, adhesion and transmigration of 8·3 TCR–Tg CD8 T cells. These T cells proliferated earlier and to a greater extent when co-cultured with resting KYNKANVFL-pulsed NOD mouse ECs compared with similarly treated NOD × C3H/HeJ F1 mouse ECs (Fig. 5). Similarly, a significantly greater number of 8·3 TCR–Tg CD8 T cells adhered to and migrated across resting KYNKANVFL-pulsed NOD mouse ECs compared with NOD × C3H/HeJ F1 mouse ECs (P < 0·001; Fig. 6a and b). These differences are unlikely to be due to differential expression of other adhesion molecules, as heart ECs derived from NOD and NOD × C3H/HeJ F1 mice expressed comparable levels of ICAM-1 and E-selectin (Fig. 4b and c).
Fig. 5.
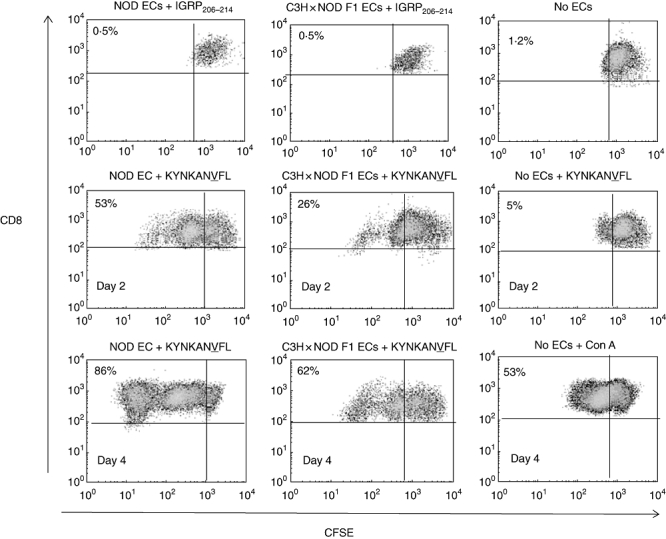
Analysis of the ability of non-obese diabetic (NOD) and NOD × C3H/HeJ F1 endothelial cells (ECs) to support the proliferation of 8·3 T cell receptor–transgenic (TCR–Tg) CD8 T cells. Figure shows a differential ability of NOD and NOD × C3H F1 (cross) mouse ECs to support the proliferation of carboxyfluorescein diacetate succinimidyl ester (CFSE)-labelled 8·3 TCR–Tg CD8 T cells as measured by a reduction in CFSE staining intensity by flow cytometry. Proliferation of 8·3 TCR–Tg CD8 T cells was examined at days 2 and 4 following co-culture with KYNKANVFL peptide-pulsed ECs. Percentage figures in dot-plots refer to the percentage of CD8 T cells that proliferated in response to KYNKANVFL. Gate was set on CFSE-labelled 8·3 TCR–Tg CD8 T cells cultured in the presence of control peptide to include < 0·5% proliferating cells. Study data are representative of two separate experiments.
Fig. 6.
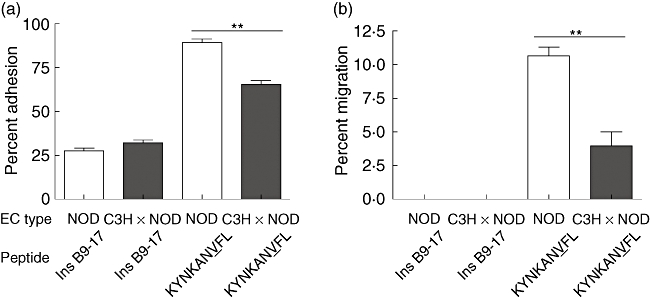
Antigen-specific adhesion and transmigration of 8·3 T cell receptor–transgenic (TCR–Tg) CD8 T cells across non-obese diabetic (NOD) and NOD × C3H/HeJ F1 mouse endothelial cells (ECs). Figure shows the percentage of 8·3 TCR–Tg CD8 T cells that adhered to (a) and transmigrated across KYNKANVFL peptide- or control peptide Ins B9-17-pulsed NOD and NOD × C3H/HeJ F1 (cross) ECs (b). Bars represent the mean percentage of adhered and migrated cells measured in triplicate wells and error bars the standard error of the mean (s.e.m.). Significantly greater percentage of 8·3 TCR–Tg CD8 T cells adhered to NOD mouse ECs compared with NOD × C3H/HeJ F1 mouse ECs (P < 0·001). Similarly, a significantly greater percentage of 8·3 TCR–Tg CD8 T cells migrated across NOD mouse ECs compared with NOD × C3H/HeJ F1 mouse ECs (P < 0·005). Study data are representative of two separate experiments.
Discussion
In this study, we demonstrate that the level of MHC class I on NOD mouse ECs influences the magnitude and efficiency of CD8 T cell proliferation, adhesion and transmigration.
Because ECs were isolated from NOD mice at ages 4–6 weeks, when organ inflammation is minimal or absent, it is unlikely that the higher MHC class I expression observed was due to the in vivo action of proinflammatory mediators. Moreover, establishment of EC lines from older mice, up to 16 weeks of age, gave similar levels of MHC expression (data not shown) and high MHC class I expression was retained in vitro for several passages (up to six), which suggests a stable phenotype.
Our findings have direct relevance to the pathogenesis of autoimmune diabetes in the NOD mouse. We used CD8 T cells with known islet-killing potential (from the 8·3 TCR–Tg mouse) to examine the functional consequence of high resting NOD mouse MHC class I expression. Resting NOD ECs were superior at presentation of cognate peptide as evidenced by the proliferative, adhesive and migratory responses of the responding CD8 T cells, compared with ECs expressing fewer MHC class I but comparable levels of conventional adhesion and co-stimulatory molecules. These findings support the hypothesis that the functional significance of peptide–MHC presentation by ECs is to allow and facilitate selective recruitment into tissue of T cells with relevant antigen specificities [3,5,6]. Nevertheless, the EC-associated peptide–MHC-driven T cell migration that we describe in this paper represents one of a number of mechanisms known to operate in vivo. For instance, the multi-step process of T cell recruitment into sites of inflammation in vivo requires the involvement of adhesion molecules and chemokines. Increased expression of adhesion molecules and chemokines produced by the vascular endothelium plays a crucial role in the target-specific homing of inflammatory cells, with each chemokine attracting and activating specific leucocyte subclasses. Thus, activation of human microvascular ECs by proinflammatory stimuli induces the expression of CXCR3 ligands such as CXCL9, CXCL10 and CXCL11 [17], which greatly facilitate the extravasation into inflamed tissues of activated CXCR3-expressing T cells. This process is facilitated by EC-associated and secreted chemoattractants including monocyte chemotactic proteins (CCL7, CCL8, CCL13), regulated on activation normal T cell expressed and secreted (CCL5), fractalkine (CX3CL1) and macrophage inflammatory proteins (CCL3, CCL4) [18]. Investigating the functional consequence of EC heterogeneity in the expression of adhesion molecules and chemokines should be the focus of future studies.
Our findings are in concert with those of Savinov et al.[3], who demonstrated that in the NOD mouse islet-specific homing of insulin-specific CD8 T cells is dependent in part upon recognition of cognate MHC–peptide complexes presented by islet ECs, which are presumed to acquire insulin from adjacent beta cells. Cross-presentation of insulin by islet ECs was essential for islet infiltration and diabetes development and islet-specific homing was abrogated in mice that lack MHC class I expression on ECs or have impaired insulin secretion [3]. It is interesting to note that Savinov et al. used H2-Kd restricted insulin-specific CD8 T cells to transfer diabetes into NOD.Rag1-KO and BALB/c mouse strains, both of which express H2-Kd and are free of pre-existent inflammation that could induce expression of adhesion molecules and chemokines on ECs. Having transferred diabetes into these strains successfully the authors reasoned that homing of the insulin-specific CD8 T cells does not require pre-existing inflammation. However, it is possible that high basal expression of H2-Kd on islet ECs in both the NOD and BALB/c mouse strains, as we have observed, facilitated diabetes transfer in this study. Because of the technical challenge of working with very small amounts of tissue, we did not characterize NOD mouse ECs from pancreatic islets, but considering that most of the NOD microvascular ECs analysed exhibited MHC class I hyperexpression compared with other mouse strains, it is very likely that islet ECs would share such a phenotype. Nevertheless, this issue needs to be addressed in future studies.
The MHC class I transcription is under the control of regulatory promoter elements, including the region I enhancer (A) element which regulates constitutive MHC class I transcription and interferon-stimulated response element (ISRE) responsible for cytokine inducible MHC class I transcription [19]. A great variety of cells express nuclear factors that bind the region I enhancer (A) sequence of the MHC class I promoter such as nuclear factor-κB and interferon regulatory factor which binds ISRE, and thus activate MHC class I transcription. Nucleotide sequence variation in the enhancer A and the ISRE as well as differences in the expression level of the above nuclear factors in different cell types may account for cell-type and MHC class I loci-specific basal and inducible levels of MHC class I expression.
Pancreatic islet endothelial MHC class I hyperexpression has been observed in humans with type 1 diabetes [7–9], NOD mice [20] and the bio-breeding rat model of autoimmune diabetes [21], although its precise role or disease relevance is not known. We and others have argued that MHC class I hyperexpression and induced endothelial expression of MHC class II molecules at inflamed sites, such as the islets in type 1 diabetes, is a mechanism through which tissue-specific migration of T cells is refined and promoted [2]. Evidence to support this has been derived from in vitro studies, in which ECs demonstrate the ability to internalize, process and present islet autoantigens such as glutamic acid decarboxylase to responder CD4+ T cells, and in so doing enhance their transmigration [2]. The work of Savinov and co-workers implies autoantigen presentation by ECs in vivo, and the present study adds further weight to this aspect of EC biology by linking an EC phenotype of MHC class I hyperexpression with an animal model of multi-organ pathology. Future studies should examine the expression of H2-Kd on NOD islet ECs in vivo and its relevance to T1D. High basal expression of H2-Kd on islet ECs may work in concert with other well-established factors that predispose the NOD mouse to diabetes and other autoimmune conditions.
Acknowledgments
This research was funded by the Juvenile Diabetes Research Foundation (postdoctoral fellowship to B. Lozanoska-Ochser). We are grateful to Dr Pere Santamaria for providing NRPV7-specific CD8 T cells.
Disclosure
None.
References
- 1.Butcher EC, Picker LJ. Lymphocyte homing and homeostasis. Science. 1996;272:60–6. doi: 10.1126/science.272.5258.60. [DOI] [PubMed] [Google Scholar]
- 2.Greening JE, Tree TI, Kotowicz KT, et al. Processing and presentation of the islet autoantigen GAD by vascular endothelial cells promotes transmigration of autoreactive T-cells. Diabetes. 2003;52:717–25. doi: 10.2337/diabetes.52.3.717. [DOI] [PubMed] [Google Scholar]
- 3.Savinov AY, Wong FS, Stonebraker AC, Chervonsky AV. Presentation of antigen by endothelial cells and chemoattraction are required for homing of insulin-specific CD8+ T cells. J Exp Med. 2003;197:643–56. doi: 10.1084/jem.20021378. [DOI] [PMC free article] [PubMed] [Google Scholar]
- 4.Pober JS. Immunobiology of human vascular endothelium. Immunol Res. 1999;19:225–32. doi: 10.1007/BF02786490. [DOI] [PubMed] [Google Scholar]
- 5.Pober JS, Kluger MS, Schechner JS. Human endothelial cell presentation of antigen and the homing of memory/effector T cells to skin. Ann NY Acad Sci. 2001;941:12–25. doi: 10.1111/j.1749-6632.2001.tb03706.x. [DOI] [PubMed] [Google Scholar]
- 6.Marelli-Berg FM, Jarmin SJ. Antigen presentation by the endothelium: a green light for antigen-specific T cell trafficking? Immunol Lett. 2004;93:109–13. doi: 10.1016/j.imlet.2004.03.014. [DOI] [PubMed] [Google Scholar]
- 7.Imagawa A, Hanafusa T, Tamura S, et al. Pancreatic biopsy as a procedure for detecting in situ autoimmune phenomena in type 1 diabetes: close correlation between serological markers and histological evidence of cellular autoimmunity. Diabetes. 2001;50:1269–73. doi: 10.2337/diabetes.50.6.1269. [DOI] [PubMed] [Google Scholar]
- 8.Itoh N, Hanafusa T, Miyazaki A, et al. Mononuclear cell infiltration and its relation to the expression of major histocompatibility complex antigens and adhesion molecules in pancreas biopsy specimens from newly diagnosed insulin-dependent diabetes mellitus patients. J Clin Invest. 1993;92:2313–22. doi: 10.1172/JCI116835. [DOI] [PMC free article] [PubMed] [Google Scholar]
- 9.Somoza N, Vargas F, Roura-Mir C, et al. Pancreas in recent onset insulin-dependent diabetes mellitus. Changes in HLA, adhesion molecules and autoantigens, restricted T cell receptor V beta usage, and cytokine profile. J Immunol. 1994;153:1360–77. [PubMed] [Google Scholar]
- 10.Anderson MS, Bluestone JA. The NOD mouse: a model of immune dysregulation. Annu Rev Immunol. 2005;23:447–85. doi: 10.1146/annurev.immunol.23.021704.115643. [DOI] [PubMed] [Google Scholar]
- 11.Gearon CL, Hussain MJ, Vergani D, Peakman M. Lymphocyte vaccination protects prediabetic non-obese diabetic mice from developing diabetes mellitus. Diabetologia. 1997;40:1388–95. doi: 10.1007/s001250050840. [DOI] [PubMed] [Google Scholar]
- 12.Smerdon RA, Peakman M, Hussain MJ, Vergani D. Lymphocyte vaccination prevents spontaneous diabetes in the non-obese diabetic mouse. Immunology. 1993;80:498–501. [PMC free article] [PubMed] [Google Scholar]
- 13.Xu XJ, Gearon C, Stevens E, Vergani D, Baum H, Peakman M. Spontaneous T-cell proliferation in the non-obese diabetic mouse to a peptide from the unique class II MHC molecule, I-Ag7, which is also protective against the development of autoimmune diabetes. Diabetologia. 1999;42:560–5. doi: 10.1007/s001250051195. [DOI] [PubMed] [Google Scholar]
- 14.Lozanoska-Ochser B, Barone F, Pitzalis C, Peakman M. Atorvastatin fails to prevent the development of autoimmune diabetes despite inhibition of pathogenic beta-cell-specific CD8 T-cells. Diabetes. 2006;55:1004–10. doi: 10.2337/diabetes.55.04.06.db05-1261. [DOI] [PubMed] [Google Scholar]
- 15.Lieberman SM, Evans AM, Han B, et al. Identification of the beta cell antigen targeted by a prevalent population of pathogenic CD8+ T cells in autoimmune diabetes. Proc Natl Acad Sci USA. 2003;100:8384–8. doi: 10.1073/pnas.0932778100. [DOI] [PMC free article] [PubMed] [Google Scholar]
- 16.Hakenberg J, Nussbaum AK, Schild H, et al. MAPPP: MHC class I antigenic peptide processing prediction. Appl Bioinformatics. 2003;2:155–8. [PubMed] [Google Scholar]
- 17.Loos T, Dekeyzer L, Struyf S, et al. TLR ligands and cytokines induce CXCR3 ligands in endothelial cells: enhanced CXCL9 in autoimmune arthritis. Lab Invest. 2006;86:902–16. doi: 10.1038/labinvest.3700453. [DOI] [PubMed] [Google Scholar]
- 18.Middleton J, Patterson AM, Gardner L, Schmutz C, Ashton BA. Leukocyte extravasation: chemokine transport and presentation by the endothelium. Blood. 2002;100:3853–60. doi: 10.1182/blood.V100.12.3853. [DOI] [PubMed] [Google Scholar]
- 19.van den Elsen PJ, Holling TM, Kuipers HF, van der Stoep N. Transcriptional regulation of antigen presentation. Curr Opin Immunol. 2004;16:67–75. doi: 10.1016/j.coi.2003.11.015. [DOI] [PubMed] [Google Scholar]
- 20.Kay TW, Campbell IL, Oxbrow L, Harrison LC. Overexpression of class I major histocompatibility complex accompanies insulitis in the non-obese diabetic mouse and is prevented by anti-interferon-gamma antibody. Diabetologia. 1991;34:779–85. doi: 10.1007/BF00408350. [DOI] [PubMed] [Google Scholar]
- 21.Ono SJ, Issa-Chergui B, Colle E, Guttmann RD, Seemayer TA, Fuks A. IDDM in BB rats. Enhanced MHC class I heavy-chain gene expression in pancreatic islets. Diabetes. 1988;37:1411–18. [PubMed] [Google Scholar]


